Report
The Professional version of ntopng allows to generate custom traffic reports for one or more interfaces monitored. Report page, reachable from the dropdown home menu in the main toolbar, presents the user with multiple configuration options.
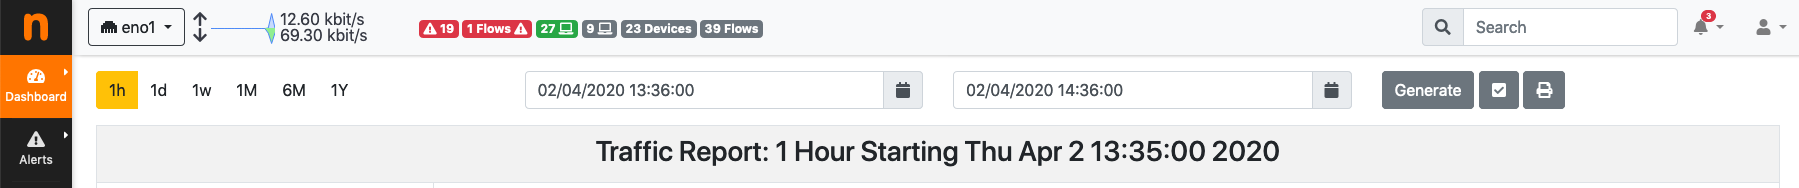
The Top of the Report Page
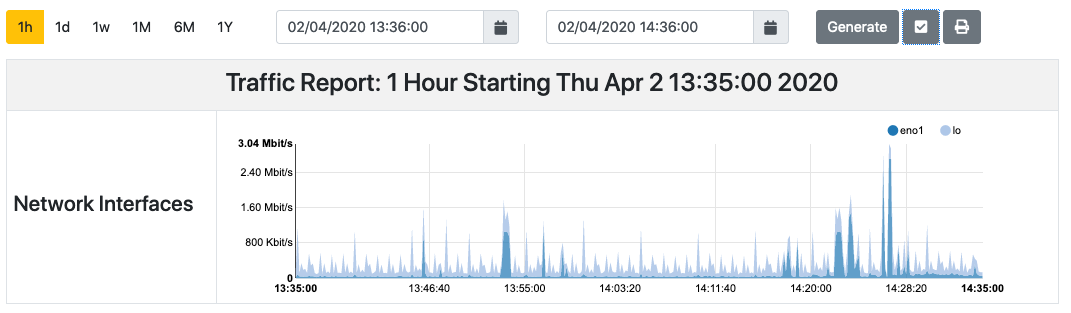
Fixed-width temporal intervals are available on the left. They are 1h (one hour), 1d (one day), 1w (one week), 1M (one month), 6M (six months), and 1Y (one year). A click on any of those intervals produces an automatic report that spans a time range that starts at the present and that goes backwards in time until the clicked interval is reached.
Exact temporal intervals can be chosen using the two dropdown date time pickers in the center. The first and the second pickers are used to specify the start and the end of a custom report, respectively. Once dates and times have been chosen, the report is obtained by clicking on ‘Generate’.
The small checkbox icon right of the ‘Generate’ button allows to select one or more of the available monitored interfaces, as well as application protocols of interest. Clicking on it yields the following overlaid menu.
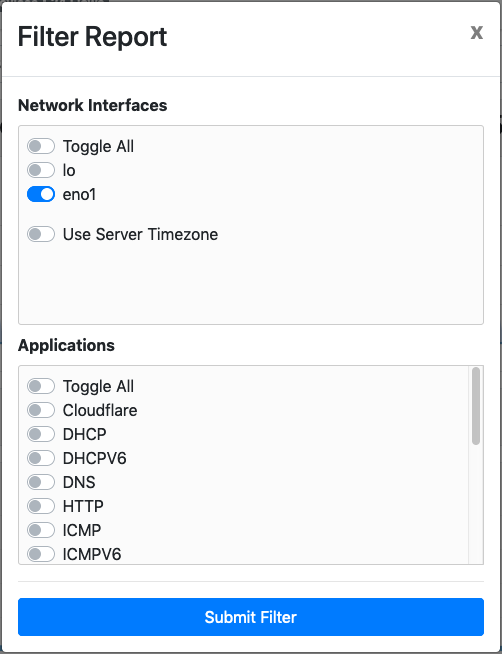
Report Filter Overlay
Finally, the rightmost icon generates a printer-friendly report ready to be printed.
Reports contain charts of monitored interfaces overall traffic, local versus remote traffic, local networks traffic, as well as the traffic grouped by:
- Application Protocols (e.g., HTTPS, Skype)
- Countries
- Local Hosts (hosts belonging to local networks) and Remote Hosts (hosts belonging to remote networks)
- Local Operating Systems
- Autonomous Systems
In the remainder of this section are screenshots of reported information discussed above.
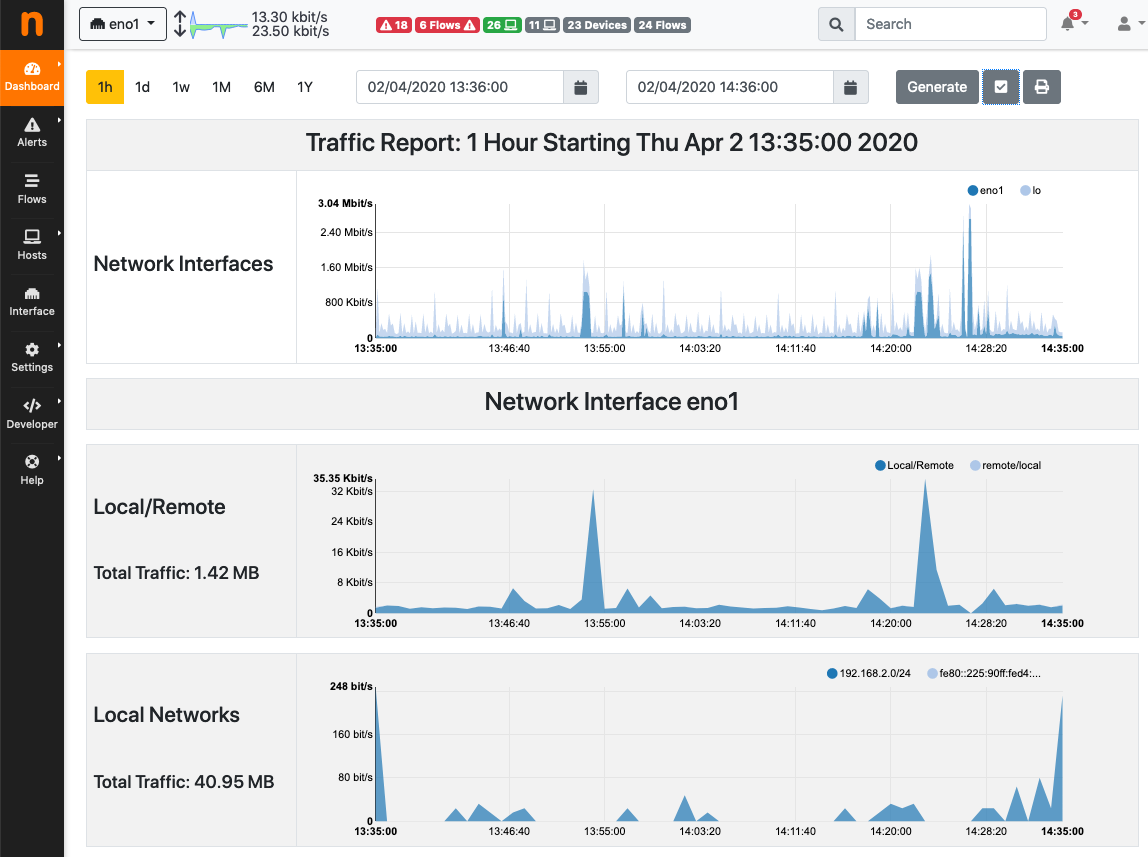
Report - Network Interfaces and Traffic
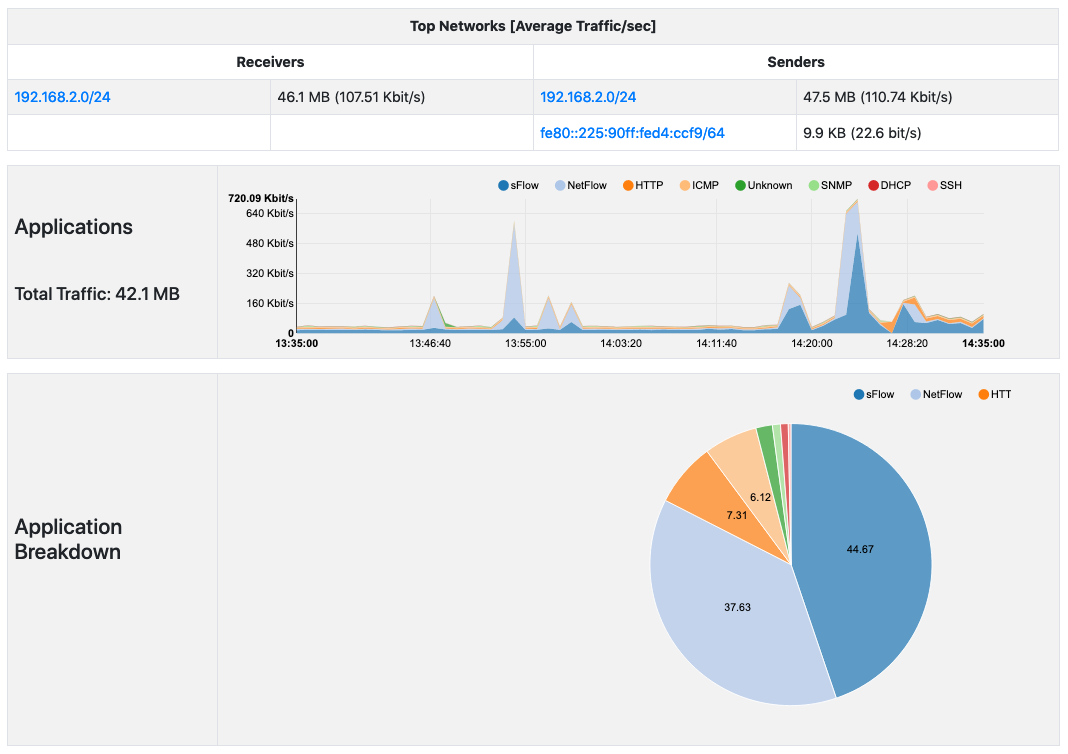
Report - Top Networks and Applications
Report - Monitored Network Interfaces Summary
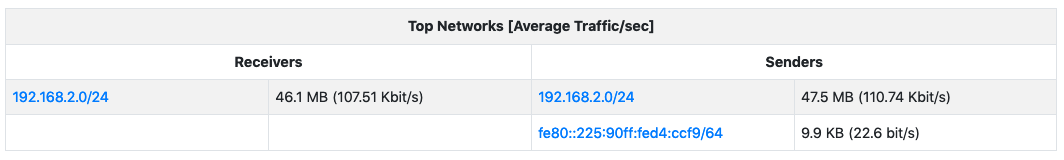
Report - Top Networks
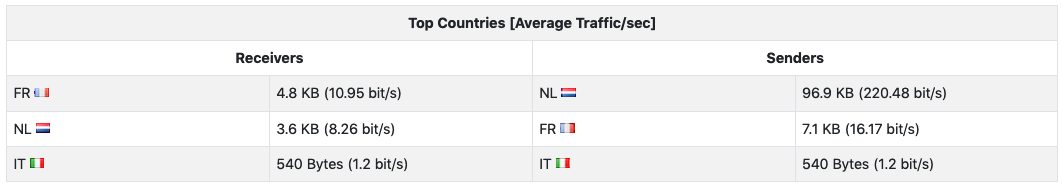
Report - Top Countries
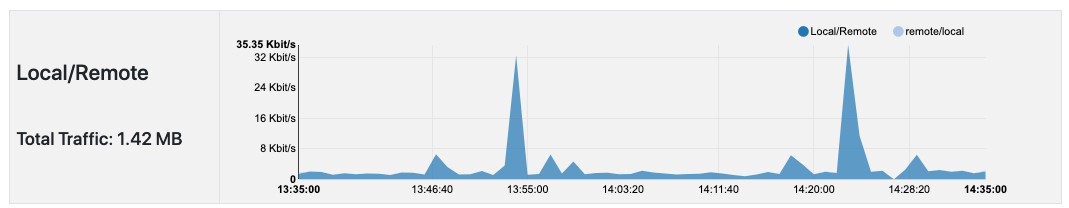
Report - Local to Remote and Remote to Local Traffic
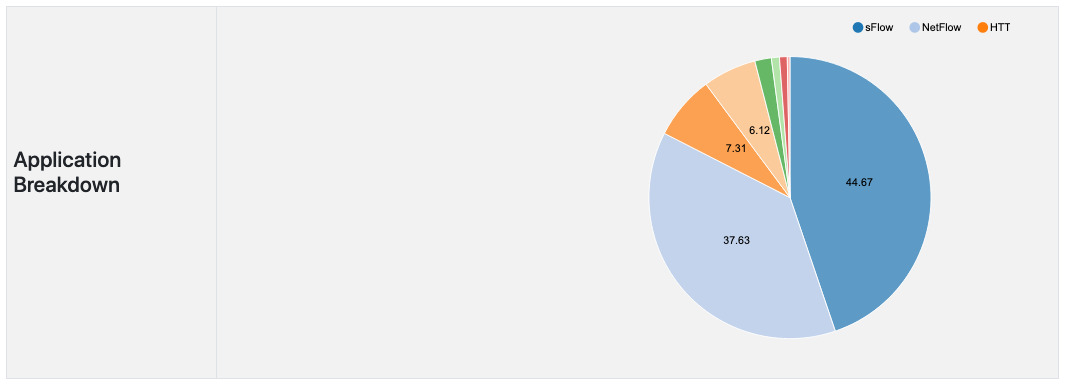
Report - Application Breakdown
Activity Report
In the enterprise version of ntopng it’s also possible to get a detailed tabular report of a single host, interface or network traffic over a specific time frame.
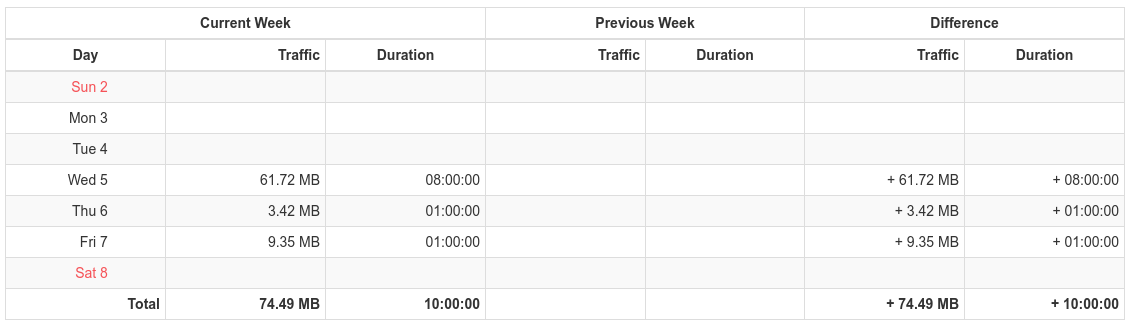
Host Activity Report
Warning
The report is currently not available when using InfluxDB as the timeseries driver.
The report provides daily, weekly and monthly details on the total traffic made by the entity (host in this case) and the total duration the host has been active on the network. It also provides the previous period data as long as comparison columns to easily analyze the difference between the two periods.
Via the date picker at the top of the chart it’s possible to easily jump to another period. The right and left arrows provide a convenient way to jump to the next and previous period respectively. Via the “Today” button it’s possible to jump to the current day view, which show the traffic entity during the different hours of the day.
Note
The report is based on the timeseries data. It is necessary to enable the traffic timeseries in order to display it.
Historical Flow Report
Reports can also be generated for historical flows when ntopng is started with option F as described in the Flows Dump documentation. Multiple downstream stores are supported. See Historical Flow Report for additional information.