Host Details
The host details pages provide many insights on the information collected for an host.
The navigation bar entries are discussed below. Since the entries are contextual, some of them may be hidden.
Home
Home is the default view of the Host Details page and provides detailed information including host MAC Address (or the last router MAC address if the host is remote), IP Address (with network mask if detected), a toggle to activate/deactivate alerts for the host, a checkbox to enable packet dump for the specific host, symbolic hostname (or IP address), location (local or remote), date and time of first and last packet seen for the host, traffic breakdown, amount of traffic packets received/sent, number of flows as client/server host. All of this information is also available in JSON format by clicking on the ‘Download’ link. The heat map provides the Activity Map for each host. Each box represents one minute of traffic. By default, Activity Map shows the last six hours, but it is possible to set a different timeframe using the controls.
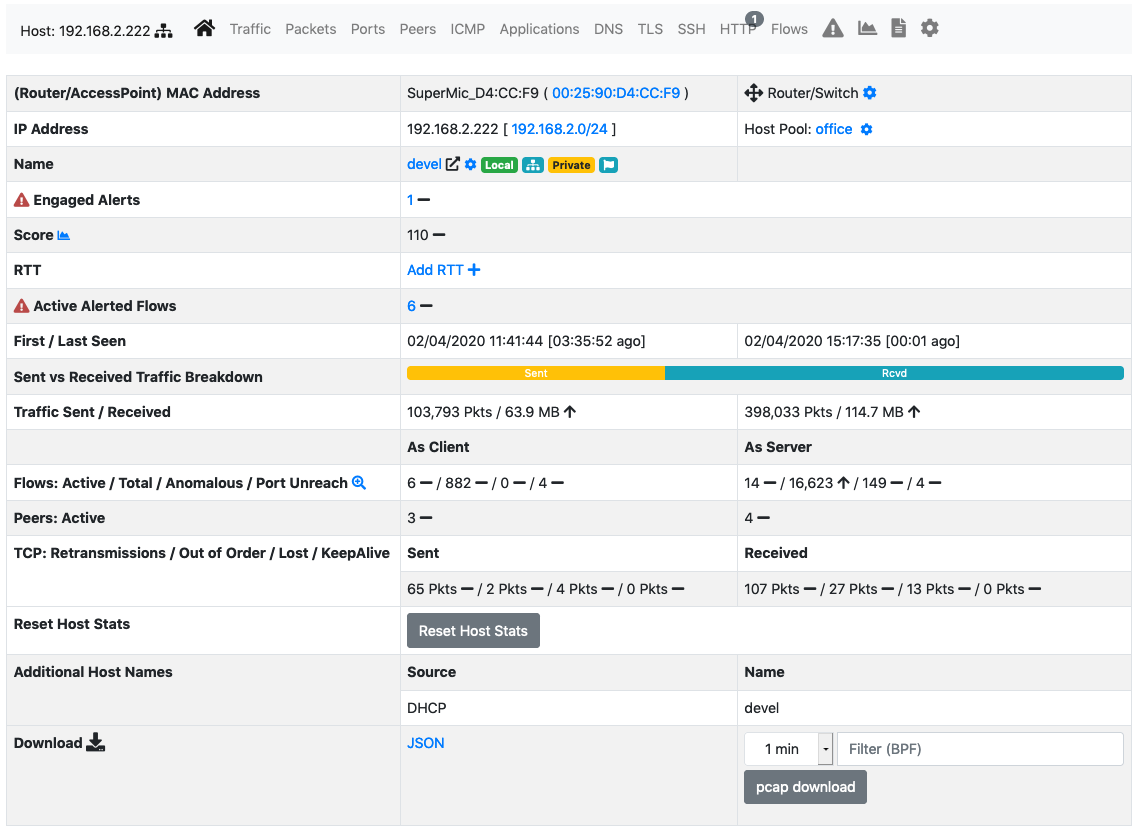
The Home View of the Host Details Page
Traffic
The Traffic Page provides Layer-4 protocol statistics for the host. A pie chart showing L-4 protocol breakdown is show at the top of page. A table with detailed statistics is shown below the chart.
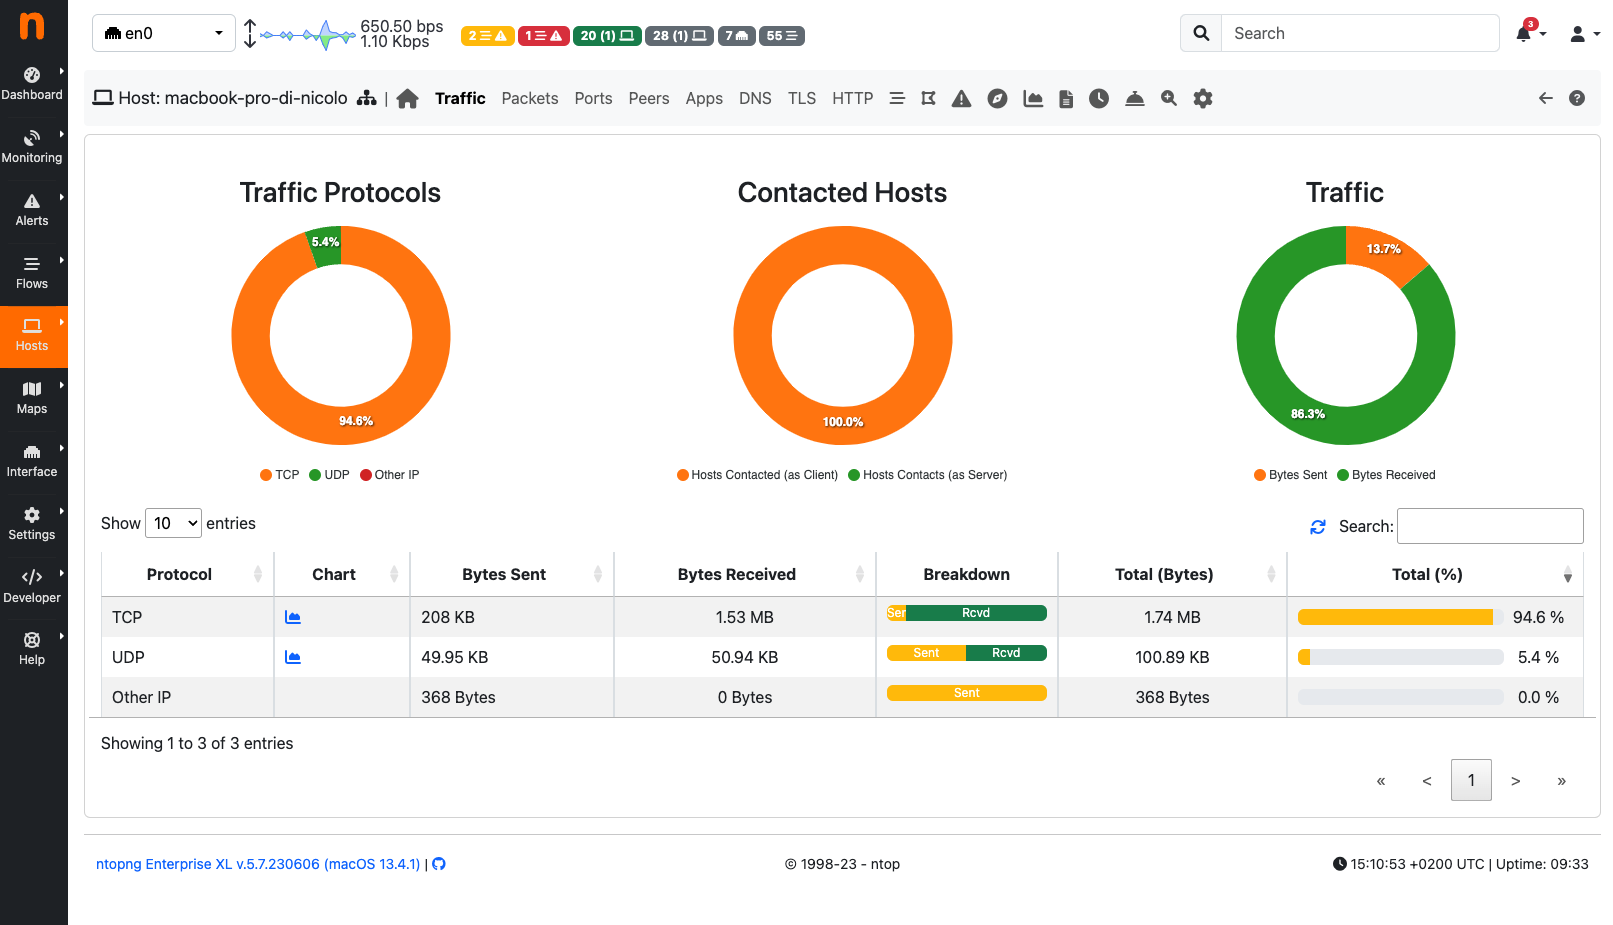
The Traffic View of the Host Details Page
Packets
Packets page provides pie charts with packet size distribution, both for sent and received packets.
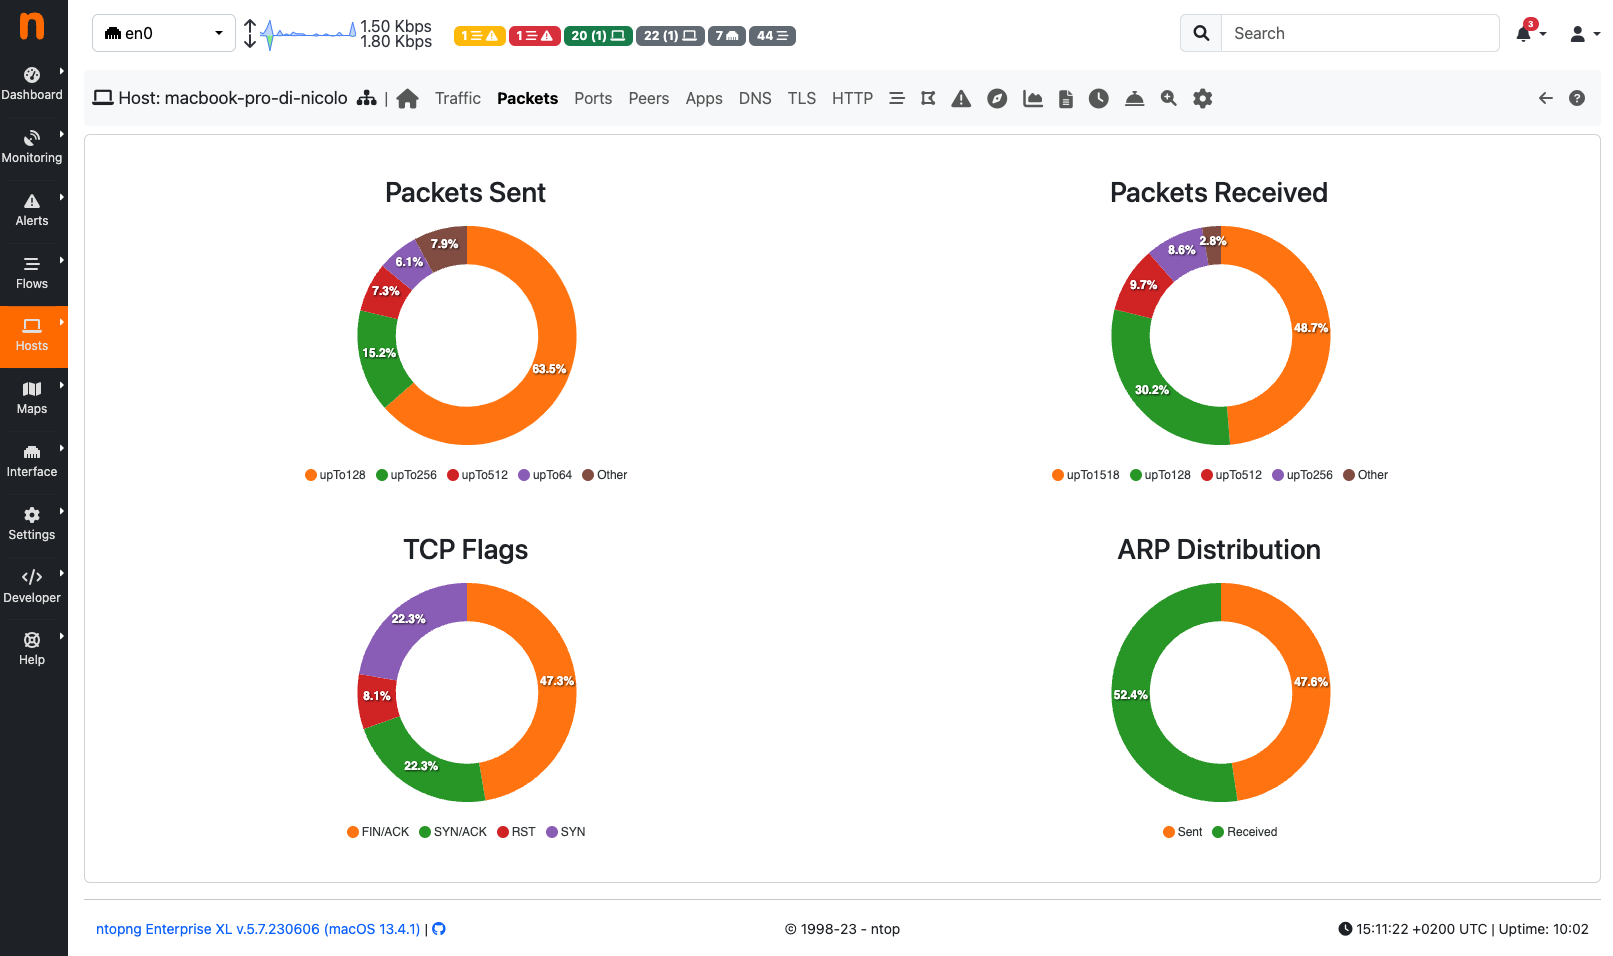
The Packets View of the Host Details
Ports
Ports page provides pie charts with traffic statistics grouped by port. A chart is available for client ports and another one is available for server ports.
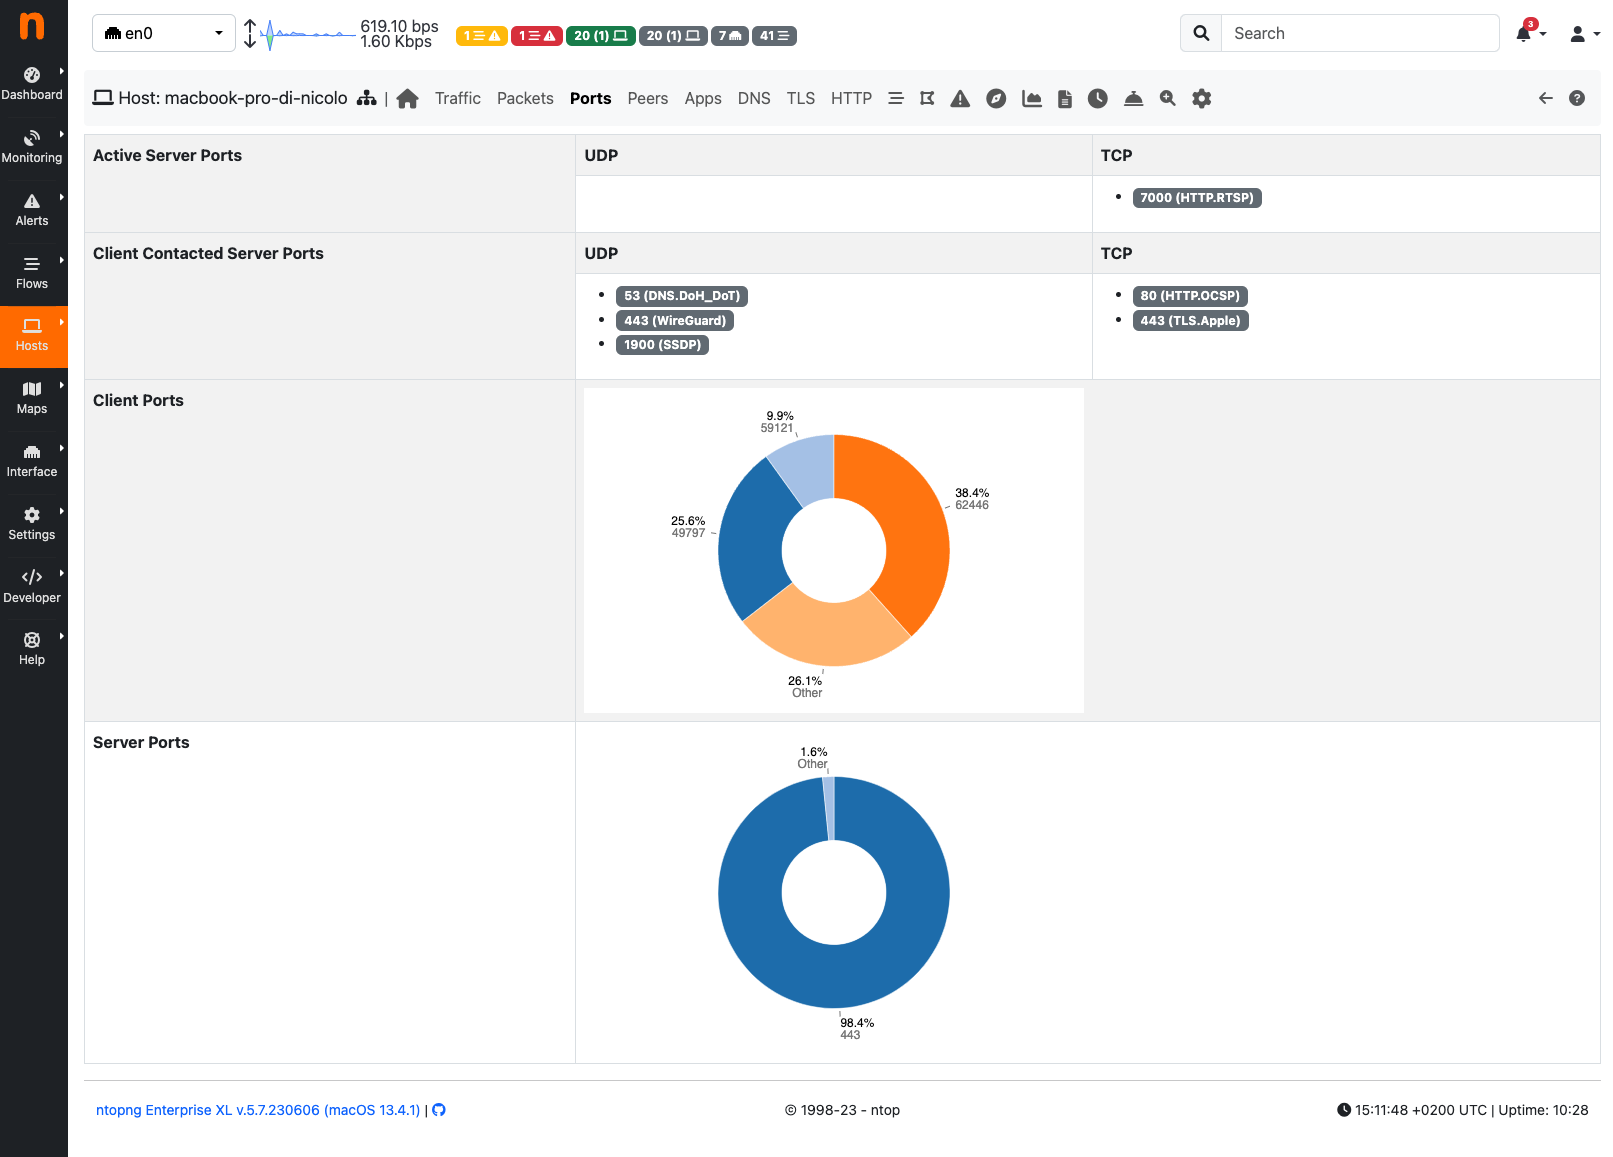
The Ports View of the Host Details Page
Peers
Peers page presents a graphical overview of top contacted peers and top protocols used. In the following screenshot some hosts are struck-through intentionally for privacy reasons. A table with top application per peer is shown below the graphical overview. Every information is clickable to allow the user to drill down and find insights.
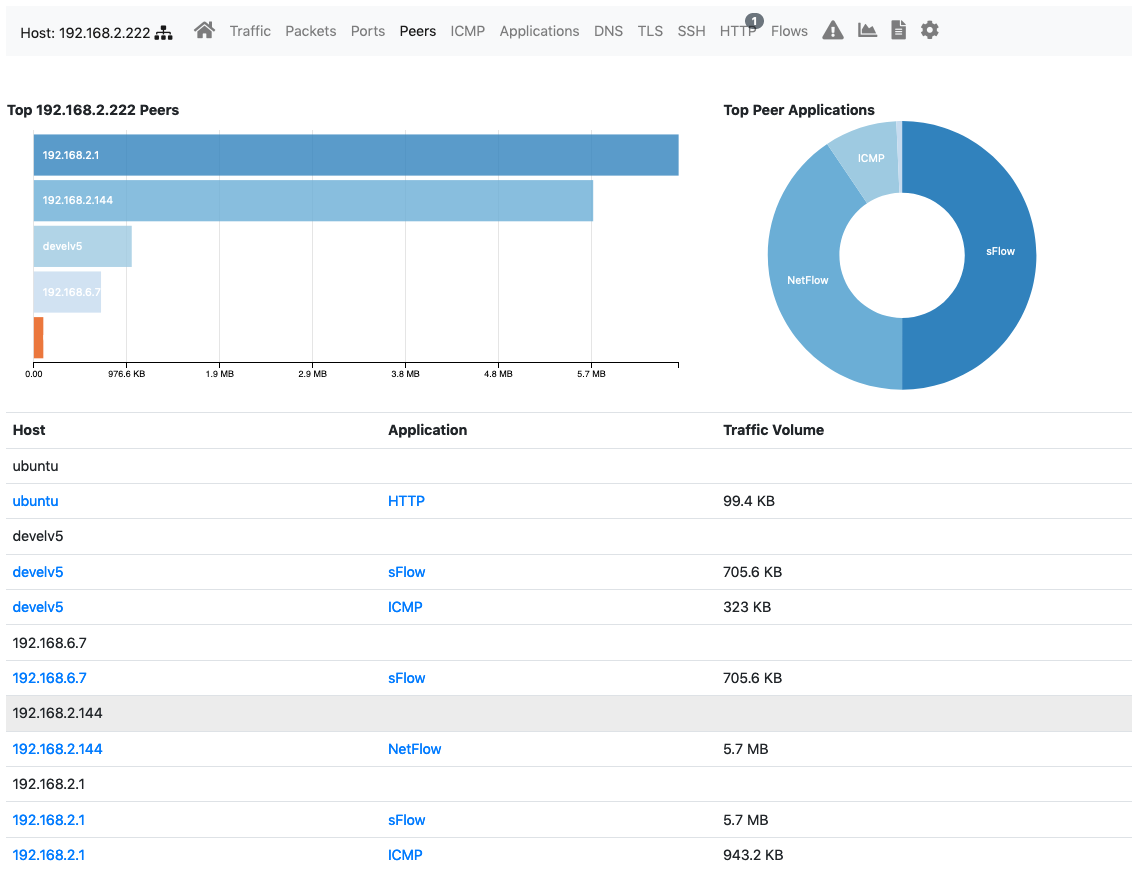
The Peers View of the Host Details Page
Applications
Using the DPI information, this page provides in pie chart and tabular format the amount of traffic divided by application. An additional pie chart provides a statistics about protocol type. A click on the protocol name redirects the user to the page with detailed statistics about the selected protocol.
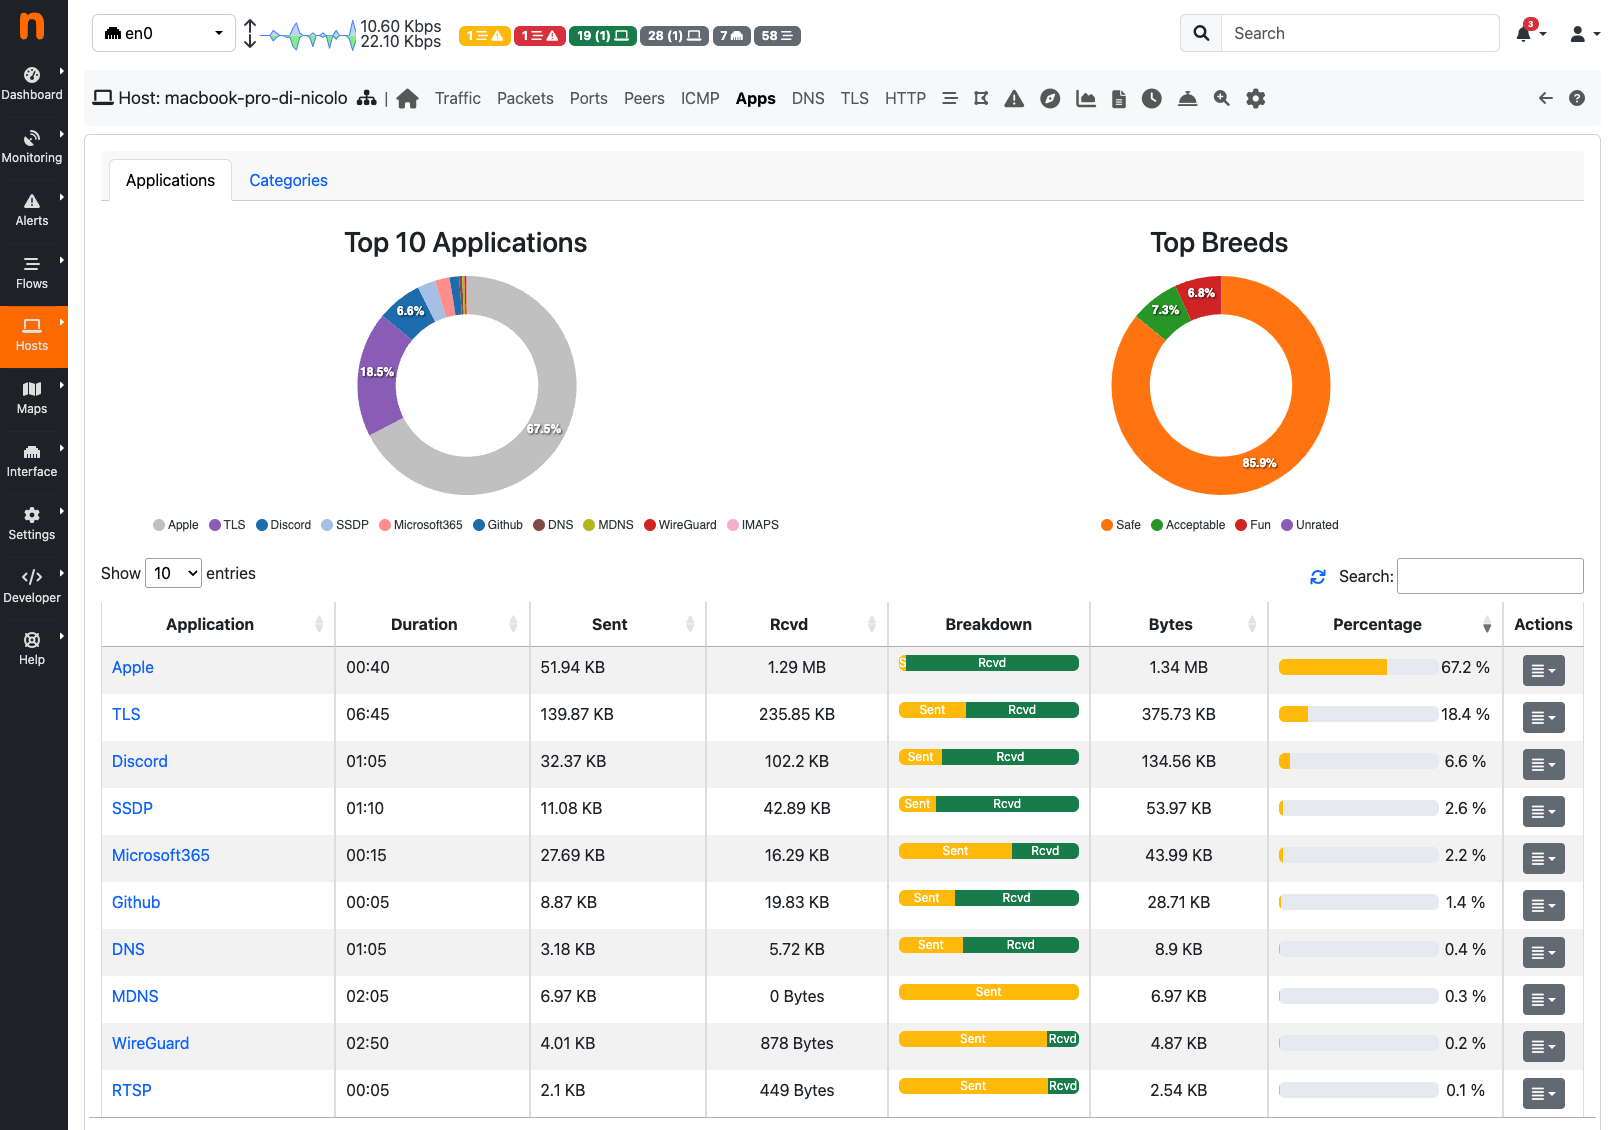
The Protocols View of the Host Details Page
TLS
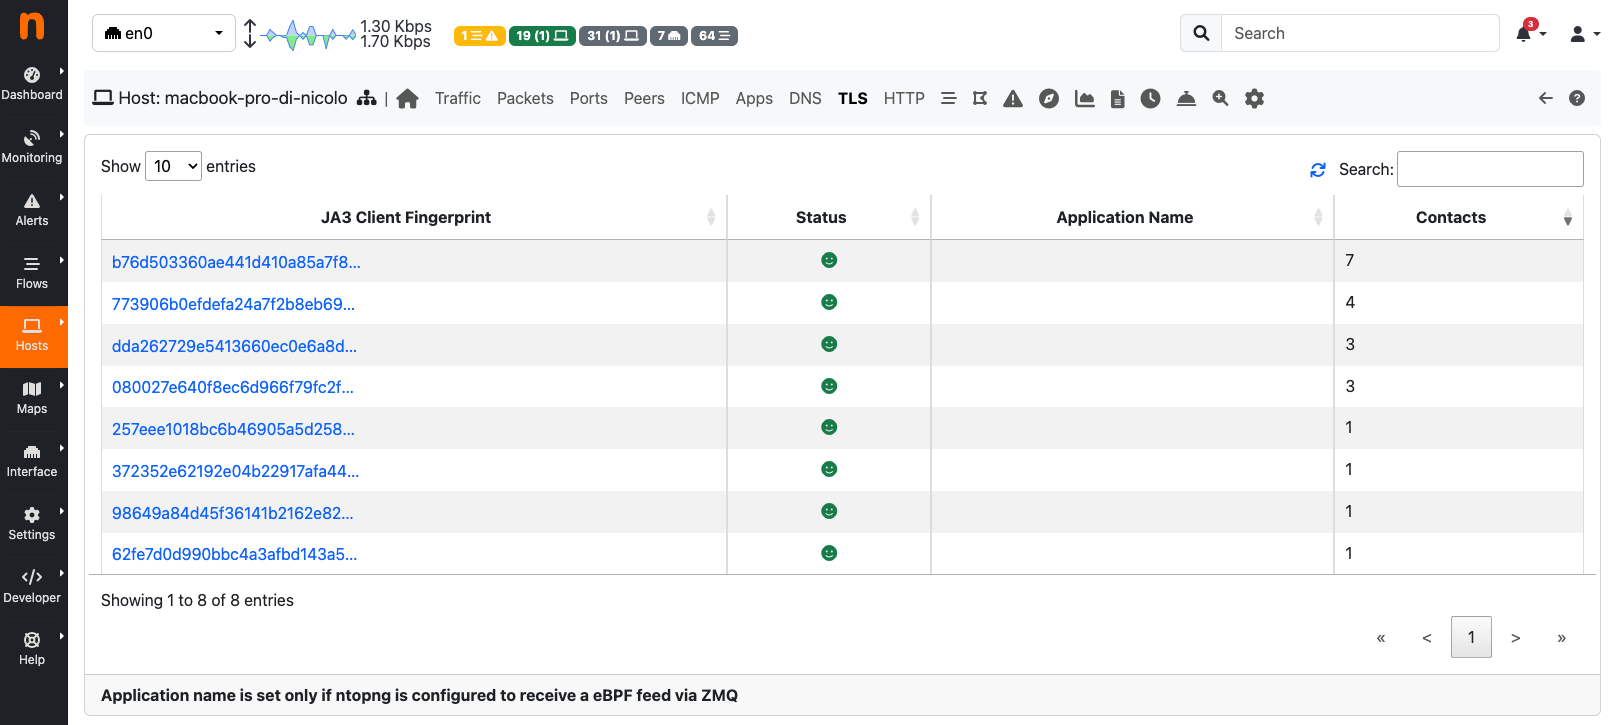
The TLS View of the Host Details Page
ntopng registers the JA3 TLS fingerprints of an host (either when the host is a client or a server) along with their the number of uses. As explained in the Flows section, this information is very important in order to uncover possible threats on the encrypted traffic. By clicking on the signature it is possible to manually check if the JA3 signature corresponds to a known malware into the abuse.ch database.
By taking a snapshot of the signatures registered on an host it is possible to know, for example, if the host has installed a new program or has updated an existing one. This may be very important on environments where the programs installed into an host are not supposed to change.
By enabling the nProbe Agent integration, this view can be further augmented with the name of the process which initiated or received the TLS connection.
SSH
ntopng registers the HASSH fingerprints of an host, either when the host initiates or receives an SSH connection, along with their the number of uses. As explained in the related Flows section, this information can be used to identify malicious applications or vulnerable SSH versions.
DNS
The chart and the table displayed on this page report DNS statistics, such as the number of queries, their type (e.g., A, AAAA, PTR, and so on), and possible errors.
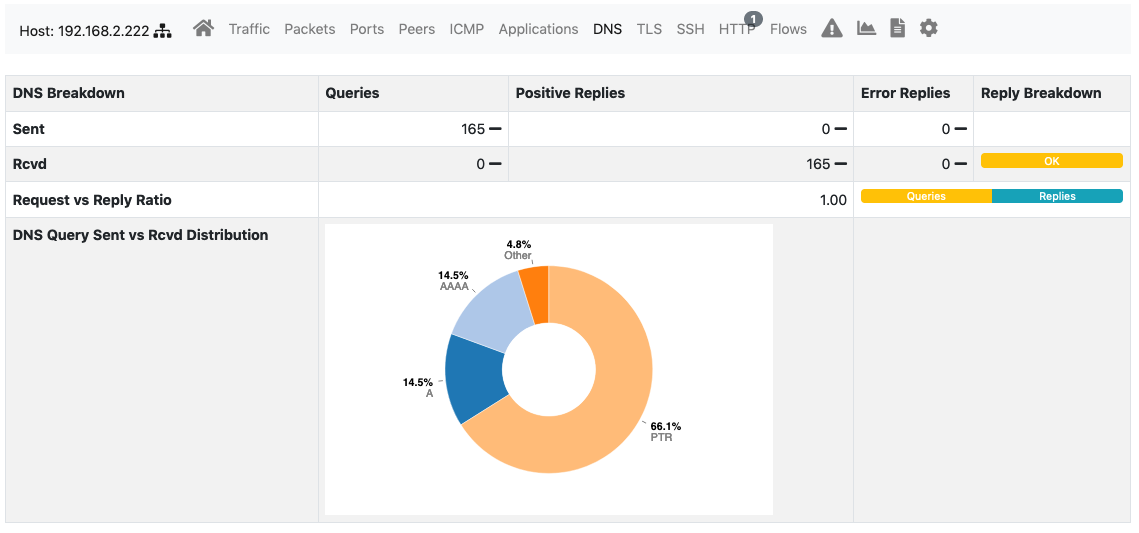
The DNS View of the Host Details Page
HTTP
This page provides information about the HTTP protocol in terms of requests done and responses received for each HTTP method, together with response codes. Counters are provided both as tables and pie charts. In the case of virtual host being detected, a badge with the number of virtual hosts detected for the same IP address is displayed in the host bar and an entry for each virtual server is displayed in a virtual server table.
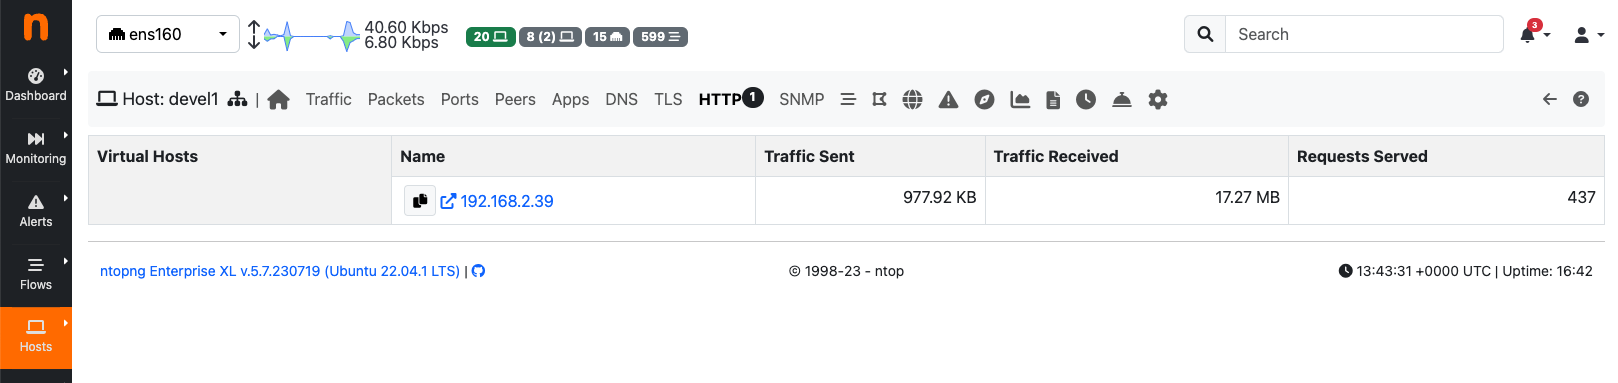
The HTTP View of the Host Details Page with Virtual Hosts
Sites
ntopng can keep track of top visited sites for any monitored local host. Enabling the tracking of top visited sites requires preference “Top HTTP Sites” to be set using the ntopng preferences page.
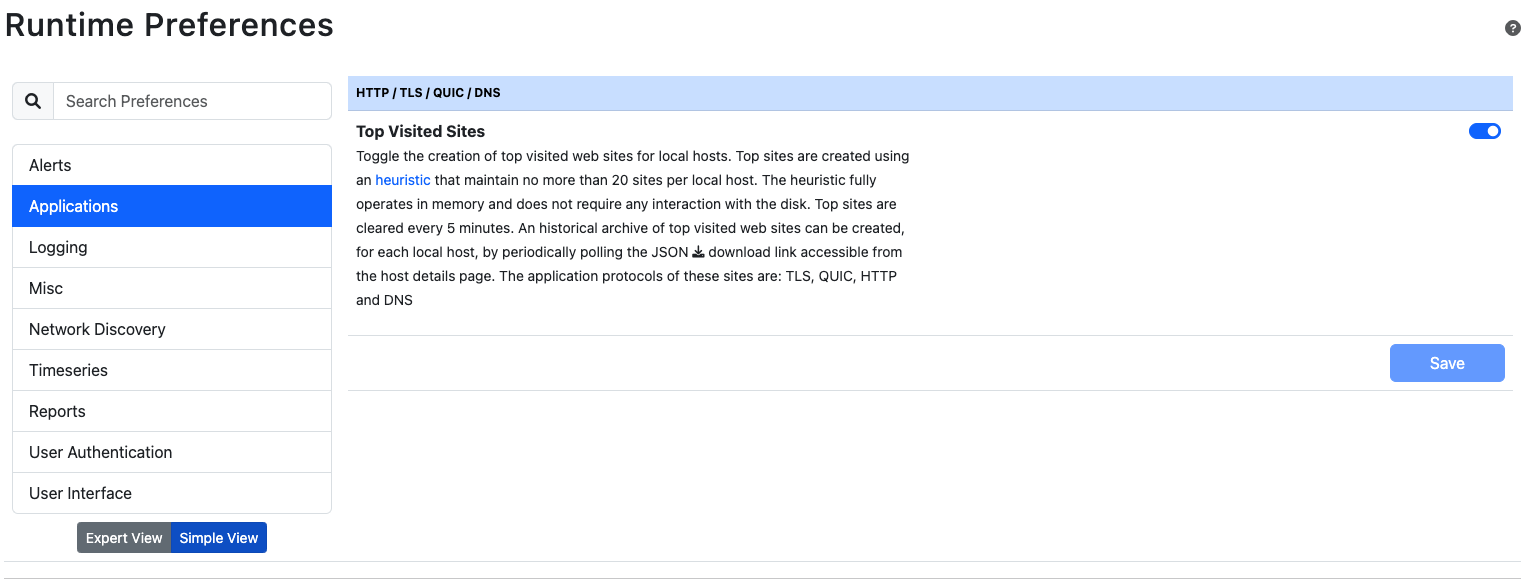
The Preferences Page to Enable Visited Sites
Once the preference has been enabled, this page will start showing visited websites, which are shown over the two most recent 5-minute intervals. Newly visited sites are placed under the “Current Sites”. Every 5 minutes ntopng moves the “Current Sites” under “Last 5 Minute Sites”, and starts over with a clean “Current Sites”.

The Sites View of the Host Details Page
Column “Contacts” count the number of time a particular website has been visited. Every time the host visit a site, the corresponding “Contacts” counter is increased by one.
Note
This page is only available in the Host Details page menu when there is at least one visited website.
Flows
Flows page lists all active flows that have the selected host as an endpoint. A section of this manual discuss in greater detail the statistics shown for flows.
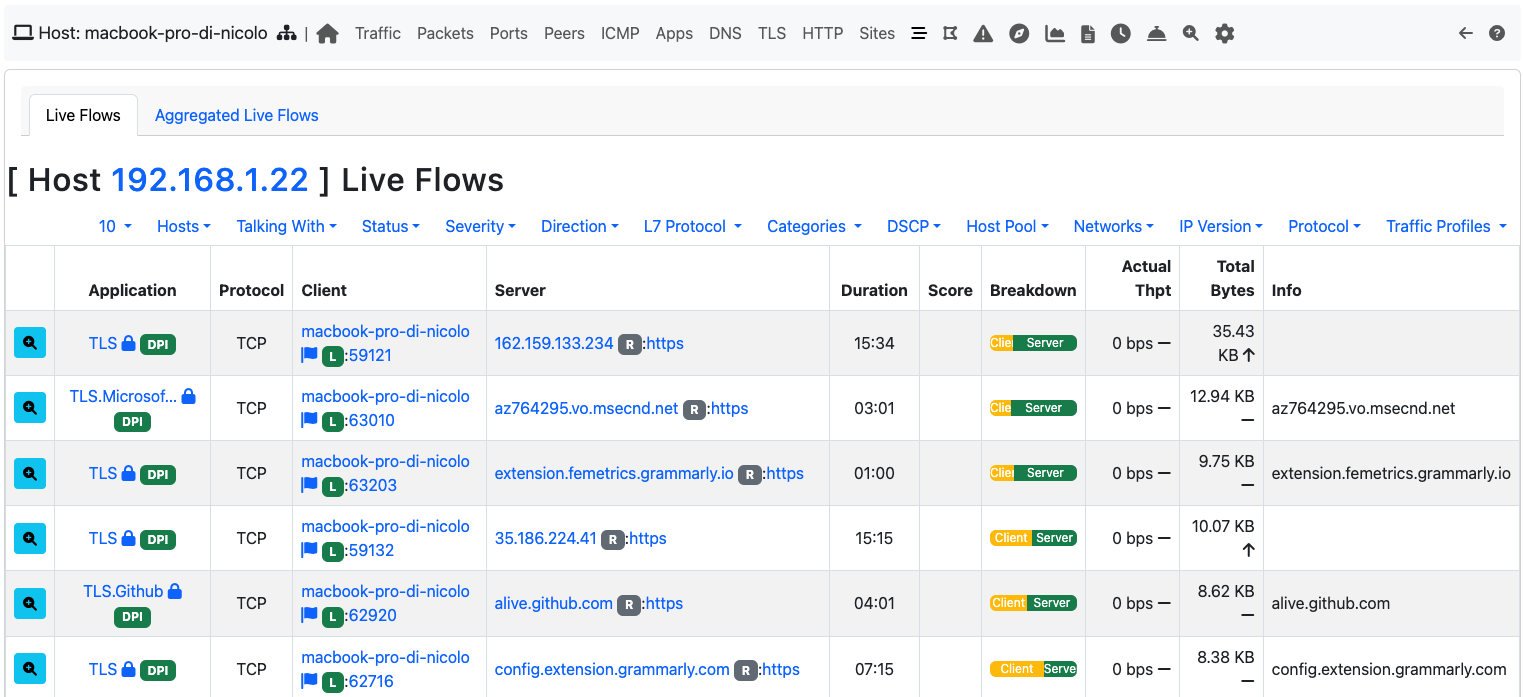
The Flows View of the Host Details Page
SMNP
SMNP page provides SNMP information for the selected host with all the standard SNMP traffic metrics.
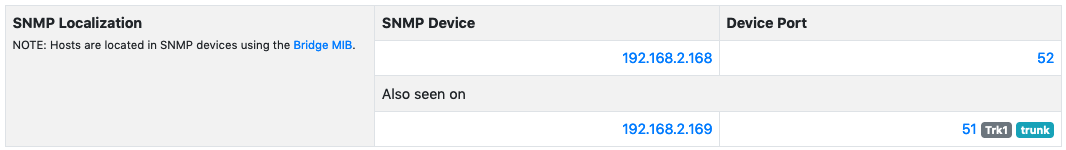
The SMNP View of the Host Details Page
Talkers
Talkers page provides top talkers having active flows with selected host. Similarly to the Community edition dashboard, top talkers are laid out in a Sankey Diagram.
Geomap
Geomap page provides an interactive map that shows the selected hosts, its flows, and its peers.
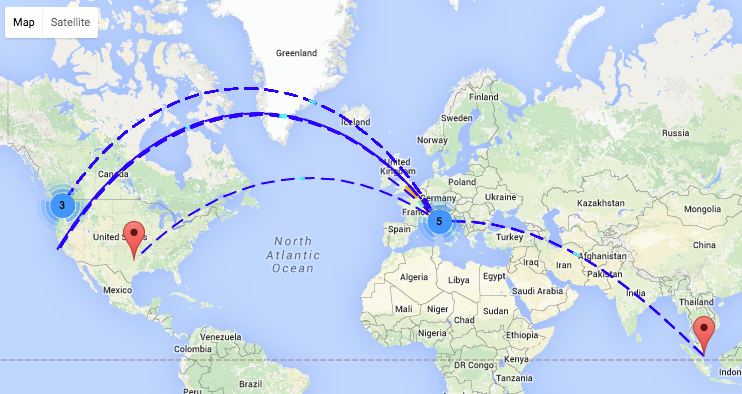
The Geomap View of the Host Details Page
Alerts Configuration
Alerts Configuration page enables the user to set custom thresholds on multiple metrics, and to trigger alerts based on those thresholds. Alerts can be armed, among other metrics, per total bytes, DNS traffic, P2P traffic or packets, in a fixed time interval. Available time intervals are 1 and 5 minutes, 60 minutes, and 1 day. Two columns are available for configuration. The first affects only the selected local host, whereas the second affects all local hosts. Alerts can be configured from the host Checks.
Statistics
Statistics page provides historical traffic statistics for the selected host. The user can choose to filter statistics on a protocol basis and display data in several formats (e.g., bytes, packets, flows, and so on).
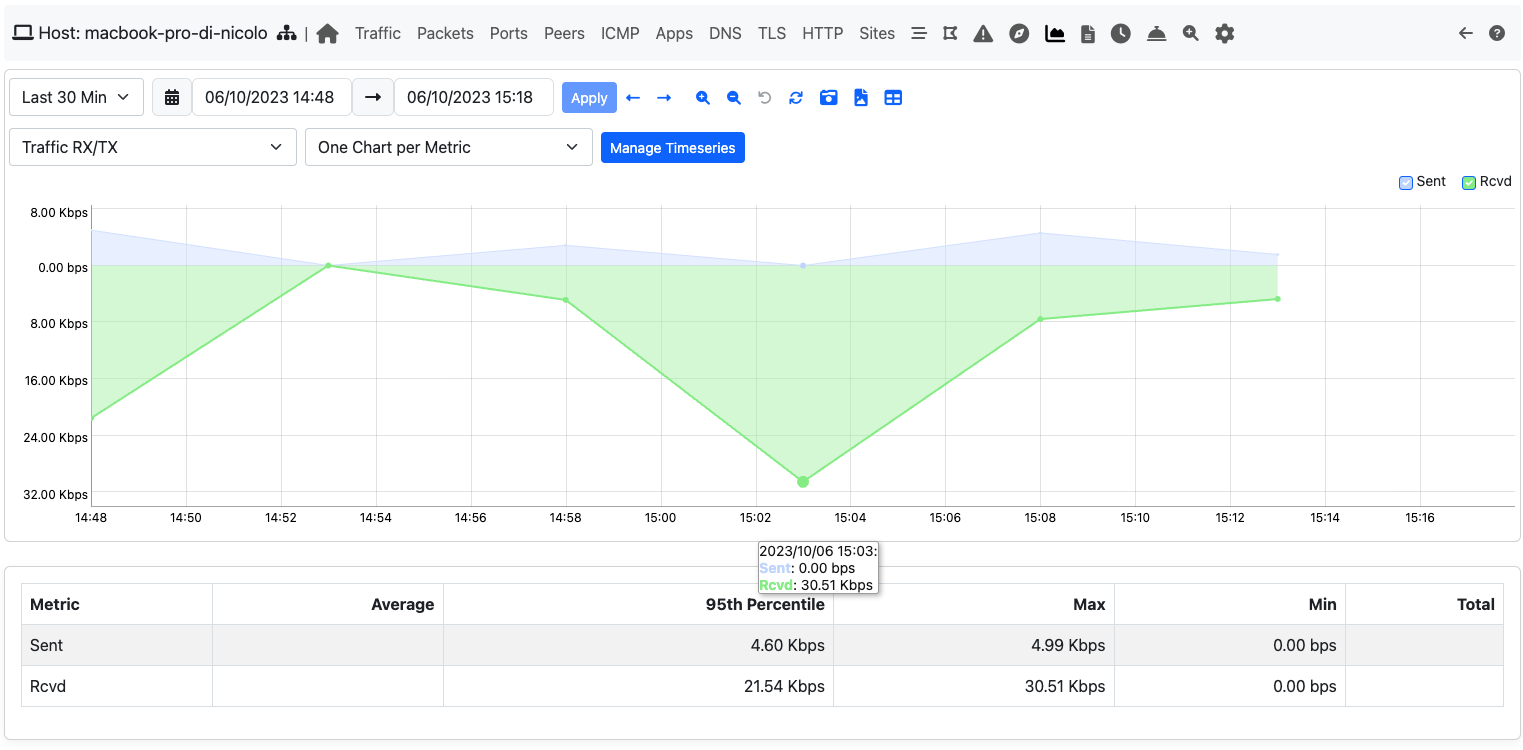
The Statistics View of the Host Details Page
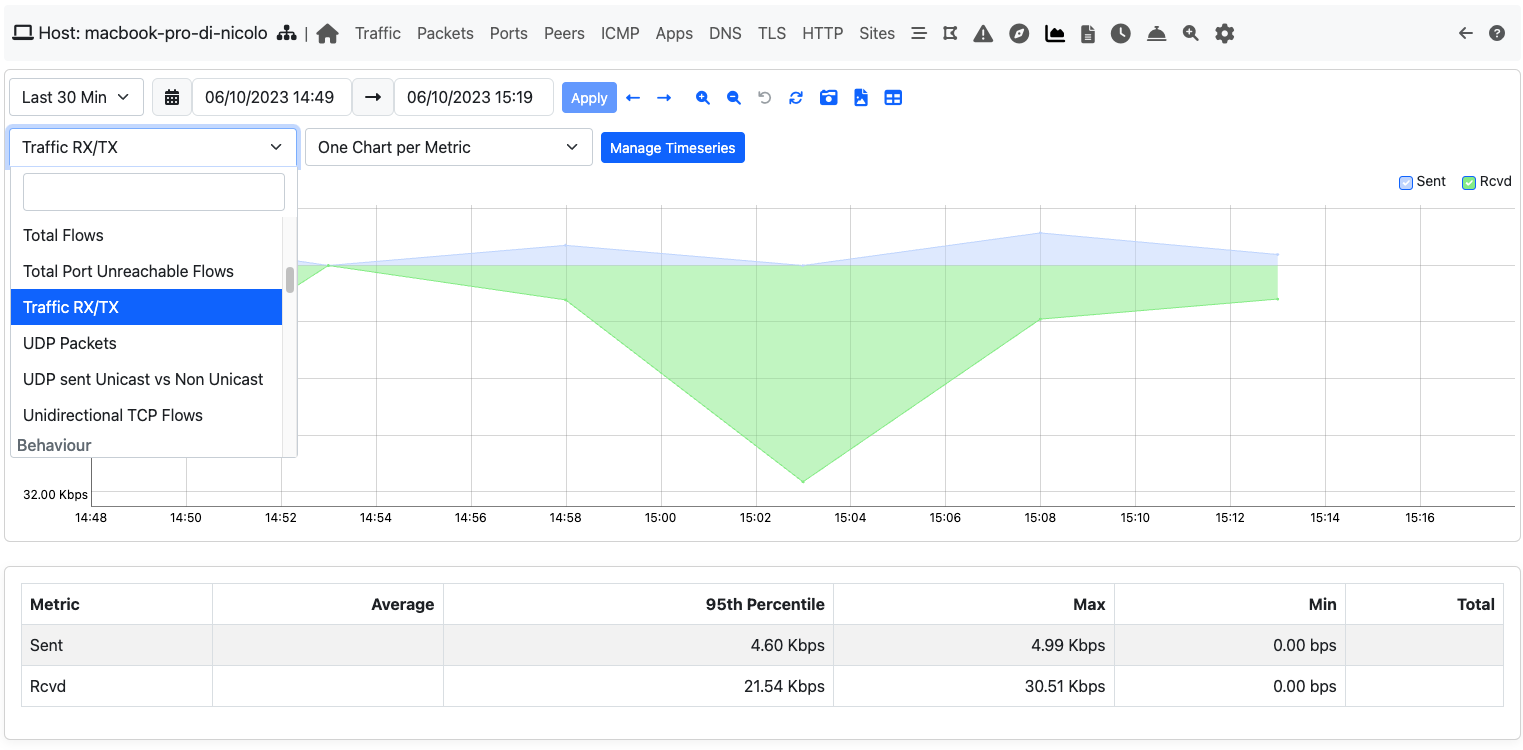
The Dropdown menu in The Statistics View of the Host Details Page