Traffic Visibility
This section shows the options for having visibility of the traffic under mitigation.
Statistics
The application provides global and per-victim statistics.
Global statistics are available through the logs:
tail -f /var/tmp/nscrub.log
or through the REST API:
curl -u <user>:<password> "http://<host>:<port>/stats"
Per-victim stats are available through the REST API:
curl -u <user>:<password> "http://<host>:<port>/targets?action=stats&target_id=<target id>"
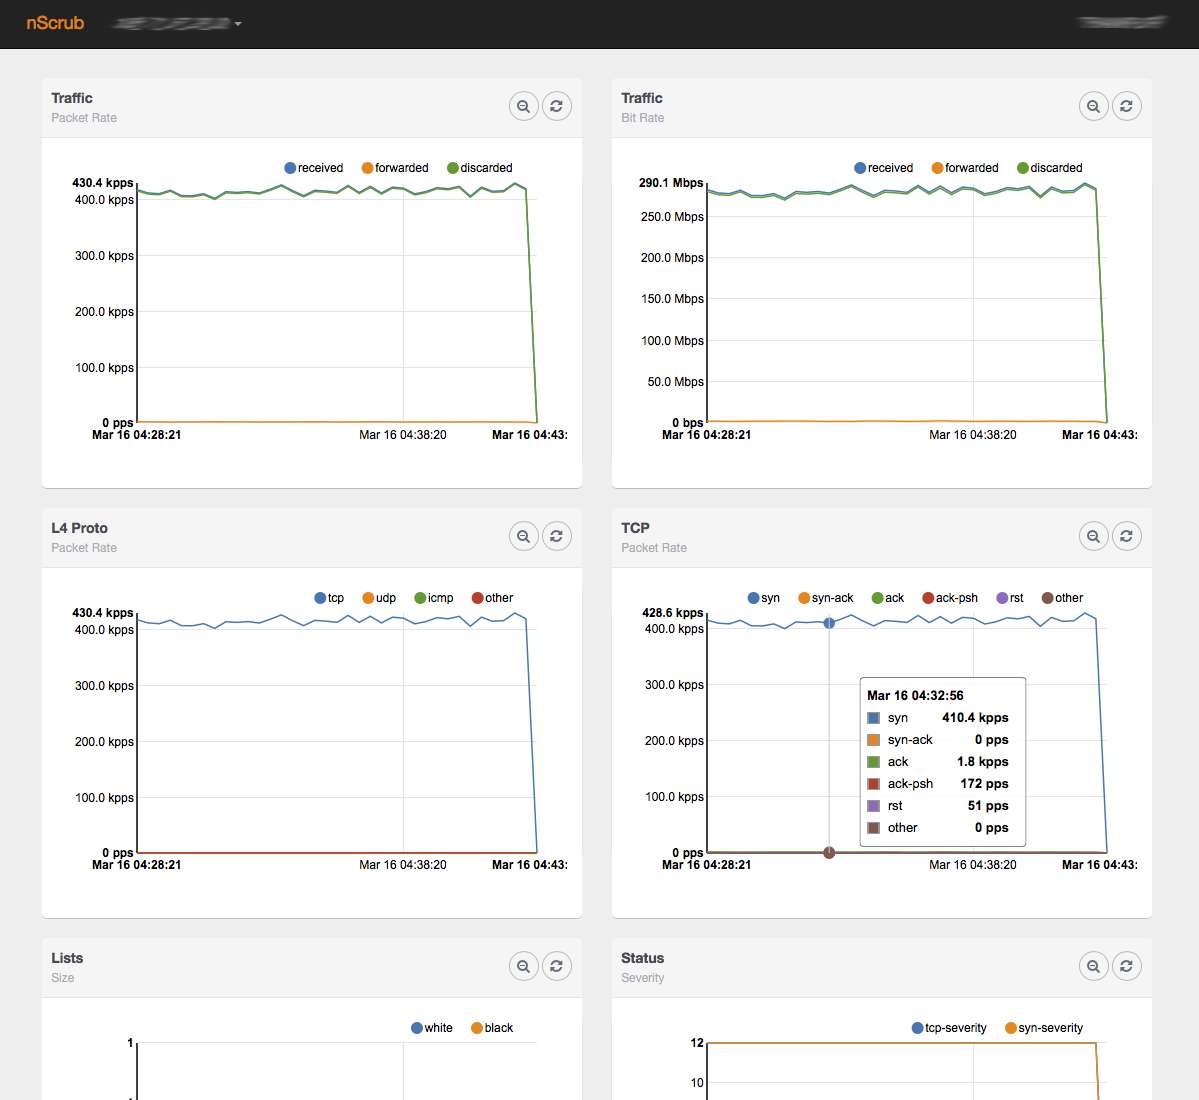
Historical statistics from RRDs, both global and per-victim, are also available using a browser connecting to http://<host>:<port>/monitor.html
Note
nScrub listens on localhost by default, please configure a different address (-G option) to connect using a browser on a remote machine.
Traffic Monitoring
The software has the ability to export some traffic to software queues for attaching external applications, for traffic analysis or recording:
In order to enable auxiliary software queues for traffic monitoring, the –aux-queues|-O option has to be added to the nScrub configuration file, specifying the number of queues to allocate, which matches the maximum number of concurrent application that will monitor the traffic (queues are single consumer).
--aux-queues 1
Please note that in order to avoid locking mechanisms, a queue per thread is created (we call it “queue set”), for each consumer application.
Once auxiliary queues have been enabled, it is possible to configure them for exporting sampled (or all) traffic (good, discarded, or all) to external applications through the API:
curl -u <user>:<password> "http://<host>:<port>/mirror/<queue set id>/type[?action=update&value={forwarded, discarded, injected, all}]"
curl -u <user>:<password> "http://<host>:<port>/mirror/<queue set id>/direction[?action=update&value={wan, lan, any}]"
curl -u <user>:<password> "http://<host>:<port>/mirror/<queue set id>/sampling[?action=update&value=<sampling rate (0 for no traffic)>]"
The type parameter configures which traffic type to mirror:
forwarded: Only forwarded/passed packets
discarded: Only dropped packets
injected: Only injected packets (e.g., SYN cookies, RST responses)
all: All traffic (default)
The direction parameter configures which traffic direction to mirror:
wan: Only packets arriving from the WAN interface
lan: Only packets arriving from the LAN interface
any: Packets from both interfaces (default)
The sampling parameter sets the sampling rate (mirror every Nth packet).
Example:
curl -u <user>:<password> "http://<host>:<port>/mirror/0/type?action=update&value=all"
curl -u <user>:<password> "http://<host>:<port>/mirror/0/direction?action=update&value=wan"
curl -u <user>:<password> "http://<host>:<port>/mirror/0/sampling?action=update&value=100"
Using the CLI tool:
nscrub-cli
localhost:8880> mirror 0 type all
localhost:8880> mirror 0 direction wan
localhost:8880> mirror 0 sampling 100
Traffic Analysis with tcpdump
It is possible for instance to use tcpdump for monitoring the traffic running one instance per processing thread, specifying the cluster ID and thread/queue ID in the interface name:
tcpdump -Q in -ni zc:99@0
tcpdump -Q in -ni zc:99@1
tcpdump -Q in -ni zc:99@2
tcpdump -Q in -ni zc:99@3
Alternatively, it is possible to aggregate all traffic to a single queue and run a single tcpdump instance:
zbalance_ipc -i zc:99@0,zc:99@1,zc:99@2,zc:99@3 -c 100 -n 1
tcpdump -Q in -ni zc:100@0
Traffic Analysis with ntopng
In the same way it is possible to analyse the traffic using ntopng:
ntopng -i zc:99@0 -i zc:99@1 -i zc:99@2 -i zc:99@3
This creates 4 interfaces in ntopng, however it is possible to aggregate all of them in a single view to be able to analyse aggregated traffic from all of them:
ntopng -i zc:99@0 -i zc:99@1 -i zc:99@2 -i zc:99@3 -i view:zc:99@0,zc:99@1,zc:99@2,zc:99@3
Events
nScrub can export events as soon as an abnormal behaviour is detected, for instance a threshold has been crossed or one of the automatic detection algorithms engate a protection mechanism. Events can be exported (logged, or sent by mail or other endpoints) by means of scripts. nScrub already includes sample scripts under /usr/share/nscrub/scripts/callbacks/events, they can be customized and enabled by making them executable (chmod +x <script>). Additional custom scripts can be created and enabled by placing them in the same folder and making them executable. A JSON string representing the event is provided to the script in the standard input. The event format is described in the table below.
Name |
Type |
Description |
|---|---|---|
uniqid |
int64 |
Unique event ID |
id |
int |
Event number since startup |
target_id |
int |
Target ID |
status |
string |
new, continuation or terminated |
type |
int |
Event type |
reason |
int |
Event reason |
epoch |
int |
Epoch |
time |
string |
Time (human readable) |
duration |
int |
Event duration |
thread |
string |
Internal thread that detected the event |
Example for enabling the “logger” script which logs events under /var/tmp/nscrub/events.log
chmod +x /usr/share/nscrub/scripts/callbacks/events/logger.sh