Discontinuation Notice
This post becomes obsolete effective with ntopng 4.1+. Full discontinuation notice available here.
This tutorial shows how to properly configure nagios and ntopng (Professional) in order to send asynchronous ntopng-generated alerts to nagios.
Prerequisites
It is assumed that the following software is already installed and properly configured:
- nagios daemon
- nagios NSCA (Nagios Service Check Acceptor) daemon
- ntopng Professional
Please see the Resources section at the bottom of this page for useful links and guides on how to set-up nagios and NSCA daemons.
Tutorial Set-Up
This tutorial uses two hosts connected to the same LAN:
- An x86_64 ubuntu 14.04 host running nagios and nagios NSCA daemons (ip address 192.168.1.10). Daemon executables are installed under /usr/local/nagios/bin, whereas configuration files are stored in /usr/local/nagios/etc.
- A Mac Os X host running ntopng (ip address 192.168.1.6)
Nagios NSCA Configuration
NSCA daemon configuration is pretty straightforward. The only thing that is recommended is to enable the debug in the nsca.cfg file. Open the file /usr/local/nagios/etc/nsca.cfg, locate the line debug=0 and change it to 1:
[...]
# DEBUGGING OPTION
# This option determines whether or not debugging
# messages are logged to the syslog facility.
# Values: 0 = debugging off, 1 = debugging on
debug=1
[...]
Then, save the file and restart the NSCA daemon. Once the debug is enabled, useful NSCA status information is sent to the syslog.
Nagios Configuration
In order to properly handle ntopng-generated alerts, nagios requires some extra configuration. Before delving into the nagios configuration, it is worth discussing the format of ntopng-generated alerts.
As already introduced, ntopng propagates alerts as NSCA messages. NSCA messages are tab-separated text lines that contain the following information:
Host <tab> Service Description <tab> Service Status <tab> Message
Now that alerts format has been discussed, it is possible to move to the actual nagios configuration.
Nagios command
The first thing to do is to add a nagios command. The command is very simple since all the alert logic resides inside ntopng. Open up the nagios command.cfg file (/usr/local/nagios/etc/objects/commands.cfg) and add the following lines at the bottom:
define command{
 command_name check_dummy
 command_line $USER1$/check_dummy $ARG1$
}
Save and close.
Nagios Service
The second thing is to define a service template for asynchronous, passive services. This service will be extended by the ntopng host defined in the following section. Open the file templates.cfg (/usr/local/nagios/etc/objects/templates.cfg) and add the follwing service definition at the bottom
define service{
 use generic-service
 name passive_service
 active_checks_enabled 0
 passive_checks_enabled 1 # We want only passive checking
 flap_detection_enabled 0
 register 0 # This is a template, not a real service
 is_volatile 0
 check_period 24x7
 max_check_attempts 1
 normal_check_interval 5
 retry_check_interval 1
 check_freshness 0
 contact_groups admins
 check_command check_dummy!0
 notification_interval 120
 notification_period 24x7
 notification_options w,u,c,r
 stalking_options w,c,u
}
The service defined above has only passive checks and uses the previously created check_dummy command.
Nagios Host
Now it is possible to add a new nagios host definition for the host running ntopng. Create the file ntopnghost.cfg under /usr/local/nagios/etc/objects/ with the following contents:
#
# HOST DEFINITION
#
define host{
 name generic-ntopng ; The name of this host template
 use generic-host ; This template inherits other values from the generic-host template
 check_period 24x7 ; By default, Linux hosts are checked round the clock
 check_command check-host-alive ; Default command to check Linux hosts
 check_interval 5 ; Actively check the host every 5 minutes
 retry_interval 1 ; Schedule host check retries at 1 minute intervals
 max_check_attempts 10 ; Check each Linux host 10 times (max)
 contact_groups admins ; Notifications get sent to the admins by default
 register 0 ; DONT REGISTER THIS DEFINITION - ITS NOT A REAL HOST, JUST A TEMPLATE!
 }

define host{
 use generic-ntopng ; Name of host template to use
 ; This host definition will inherit all variables that are defined
 ; in (or inherited by) the linux-server host template definition.
 host_name ntopng-host
 alias Ntopng Host
 address 192.168.1.6
 }

#
# HOST GROUP DEFINITION
#
# Define an optional hostgroup for Linux machines
define hostgroup{
 hostgroup_name ntopng-servers ; The name of the hostgroup
 alias Ntopng Servers ; Long name of the group
 members ntopng-host ; Comma separated list of hosts that belong to this group
 }
#
# SERVICE DEFINITION
#
define service{
 use passive_service
 service_description NtopngAlert
 host_name ntopng-host
}
In the host definition part of the configuration file above, it is created a generic-ntopng host template that may be used for one or more hosts running ntopng. The second host definition, that inherits from generic-host, is the actual ntopng host. The host_name has been set to ntopng-host, and its ip address correspond to the Mac Os X machine running ntopng. It is important to jot down the host_name as it is necessary to set it inside ntopng configuration as well. Please make sure to change the ip address to the one of the host running your ntopng instance.
In the host group definition part of the configuration file, it is defined an host group for all the ntopng servers. Currently, the ntopng-servers group has only one host, namely, ntopng-host, but one may create a larger group with more than one ntopng monitoring host.
The third part, service definition, defines a service inheriting from the passive_service created in the section above. This service has a service_description equal to NtopngAlert and is associated to the host ntopng-host. The service_description string NtopngAlert should be kept in mind as it is required to set it into ntopng as well.
In order to tell nagios to read and use the ntopnghost.cfg file, it may be necessary to add the following line to the file (/usr/local/nagios/etc/nagios.cfg):
# Definitions for monitoring the ntopng host
cfg_file=/usr/local/nagios/etc/objects/ntopnghost.cfg
Nagios restart
Nagios configuration is done. To make sure the are no syntax errors in the edited files, we can run the following check
/usr/local/nagios/bin/nagios -v /usr/local/nagios/etc/nagios.cfg
If everything is OK, nagios will output something like
Total Warnings: 0
Total Errors: 0
Things look okay - No serious problems were detected during the pre-flight check
If no errors and warnings are detected, then it is safe to restart the nagios daemon.
Ntopng Configuration
The host running ntopng must have the send_nsca utility. This utility is bundled and shipped with the sources of NSCA. Alternatively, it can be found in the repositories of the most common distributions.
The host used in this tutorial has the utility installed under /opt/local/sbin:
Simones-MacBook-Pro:nsca simone$ which send_nsca
/opt/local/sbin/send_nsca
We will drop this absolute path inside ntopng configuration page. It is also important to take note of the send_nsca configuration file absolute path. This is a very basic configuration file and doesn’t need to be edited but it is required by send_nsca to work properly. In the host used in the tutorial this file resides in /opt/local/etc/nsca/send_nsca.cfg
At this point no additional information is needed. Fire up the ntopng web interface and navigate to the Preferences page. There is a whole section dedicated to the nagios alerts.
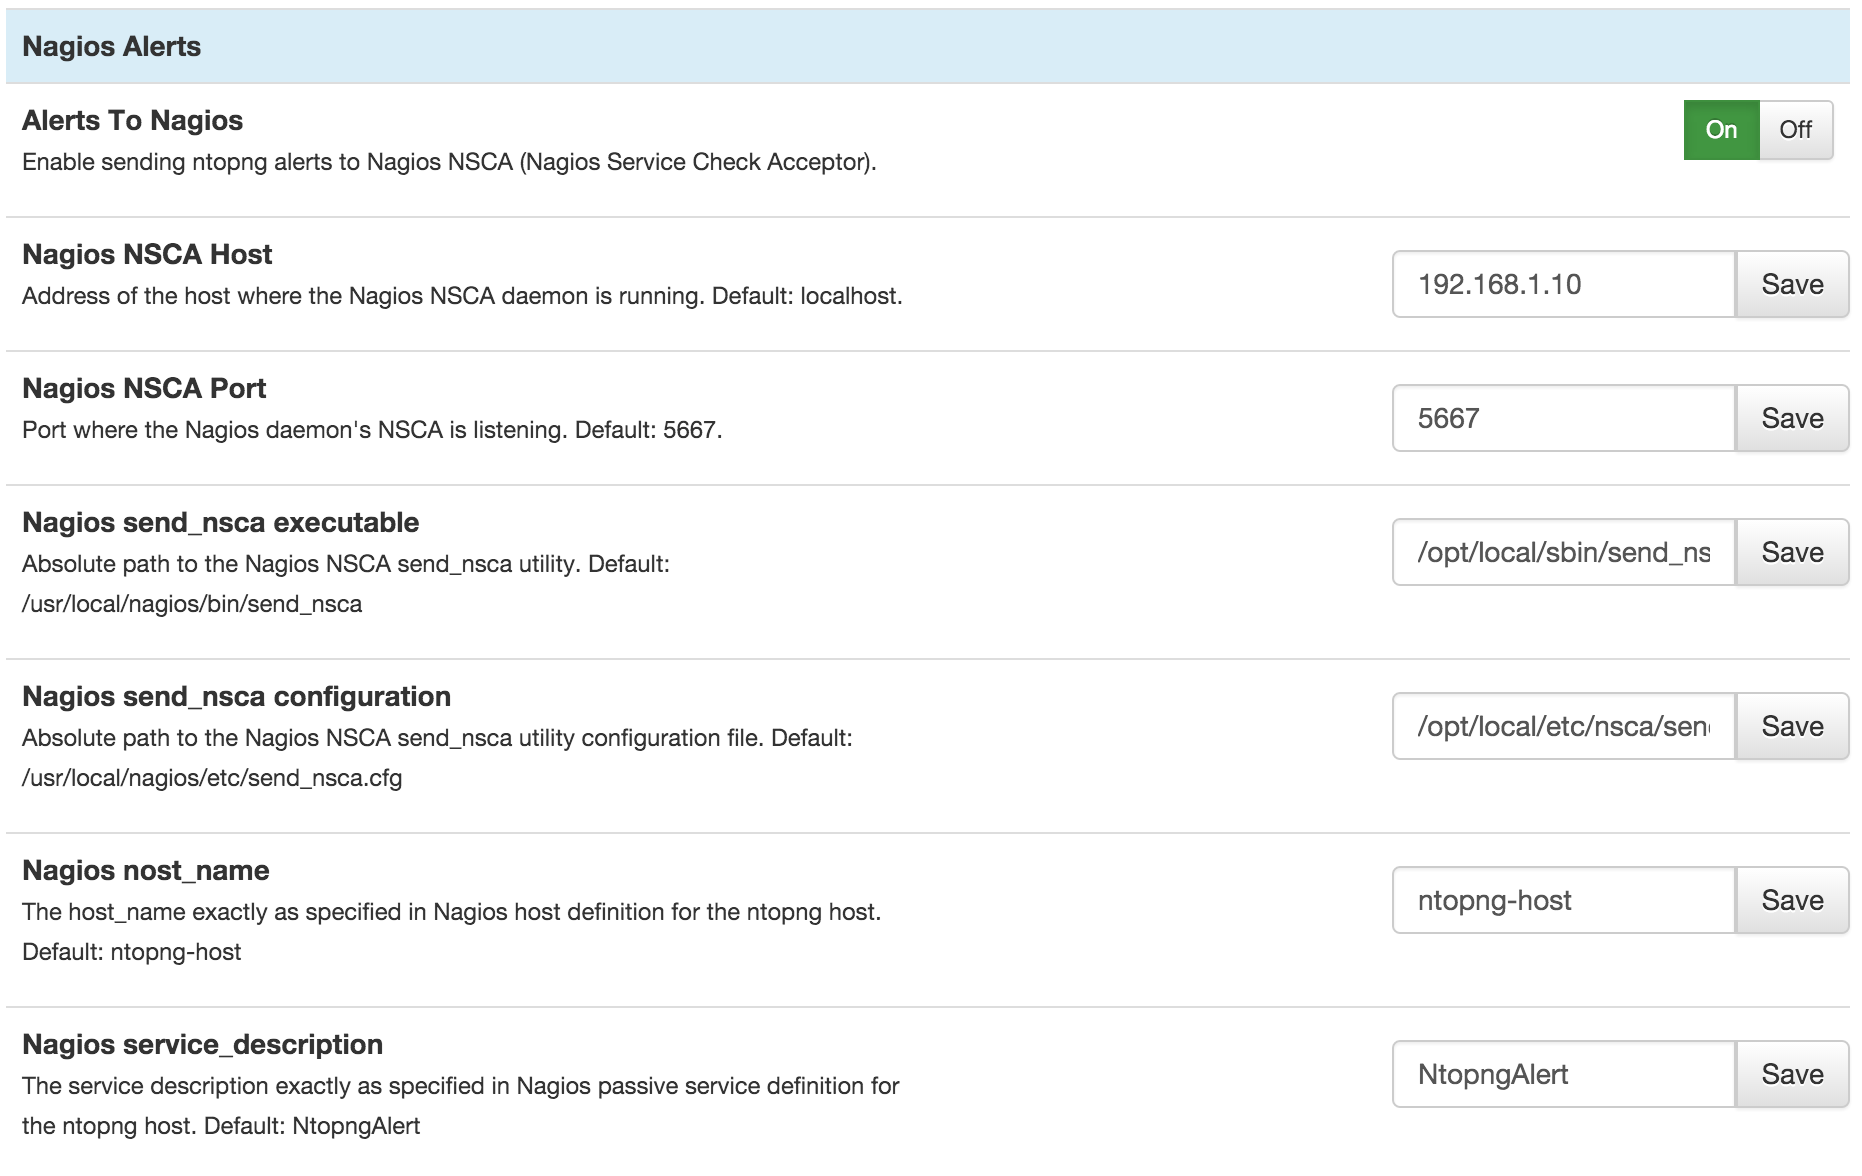
The following configuration fields are available
Alerts To Nagios: Toggles nagios alerts on or off
Nagios NSCA Host: This field must be filled with the ip address of the host running the nagios NSCA daemon. In this tutorial the host is 192.168.1.10
Nagios NSCA Port: The port on which the NSCA daemon is listening. The daemon used in this tutorial listens on the default port 5667.
Nagios send_nsca executable: The absoulte path of the send_nsca executable, which is found in /opt/local/sbin/send_nsca in the ntopng host used in the tutorial
Nagios send_nsca configuration: The absolute path of the send_nsca configuration file, which is found in /opt/local/etc/nsca/send_nsca.cfg in the ntopng host used in this tutorial
Nagios host_name: The host_name exactly as specified in the nagios host definition for the ntopng host. The host name used in this tutorial is ntopng-host, as it has already been discussed in the nagios configuration section.
Nagios service_description: The service description exactly as specified in the nagios passive service definition for the ntopng host. The service_description used in this tutorial is NtopngAlert, as it has already been discussed in the nagios configuration section above.
At this point everything should be set up properly. Go to the ntopng web interface and arm an alert for a host of for a network. You will see it appearing both inside ntopng alerts page, as well as in the nagios web interface.
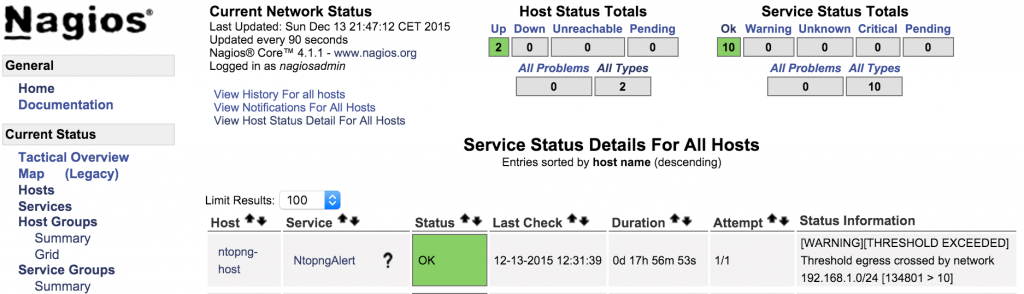
Since we have enabled NSCA debug, every time ntopng propagates an alert to nagios, the file /var/log/syslog of the nagios host should display a bunch of lines similar to the following:
Dec 13 12:01:00 simone-VirtualBox-1 nsca[17033]: Connection from 192.168.1.6 port 7410
Dec 13 12:01:00 simone-VirtualBox-1 nsca[17033]: Handling the connection...
Dec 13 12:01:00 simone-VirtualBox-1 nsca[17033]: SERVICE CHECK -> Host Name: 'ntopng-host', Service Description: 'NtopngAlert', Return
 Code: '0', Output: '[WARNING][THRESHOLD EXCEEDED] Threshold egress crossed by network 192.168.1.0/24 [134801 > 10]'
Dec 13 12:01:00 simone-VirtualBox-1 nagios: EXTERNAL COMMAND: PROCESS_SERVICE_CHECK_RESULT;ntopng-host;NtopngAlert;0;[WARNING][THRESHO
LD EXCEEDED] Threshold egress crossed by network 192.168.1.0/24 [134801 > 10]
Dec 13 12:01:00 simone-VirtualBox-1 nagios: PASSIVE SERVICE CHECK: ntopng-host;NtopngAlert;0;[WARNING][THRESHOLD EXCEEDED] Threshold e
gress crossed by network 192.168.1.0/24 [134801 > 10]
Dec 13 12:01:00 simone-VirtualBox-1 nsca[17033]: End of connection...
The syslog file is also very helpful when troubleshooting possible issues or missing alerts.
Resources
- Official guide to install nagios from sources on ubuntu.
- Tutorial to set-up the Nagios NSCA daemon.