Summary
- SNMP is widely used for network monitoring.
- Being able to remotely monitor network devices is fundamental to have a clear picture of present and past network health.
- ntopng systematically interacts with SNMP devices to provide historical and real-time insights on the network.
ntopng SNMP support
Simple Network Management Protocol (SNMP) is one of the de-facto standards used to remotely monitor network devices such as routers, switches and servers, just to name a few. With ntopng Enterprise it is possible to consistently and programmatically interact with those devices to have a real-time view of their status, as well as to build historical record for future investigations and trouble shootings.
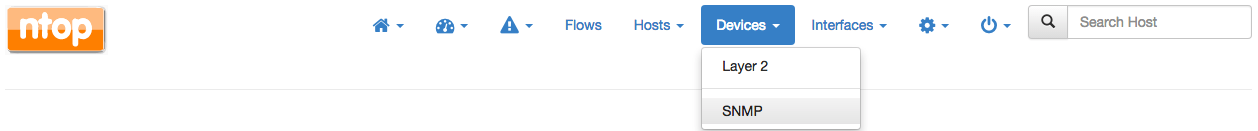
Overview of configured SNMP devices
ntopng represent an effective way to have a clear, centralized view of multiple devices. Indeed, a dedicated SNMP menu provides instantaneous access to all the configured devices, and allow the administrator to add/remove devices from the pool.
Configured devices are listed along with their address, description, location, and other information. The rightmost column gives access to device-specific actions.
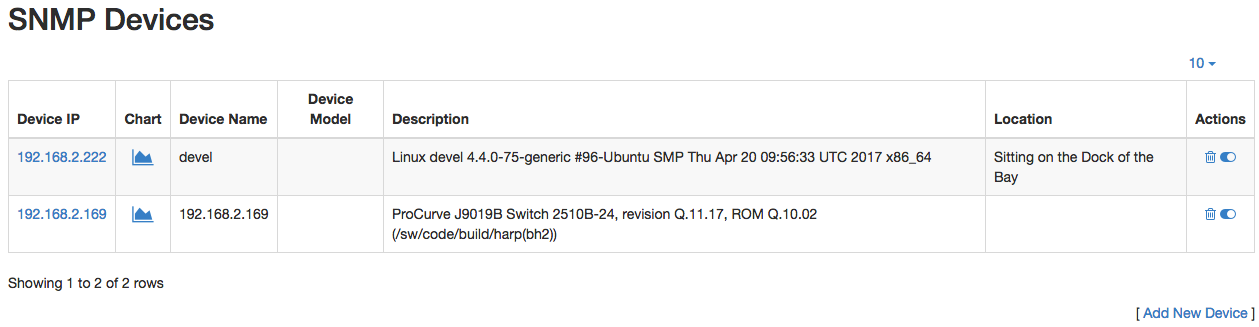
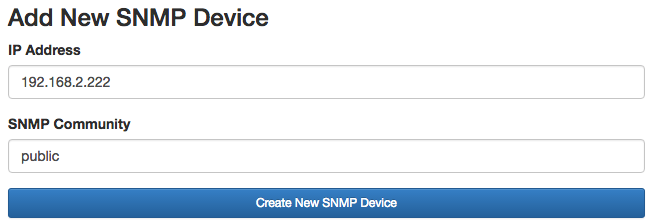
Adding a new SNMP device
An “Add New Device” link is available at the bottom of the “SNMP Devices” page. The addition of a new SNMP is straightforward as it only requires to specify device IP address and SNMP community. Upon successful addition, the device will appear in the list of devices.
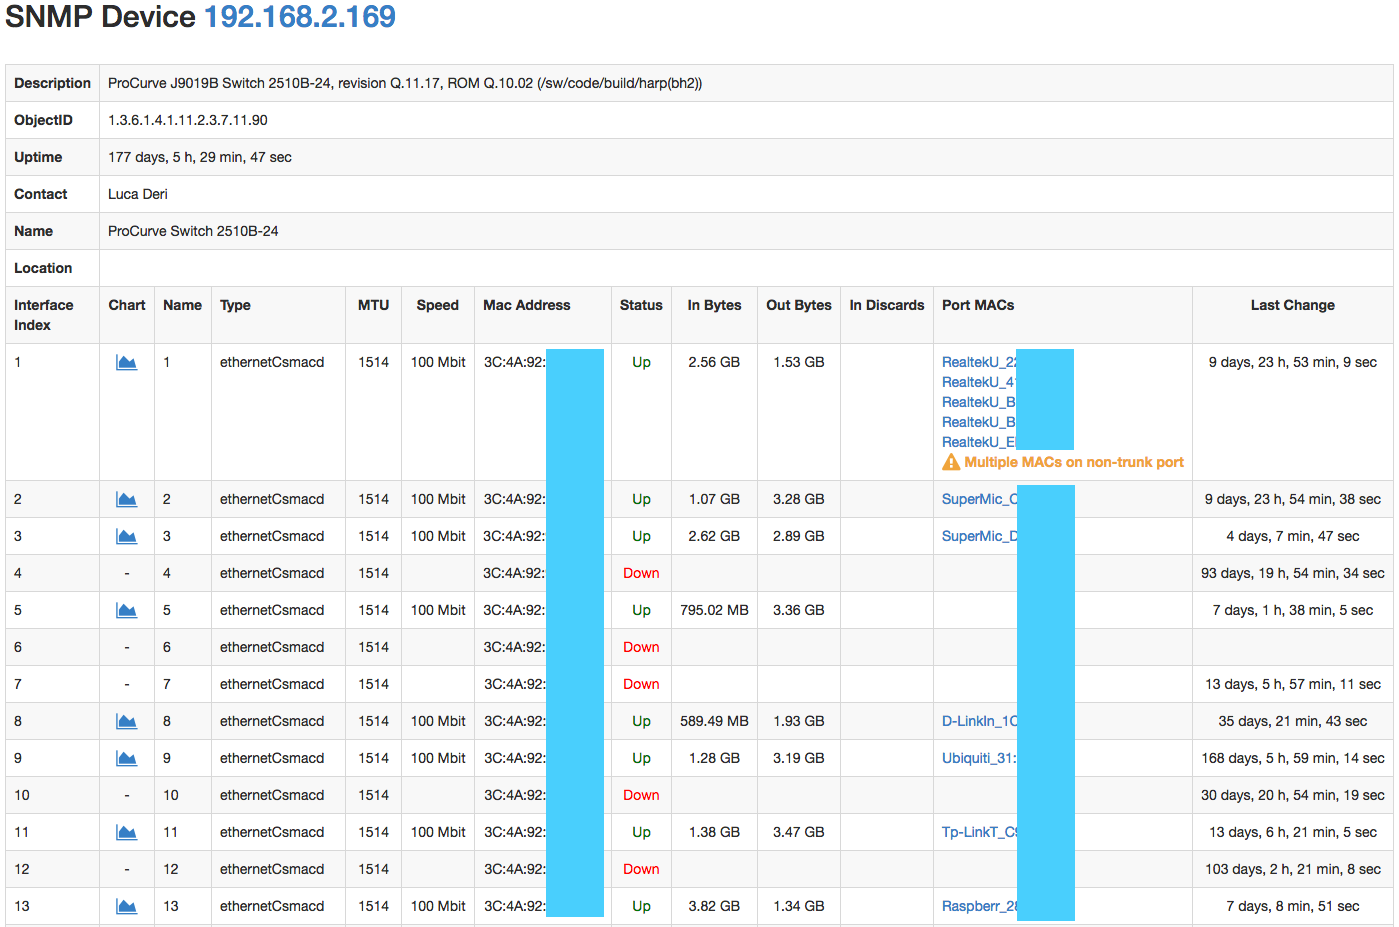
Real-time inspection of an SNMP device
A details page is available for every SNMP device configured simply by clicking on the “Device IP” hyperlink. The access to the details page triggers a series of SNMP queries aimed at retrieving the health and status of the device of interest. Retrieved information include, but is not limited to, device description, contact, and uptime, along with its interfaces, connected MAC addresses and transferred bytes. An handy warning is shown when a non-trunk port has multiple mac addresses seen, or when slow devices are attached to high-speed ports.
Historical inspection of an SNMP device
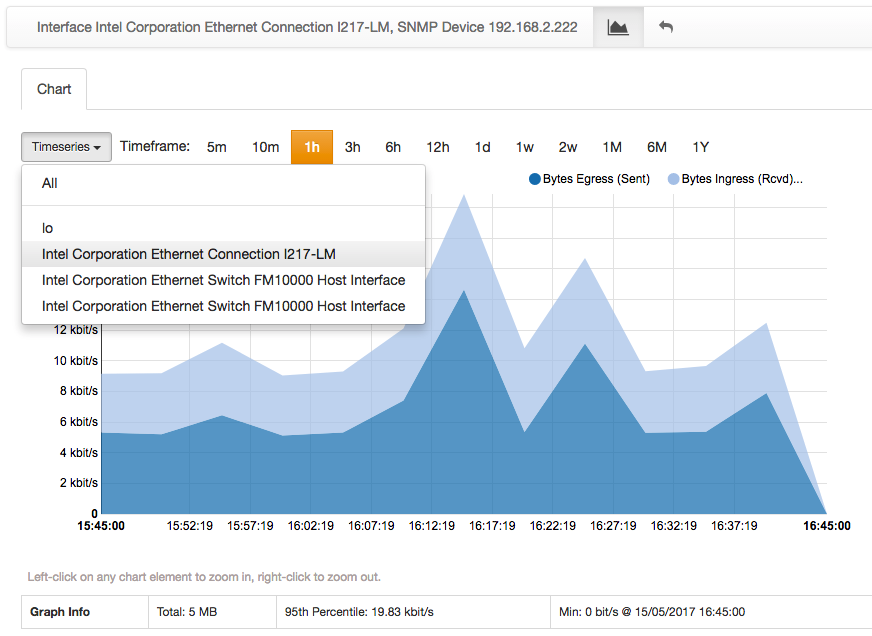
Historical SNMP data is accessible by clicking the “Chart” icon that is available for any SNMP device as well as for every of its interfaces. Chart icon may not be visible. In that case, historical SNMP timeseries have to be enabled from ntopng preferences.
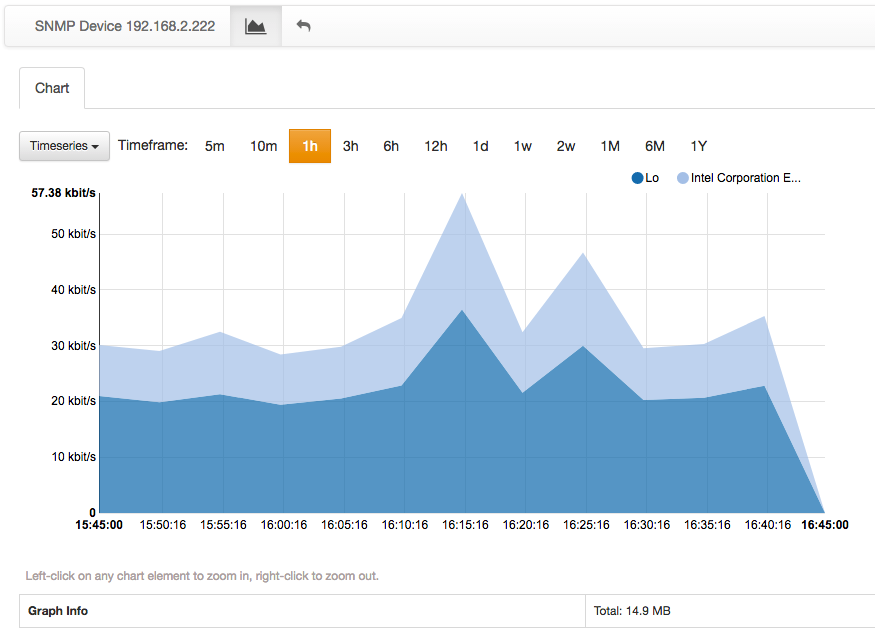
The chart above shows a stacked view of all the device interfaces. Single devices interfaces can be selected as well. In this case, a breakdown between ingress and egress traffic is visualized.
Mapping an host to SNMP devices
Another useful feature provided by ntopng is the ability to probe SNMP devices with the aim of detecting on which devices and interfaces a particular host has been seen. This lookup is automatically performed when accessing every host details page, provided that there is at least one SNMP device configured.
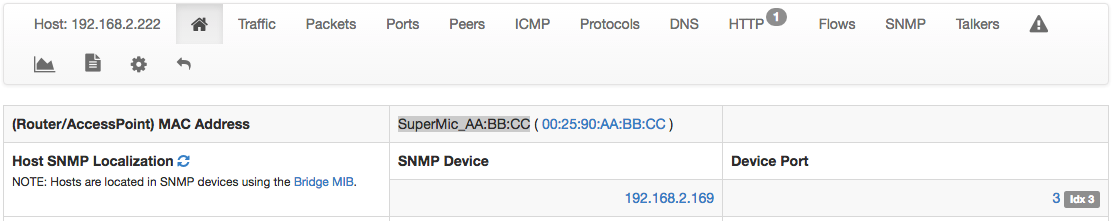
In the image above, host 192.168.2.222 has been found to be connected to interface 3 of the SNMP device 192.168.2.169.
Conclusion
This post demonstrates how ntopng can be used to systematically interact with SNMP devices to monitor their health and status. Data is visualized in real-time but also recorded for historical analyses. Currently both SNMP v1 and v2c are supported. In the near future we will add the ability to trigger alerts based on SNMP (e.g. when a port changes status), and we’ll add support for proprietary MIBs out of the box so that you can use ntopng alerts to be notified when a paper is running out of paper, or the router CPU is too heavily loaded.