Below you can find an excerpt of the “Suricata (and the grand slam of) Open Source IDPS” article written by our friend Peter Manev (Suricata core team) describing how to install and configure PF_RING, DNA and Suricata.
The original blog entries can be found at Part One – PF_RING and Part Two – DNA.
————-
Part One – PF_RING
If you have pf_ring already installed, you might want to do:
sudo rmmod pf_ring
If you are not sure if you have pf_ring installed , you can do:
sudo modinfo pf_ring
Get the latest pf_ring sources:
svn export https://svn.ntop.org/svn/ntop/trunk/PF_RING/ pfring-svn-latest
Compile and install PF_RING
Next, enter the following commands for configuration and installation:
(!!! NOT AS ROOT !!!)
cd pfring-svn-latest/kernel
make && sudo make install
cd ../userland/lib
./configure –prefix=/usr/local/pfring && make && sudo make install
cd ../libpcap-1.1.1-ring
./configure –prefix=/usr/local/pfring && make && sudo make install
cd ../tcpdump-4.1.1
./configure –prefix=/usr/local/pfring && make && sudo make install
sudo ldconfig
Then we load the module:
sudo modprobe pf_ring
Elevate as root and check if you have everything you need -enter:
modinfo pf_ring && cat /proc/net/pf_ring/info
Increase the throttle rate of the ixgbe module:
modprobe ixgbe InterruptThrottleRate=4000
The default pf_ring setup will look something like this:
root@suricata:/var/og/suricata# cat /proc/net/pf_ring/info
PF_RING Version : 5.6.2 ($Revision: exported$)
Total rings : 16
Standard (non DNA) Options
Ring slots : 4096
Slot version : 15
Capture TX : Yes [RX+TX]
IP Defragment : No
Socket Mode : Standard
Transparent mode : Yes [mode 0]
Total plugins : 0
Cluster Fragment Queue : 0
Cluster Fragment Discard : 0
Notice the ring slots above. We would actually like to increase that in order to meet the needs of a high speed network that we are going to monitor with Suricata.
So we do:
rmmod pf_ring
modprobe pf_ring transparent_mode=0 min_num_slots=65534
root@suricata:/home/pevman/pfring-svn-latest# modprobe pf_ring transparent_mode=0 min_num_slots=65534
root@suricata:/home/pevman/pfring-svn-latest# cat /proc/net/pf_ring/info
PF_RING Version : 5.6.2 ($Revision: exported$)
Total rings : 0
Standard (non DNA) Options
Ring slots : 65534
Slot version : 15
Capture TX : Yes [RX+TX]
IP Defragment : No
Socket Mode : Standard
Transparent mode : Yes [mode 0]
Total plugins : 0
Cluster Fragment Queue : 0
Cluster Fragment Discard : 0
Notice the difference above – Ring slots: 65534
Compile and install Suricata with PF_RING enabled
Get the latest Suricata dev branch:
git
clone git://phalanx.openinfosecfoundation.org/oisf.git && cd
oisf/ && git clone https://github.com/ironbee/libhtp.git -b
0.5.x
Compile and install
./autogen.sh && LIBS=-lrt ./configure –enable-pfring –enable-geoip \
–with-libpfring-includes=/usr/local/pfring/include/ \
–with-libpfring-libraries=/usr/local/pfring/lib/ \
–with-libpcap-includes=/usr/local/pfring/include/ \
–with-libpcap-libraries=/usr/local/pfring/lib/ \
–with-libnss-libraries=/usr/lib \
–with-libnss-includes=/usr/include/nss/ \
–with-libnspr-libraries=/usr/lib \
–with-libnspr-includes=/usr/include/nspr \
&& sudo make clean && sudo make && sudo make install && sudo ldconfig
The “LIBS=-lrt” infront of “./configure” above is in case you get the following error without the use of “LIBS=-lrt ” :
checking for pfring_open in -lpfring... no

   ERROR! --enable-pfring was passed but the library was not found or version is >4, go get it
   from https://www.ntop.org/PF_RING.html
PF_RING – suricata.yaml tune up and configuration
The following values and variables in the default suricata.yaml need to be changed ->
We make sure we use runmode workers (feel free to try other modes and experiment what is best for your specific set up):
#runmode: autofp
runmode: workers
Adjust the packet size:
# Preallocated size for packet. Default is 1514 which is the classical
# size for pcap on ethernet. You should adjust this value to the highest
# packet size (MTU + hardware header) on your system.
default-packet-size: 1522
Use custom profile in detect-engine with a lot more groups (high gives you about 15 groups per variable, but you can customize as needed depending on the network ranges you monitor ):
detect-engine:
– profile: custom
– custom-values:
toclient-src-groups: 200
toclient-dst-groups: 200
toclient-sp-groups: 200
toclient-dp-groups: 300
toserver-src-groups: 200
toserver-dst-groups: 400
toserver-sp-groups: 200
toserver-dp-groups: 250
– sgh-mpm-context: full
– inspection-recursion-limit: 3000
Adjust your defrag settings:
# Defrag settings:
defrag:
memcap: 512mb
hash-size: 65536
trackers: 65535 # number of defragmented flows to follow
max-frags: 65535 # number of fragments to keep
prealloc: yes
timeout: 30
Adjust your flow settings:
flow:
memcap: 1gb
hash-size: 1048576
prealloc: 1048576
emergency-recovery: 30
Adjust your per protocol timeout values:
flow-timeouts:
default:
new: 3
established: 30
closed: 0
emergency-new: 10
emergency-established: 10
emergency-closed: 0
tcp:
new: 6
established: 100
closed: 12
emergency-new: 1
emergency-established: 5
emergency-closed: 2
udp:
new: 3
established: 30
emergency-new: 3
emergency-established: 10
icmp:
new: 3
established: 30
emergency-new: 1
emergency-established: 10
Adjust your stream engine settings:
stream:
memcap: 12gb
checksum-validation: no # reject wrong csums
prealloc-sesions: 500000 #per thread
midstream: true
asyn-oneside: true
inline: no # auto will use inline mode in IPS mode, yes or no set it statically
reassembly:
memcap: 20gb
depth: 12mb # reassemble 12mb into a stream
toserver-chunk-size: 2560
toclient-chunk-size: 2560
randomize-chunk-size: yes
#randomize-chunk-range: 10
Make sure you enable suricata.log for troubleshooting if something goes wrong:
outputs:
– console:
enabled: yes
– file:
enabled: yes
filename: /var/log/suricata/suricata.log
The PF_RING section:
# PF_RING configuration. for use with native PF_RING support
# for more info see https://www.ntop.org/PF_RING.html
pfring:
– interface: eth3
# Number of receive threads (>1 will enable experimental flow pinned
# runmode)
threads: 16
# Default clusterid. PF_RING will load balance packets based on flow.
# All threads/processes that will participate need to have the same
# clusterid.
cluster-id: 99
# Default PF_RING cluster type. PF_RING can load balance per flow or per hash.
# This is only supported in versions of PF_RING > 4.1.1.
cluster-type: cluster_flow
# bpf filter for this interface
#bpf-filter: tcp
# Choose checksum verification mode for the interface. At the moment
# of the capture, some packets may be with an invalid checksum due to
# offloading to the network card of the checksum computation.
# Possible values are:
# – rxonly: only compute checksum for packets received by network card.
# – yes: checksum validation is forced
# – no: checksum validation is disabled
# – auto: suricata uses a statistical approach to detect when
# checksum off-loading is used. (default)
# Warning: ‘checksum-validation’ must be set to yes to have any validation
#checksum-checks: auto
We had these rules enabled:
rule-files:
– md5.rules # 134 000 specially selected file md5s
– dns.rules
– malware.rules
– local.rules
– current_events.rules
– mobile_malware.rules
– user_agents.rules
Make sure you adjust your Network and Port variables:
# Holds the address group vars that would be passed in a Signature.
# These would be retrieved during the Signature address parsing stage.
address-groups:
HOME_NET: “[ HOME NET HERE ]”
EXTERNAL_NET: “!$HOME_NET”
HTTP_SERVERS: “$HOME_NET”
SMTP_SERVERS: “$HOME_NET”
SQL_SERVERS: “$HOME_NET”
DNS_SERVERS: “$HOME_NET”
TELNET_SERVERS: “$HOME_NET”
AIM_SERVERS: “$EXTERNAL_NET”
DNP3_SERVER: “$HOME_NET”
DNP3_CLIENT: “$HOME_NET”
MODBUS_CLIENT: “$HOME_NET”
MODBUS_SERVER: “$HOME_NET”
ENIP_CLIENT: “$HOME_NET”
ENIP_SERVER: “$HOME_NET”
# Holds the port group vars that would be passed in a Signature.
# These would be retrieved during the Signature port parsing stage.
port-groups:
HTTP_PORTS: “80”
SHELLCODE_PORTS: “!80”
ORACLE_PORTS: 1521
SSH_PORTS: 22
DNP3_PORTS: 20000
Your app parsers:
# Holds details on the app-layer. The protocols section details each protocol.
# Under each protocol, the default value for detection-enabled and ”
# parsed-enabled is yes, unless specified otherwise.
# Each protocol covers enabling/disabling parsers for all ipprotos
# the app-layer protocol runs on. For example “dcerpc” refers to the tcp
# version of the protocol as well as the udp version of the protocol.
# The option “enabled” takes 3 values – “yes”, “no”, “detection-only”.
# “yes” enables both detection and the parser, “no” disables both, and
# “detection-only” enables detection only(parser disabled).
app-layer:
protocols:
tls:
enabled: yes
detection-ports:
tcp:
toserver: 443
#no-reassemble: yes
dcerpc:
enabled: yes
ftp:
enabled: yes
ssh:
enabled: yes
smtp:
enabled: yes
imap:
enabled: detection-only
msn:
enabled: detection-only
smb:
enabled: yes
detection-ports:
tcp:
toserver: 139
# smb2 detection is disabled internally inside the engine.
#smb2:
# enabled: yes
dnstcp:
enabled: yes
detection-ports:
tcp:
toserver: 53
dnsudp:
enabled: yes
detection-ports:
udp:
toserver: 53
http:
enabled: yes
Libhtp body limits:
libhtp:
default-config:
personality: IDS
# Can be specified in kb, mb, gb. Just a number indicates
# it’s in bytes.
request-body-limit: 12mb
response-body-limit: 12mb
# inspection limits
request-body-minimal-inspect-size: 32kb
request-body-inspect-window: 4kb
response-body-minimal-inspect-size: 32kb
response-body-inspect-window: 4kb
Run it
With all that done and in place – you can start Suricata like this (change your directory locations and such !)
LD_LIBRARY_PATH=/usr/local/pfring/lib suricata –pfring-int=eth3 \
–pfring-cluster-id=99 –pfring-cluster-type=cluster_flow \
-c /etc/suricata/peter-yaml/suricata-pfring.yaml -D -v
this would also work:
suricata –pfring-int=eth3 –pfring-cluster-id=99 –pfring-cluster-type=cluster_flow \
-c /etc/suricata/peter-yaml/suricata-pfring.yaml -D -v
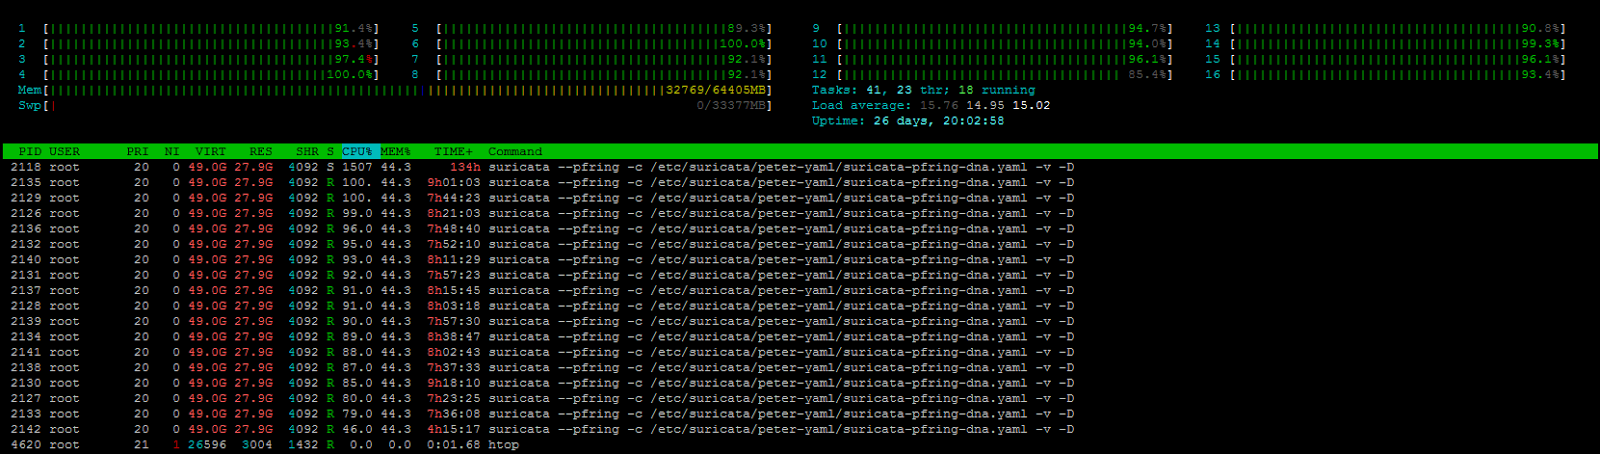
After you start Suricata with PF_RING, you could use htop and the logs info of suricata.log to determine if everything is ok
EXAMPLE:
[29966] 30/11/2013 — 14:29:12 – (util-cpu.c:170) <Info> (UtilCpuPrintSummary) — CPUs/cores online: 16
[29966] 30/11/2013 — 14:29:12 – (app-layer-dns-udp.c:315) <Info> (DNSUDPConfigure) — DNS request flood protection level: 500
[29966] 30/11/2013 — 14:29:12 – (defrag-hash.c:212) <Info> (DefragInitConfig) — allocated 3670016 bytes of memory for the defrag hash… 65536 buckets of size 56
[29966] 30/11/2013 — 14:29:12 – (defrag-hash.c:237) <Info> (DefragInitConfig) — preallocated 65535 defrag trackers of size 152
[29966] 30/11/2013 — 14:29:12 – (defrag-hash.c:244) <Info> (DefragInitConfig) — defrag memory usage: 13631336 bytes, maximum: 536870912
[29966] 30/11/2013 — 14:29:12 – (tmqh-flow.c:76) <Info> (TmqhFlowRegister) — AutoFP mode using default “Active Packets” flow load balancer
[29967] 30/11/2013 — 14:29:12 – (tmqh-packetpool.c:141) <Info> (PacketPoolInit) — preallocated 65534 packets. Total memory 229106864
[29967] 30/11/2013 — 14:29:12 – (host.c:205) <Info> (HostInitConfig) — allocated 262144 bytes of memory for the host hash… 4096 buckets of size 64
[29967] 30/11/2013 — 14:29:12 – (host.c:228) <Info> (HostInitConfig) — preallocated 1000 hosts of size 112
[29967] 30/11/2013 — 14:29:12 – (host.c:230) <Info> (HostInitConfig) — host memory usage: 390144 bytes, maximum: 16777216
[29967] 30/11/2013 — 14:29:12 – (flow.c:386) <Info> (FlowInitConfig) — allocated 67108864 bytes of memory for the flow hash… 1048576 buckets of size 64
[29967] 30/11/2013 — 14:29:13 – (flow.c:410) <Info> (FlowInitConfig) — preallocated 1048576 flows of size 280
[29967] 30/11/2013 — 14:29:13 – (flow.c:412) <Info> (FlowInitConfig) — flow memory usage: 369098752 bytes, maximum: 1073741824
…..
[29967] 30/11/2013 — 14:30:23 – (util-runmodes.c:545) <Info> (RunModeSetLiveCaptureWorkersForDevice) — Going to use 16 thread(s)
[30000] 30/11/2013 — 14:30:23 – (source-pfring.c:445) <Info> (ReceivePfringThreadInit) — (RxPFReth31) Using PF_RING v.5.6.2, interface eth3, cluster-id 99
[30001] 30/11/2013 — 14:30:23 – (source-pfring.c:445) <Info> (ReceivePfringThreadInit) — (RxPFReth32) Using PF_RING v.5.6.2, interface eth3, cluster-id 99
[30002] 30/11/2013 — 14:30:23 – (source-pfring.c:445) <Info> (ReceivePfringThreadInit) — (RxPFReth33) Using PF_RING v.5.6.2, interface eth3, cluster-id 99
[30003] 30/11/2013 — 14:30:23 – (source-pfring.c:445) <Info> (ReceivePfringThreadInit) — (RxPFReth34) Using PF_RING v.5.6.2, interface eth3, cluster-id 99
[30004] 30/11/2013 — 14:30:24 – (source-pfring.c:445) <Info> (ReceivePfringThreadInit) — (RxPFReth35) Using PF_RING v.5.6.2, interface eth3, cluster-id 99
[30005] 30/11/2013 — 14:30:24 – (source-pfring.c:445) <Info> (ReceivePfringThreadInit) — (RxPFReth36) Using PF_RING v.5.6.2, interface eth3, cluster-id 99
[30006] 30/11/2013 — 14:30:24 – (source-pfring.c:445) <Info> (ReceivePfringThreadInit) — (RxPFReth37) Using PF_RING v.5.6.2, interface eth3, cluster-id 99
[30007] 30/11/2013 — 14:30:24 – (source-pfring.c:445) <Info> (ReceivePfringThreadInit) — (RxPFReth38) Using PF_RING v.5.6.2, interface eth3, cluster-id 99
[30008] 30/11/2013 — 14:30:24 – (source-pfring.c:445) <Info> (ReceivePfringThreadInit) — (RxPFReth39) Using PF_RING v.5.6.2, interface eth3, cluster-id 99
[30009] 30/11/2013 — 14:30:24 – (source-pfring.c:445) <Info> (ReceivePfringThreadInit) — (RxPFReth310) Using PF_RING v.5.6.2, interface eth3, cluster-id 99
[30010] 30/11/2013 — 14:30:24 – (source-pfring.c:445) <Info> (ReceivePfringThreadInit) — (RxPFReth311) Using PF_RING v.5.6.2, interface eth3, cluster-id 99
[30011] 30/11/2013 — 14:30:24 – (source-pfring.c:445) <Info> (ReceivePfringThreadInit) — (RxPFReth312) Using PF_RING v.5.6.2, interface eth3, cluster-id 99
[30012] 30/11/2013 — 14:30:24 – (source-pfring.c:445) <Info> (ReceivePfringThreadInit) — (RxPFReth313) Using PF_RING v.5.6.2, interface eth3, cluster-id 99
[30013] 30/11/2013 — 14:30:24 – (source-pfring.c:445) <Info> (ReceivePfringThreadInit) — (RxPFReth314) Using PF_RING v.5.6.2, interface eth3, cluster-id 99
[30014] 30/11/2013 — 14:30:25 – (source-pfring.c:445) <Info> (ReceivePfringThreadInit) — (RxPFReth315) Using PF_RING v.5.6.2, interface eth3, cluster-id 99
[30015] 30/11/2013 — 14:30:25 – (source-pfring.c:445) <Info> (ReceivePfringThreadInit) — (RxPFReth316) Using PF_RING v.5.6.2, interface eth3, cluster-id 99
[29967] 30/11/2013 — 14:30:25 – (runmode-pfring.c:555) <Info> (RunModeIdsPfringWorkers) — RunModeIdsPfringWorkers initialised
…..
[29967] 30/11/2013 — 14:30:25 – (tm-threads.c:2191) <Notice> (TmThreadWaitOnThreadInit) — all 16 packet processing threads, 3 management threads initialized, engine started.
So after running for about 7 hrs:
root@suricata:/var/log/suricata# grep kernel stats.log |tail -32
capture.kernel_packets | RxPFReth31 | 2313986783
capture.kernel_drops | RxPFReth31 | 75254447
capture.kernel_packets | RxPFReth32 | 2420204427
capture.kernel_drops | RxPFReth32 | 23492323
capture.kernel_packets | RxPFReth33 | 2412343682
capture.kernel_drops | RxPFReth33 | 71202459
capture.kernel_packets | RxPFReth34 | 2249712177
capture.kernel_drops | RxPFReth34 | 15290216
capture.kernel_packets | RxPFReth35 | 2272653367
capture.kernel_drops | RxPFReth35 | 2072826
capture.kernel_packets | RxPFReth36 | 2281254066
capture.kernel_drops | RxPFReth36 | 118723669
capture.kernel_packets | RxPFReth37 | 2430047882
capture.kernel_drops | RxPFReth37 | 13702511
capture.kernel_packets | RxPFReth38 | 2474713911
capture.kernel_drops | RxPFReth38 | 6512062
capture.kernel_packets | RxPFReth39 | 2299221265
capture.kernel_drops | RxPFReth39 | 596690
capture.kernel_packets | RxPFReth310 | 2398183554
capture.kernel_drops | RxPFReth310 | 15623971
capture.kernel_packets | RxPFReth311 | 2277348230
capture.kernel_drops | RxPFReth311 | 62773742
capture.kernel_packets | RxPFReth312 | 2693710052
capture.kernel_drops | RxPFReth312 | 40213266
capture.kernel_packets | RxPFReth313 | 2470037871
capture.kernel_drops | RxPFReth313 | 406738
capture.kernel_packets | RxPFReth314 | 2236636480
capture.kernel_drops | RxPFReth314 | 714360
capture.kernel_packets | RxPFReth315 | 2314829059
capture.kernel_drops | RxPFReth315 | 1818726
capture.kernel_packets | RxPFReth316 | 2271917603
capture.kernel_drops | RxPFReth316 | 1200009
about 2% drops, 85% CPU usage , about 3300 rules and inspecting traffic for match on 134 000 file MD5s.
On a side note
You could also use linux-tools to do some more analyzing and performance tuning:
apt-get install linux-tools
Example: perf top
(hit enter)
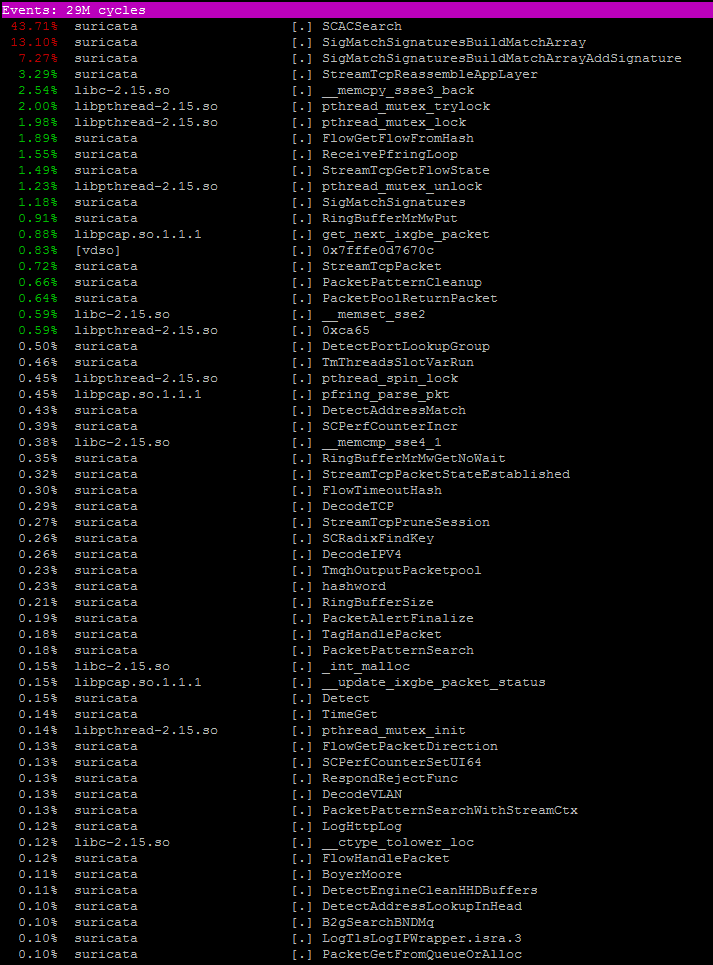
Some more info found HERE and thanks to Regit HERE.
Your task of tuning up is not yet done. You could also do a dry test runs with profiling enabled in Suricata and determine the most “expensive rules” and tune them accordingly.
Part Two – DNA
If you do not have PF_RING installed on your system you should follow all of the Part One except the section “Run it”. After that come back and continue from here onwards.
NOTE: Know your network card. This set up uses Intel 82599EB 10-Gigabit SFI/SFP+
NOTE: When one application is using the DNA interface no other application can use that same interface. Example if you have Suricata running with this guide, if you want to do “./pfcount” you would not be able to , since the DNA interface is already used by an application. For cases where you would like multiple applications to use the same DNA interface, you should consider Libzero.
Compile
Once you have acquired your DNA license (instructions of “how to” are included in the license), cd to the src of your latest pfring pull:
cd /home/pevman/pfring-svn-latest/drivers/DNA/ixgbe-3.18.7-DNA/src
make
Configure
Elevate as root. EDIT the script load_dna_driver.sh found in the directory below
(/pfring-svn-latest/drivers/DNA/ixgbe-3.18.7-DNA/src/load_dna_driver.sh)
Make changes in the script load_dna_driver.sh like so (we use only one dna interface):
# Configure here the network interfaces to activate
IF[0]=dna0
#IF[1]=dna1
#IF[2]=dna2
#IF[3]=dna3
Leave rmmod like so (default):
# Remove old modules (if loaded)
rmmod ixgbe
rmmod pf_ring
Leave only two insmod lines uncommented
# We assume that you have compiled PF_RING
insmod ../../../../kernel/pf_ring.ko
Adjust the queues, use your own MAC address, increase the buffers, up the laser on the SFP:
# As many queues as the number of processors
#insmod ./ixgbe.ko RSS=0,0,0,0
insmod ./ixgbe.ko RSS=0 mtu=1522 adapters_to_enable=00:e0:ed:19:e3:e1 num_rx_slots=32768 FdirPballoc=3
Above we have 16 CPUs and we want to use 16 queues, enable only this adapter with this MAC address, bump up the rx slots and comment all the other insmod lines (besides these two shown above for pf_ring.ko and ixgbe.ko)
In the case above we enable 16 queues (cause we have 16 cpus) for the first port of the 10Gbps Intel network card.
( the bonus round !! – with the help of Alfredo Cardigliano from ntop )
Question:
So what should you do if you have this scenario – 32 core system with a
of traffic, respectivelly.
You would like to get 4,8 16,4 queues – dedicated cpus (as written ) per
port. In other words:
Gbps of traffic (port 0,1,2,3) – > 1,2,6,1
Number of cpus/queues dedicated – > 4,8,16,4
Answer:
Simple -> You should use
insmod ./ixgbe.ko RSS=4,8,16,4 ….
instead of :
insmod ./ixgbe.ko RSS=0 ….
Execute load_dna_driver.sh from the same directory it resides in.
(ex for this tutorial – /home/pevman/pfring-svn-latest/drivers/DNA/ixgbe-3.18.7-DNA/src) :
./ load_dna_driver.sh
Make sure offloading is disabled (substitute the correct interface name below name):
ethtool -K dna0 tso off
ethtool -K dna0 gro off
ethtool -K dna0 lro off
ethtool -K dna0 gso off
ethtool -K dna0 rx off
ethtool -K dna0 tx off
ethtool -K dna0 sg off
ethtool -K dna0 rxvlan off
ethtool -K dna0 txvlan off
ethtool -N dna0 rx-flow-hash udp4 sdfn
ethtool -N dna0 rx-flow-hash udp6 sdfn
ethtool -n dna0 rx-flow-hash udp6
ethtool -n dna0 rx-flow-hash udp4
ethtool -C dna0 rx-usecs 1000
ethtool -C dna0 adaptive-rx off
Configuration in suricata.yaml
In suricata.yaml, make sure your pfring section looks like this:
# PF_RING configuration. for use with native PF_RING support
# for more info see https://www.ntop.org/PF_RING.html #dna0@0
pfring:
– interface: dna0@0
# Number of receive threads (>1 will enable experimental flow pinned
# runmode)
#threads: 1
# Default clusterid. PF_RING will load balance packets based on flow.
# All threads/processes that will participate need to have the same
# clusterid.
#cluster-id: 1
# Default PF_RING cluster type. PF_RING can load balance per flow or per hash.
# This is only supported in versions of PF_RING > 4.1.1.
cluster-type: cluster_flow
# bpf filter for this interface
#bpf-filter: tcp
# Choose checksum verification mode for the interface. At the moment
# of the capture, some packets may be with an invalid checksum due to
# offloading to the network card of the checksum computation.
# Possible values are:
# – rxonly: only compute checksum for packets received by network card.
# – yes: checksum validation is forced
# – no: checksum validation is disabled
# – auto: suricata uses a statistical approach to detect when
# checksum off-loading is used. (default)
# Warning: ‘checksum-validation’ must be set to yes to have any validation
#checksum-checks: auto
# Second interface
– interface: dna0@1
threads: 1
– interface: dna0@2
threads: 1
– interface: dna0@3
threads: 1
– interface: dna0@4
threads: 1
– interface: dna0@5
threads: 1
– interface: dna0@6
threads: 1
– interface: dna0@7
threads: 1
– interface: dna0@8
threads: 1
– interface: dna0@9
threads: 1
– interface: dna0@10
threads: 1
– interface: dna0@11
threads: 1
– interface: dna0@12
threads: 1
– interface: dna0@13
threads: 1
– interface: dna0@14
threads: 1
– interface: dna0@15
threads: 1
# Put default values here
#- interface: default
#threads: 2
Rules enabled in suricata.yaml:
default-rule-path: /etc/suricata/et-config/
rule-files:
– trojan.rules
– dns.rules
– malware.rules
– local.rules
– jonkman.rules
– worm.rules
– current_events.rules
– mobile_malware.rules
– user_agents.rules
The rest of the suricata.yaml configuration guide you can take from Part One – PF_RING– regarding Suricata’s specific settings – timeouts, memory settings, fragmentation , reassembly limits and so on.
Notice the DNA driver loaded:
lshw -c Network
*-network:1
description: Ethernet interface
product: 82599EB 10-Gigabit SFI/SFP+ Network Connection
vendor: Intel Corporation
physical id: 0.1
bus info: pci@0000:04:00.1
logical name: dna0
version: 01
serial: 00:e0:ed:19:e3:e1
width: 64 bits
clock: 33MHz
capabilities: pm msi msix pciexpress vpd bus_master cap_list ethernet physical fibre
configuration: autonegotiation=off broadcast=yes driver=ixgbe driverversion=3.18.7-DNA duplex=full firmware=0x800000cb latency=0 link=yes multicast=yes port=fibre promiscuous=yes
resources: irq:37 memory:fbc00000-fbc1ffff ioport:e000(size=32) memory:fbc40000-fbc43fff memory:fa700000-fa7fffff memory:fa600000-fa6fffff
Start Suricata with DNA
(make sure you adjust your directories in the command below)
suricata –pfring -c /etc/suricata/peter-yaml/suricata-pfring-dna.yaml -v -D
Some stats from suricata.log:
root@suricata:/home/pevman/pfring-svn-latest/userland/examples# more /var/log/suricata/suricata.log
[32055] 27/11/2013 — 13:31:38 – (suricata.c:932) <Notice> (SCPrintVersion) — This is Suricata version 2.0dev (rev 77b09fc)
[32055] 27/11/2013 — 13:31:38 – (util-cpu.c:170) <Info> (UtilCpuPrintSummary) — CPUs/cores online: 16
[32055] 27/11/2013 — 13:31:38 – (app-layer-dns-udp.c:315) <Info> (DNSUDPConfigure) — DNS request flood protection level: 500
[32055] 27/11/2013 — 13:31:38 – (defrag-hash.c:209) <Info> (DefragInitConfig) — allocated 3670016 bytes of memory for the defrag hash… 65536 buckets of size 56
[32055] 27/11/2013 — 13:31:38 – (defrag-hash.c:234) <Info> (DefragInitConfig) — preallocated 65535 defrag trackers of size 152
[32055] 27/11/2013 — 13:31:38 – (defrag-hash.c:241) <Info> (DefragInitConfig) — defrag memory usage: 13631336 bytes, maximum: 536870912
[32055] 27/11/2013 — 13:31:38 – (tmqh-flow.c:76) <Info> (TmqhFlowRegister) — AutoFP mode using default “Active Packets” flow load balancer
[32056] 27/11/2013 — 13:31:38 – (tmqh-packetpool.c:141) <Info> (PacketPoolInit) — preallocated 65534 packets. Total memory 288873872
[32056] 27/11/2013 — 13:31:38 – (host.c:205) <Info> (HostInitConfig) — allocated 262144 bytes of memory for the host hash… 4096 buckets of size 64
[32056] 27/11/2013 — 13:31:38 – (host.c:228) <Info> (HostInitConfig) — preallocated 1000 hosts of size 112
[32056] 27/11/2013 — 13:31:38 – (host.c:230) <Info> (HostInitConfig) — host memory usage: 390144 bytes, maximum: 16777216
[32056] 27/11/2013 — 13:31:38 – (flow.c:386) <Info> (FlowInitConfig) — allocated 67108864 bytes of memory for the flow hash… 1048576 buckets of size 64
[32056] 27/11/2013 — 13:31:38 – (flow.c:410) <Info> (FlowInitConfig) — preallocated 1048576 flows of size 376
[32056] 27/11/2013 — 13:31:38 – (flow.c:412) <Info> (FlowInitConfig) — flow memory usage: 469762048 bytes, maximum: 1073741824
[32056] 27/11/2013 — 13:31:38 – (reputation.c:459) <Info> (SRepInit) — IP reputation disabled
[32056] 27/11/2013 — 13:31:38 – (util-magic.c:62) <Info> (MagicInit) — using magic-file /usr/share/file/magic
[32056] 27/11/2013 — 13:31:38 – (suricata.c:1725) <Info> (SetupDelayedDetect) — Delayed detect disabled
…..rules loaded – 8010 :
[32056] 27/11/2013 — 13:31:40 – (detect.c:453) <Info> (SigLoadSignatures) — 9 rule files processed. 8010 rules successfully loaded, 0 rules failed
[32056] 27/11/2013 — 13:31:40 – (detect.c:2589) <Info> (SigAddressPrepareStage1) — 8017 signatures processed. 1 are IP-only rules, 2147 are inspecting packet payload, 6625 inspect application lay
er, 0 are decoder event only
[32056] 27/11/2013 — 13:31:40 – (detect.c:2592) <Info> (SigAddressPrepareStage1) — building signature grouping structure, stage 1: adding signatures to signature source addresses… complete
[32056] 27/11/2013 — 13:31:40 – (detect.c:3218) <Info> (SigAddressPrepareStage2) — building signature grouping structure, stage 2: building source address list… complete
[32056] 27/11/2013 — 13:35:28 – (detect.c:3860) <Info> (SigAddressPrepareStage3) — building signature grouping structure, stage 3: building destination address lists… complete
[32056] 27/11/2013 — 13:35:28 – (util-threshold-config.c:1186) <Info> (SCThresholdConfParseFile) — Threshold config parsed: 0 rule(s) found
[32056] 27/11/2013 — 13:35:28 – (util-coredump-config.c:122) <Info> (CoredumpLoadConfig) — Core dump size set to unlimited.
[32056] 27/11/2013 — 13:35:28 – (util-logopenfile.c:168) <Info> (SCConfLogOpenGeneric) — fast output device (regular) initialized: fast.log
[32056] 27/11/2013 — 13:35:28 – (util-logopenfile.c:168) <Info> (SCConfLogOpenGeneric) — http-log output device (regular) initialized: http.log
[32056] 27/11/2013 — 13:35:28 – (util-logopenfile.c:168) <Info> (SCConfLogOpenGeneric) — tls-log output device (regular) initialized: tls.log
[32056] 27/11/2013 — 13:35:28 – (util-device.c:147) <Info> (LiveBuildDeviceList) — Adding interface dna0@0 from config file
[32056] 27/11/2013 — 13:35:28 – (util-device.c:147) <Info> (LiveBuildDeviceList) — Adding interface dna0@1 from config file
[32056] 27/11/2013 — 13:35:28 – (util-device.c:147) <Info> (LiveBuildDeviceList) — Adding interface dna0@2 from config file
[32056] 27/11/2013 — 13:35:28 – (util-device.c:147) <Info> (LiveBuildDeviceList) — Adding interface dna0@3 from config file
[32056] 27/11/2013 — 13:35:28 – (util-device.c:147) <Info> (LiveBuildDeviceList) — Adding interface dna0@4 from config file
[32056] 27/11/2013 — 13:35:28 – (util-device.c:147) <Info> (LiveBuildDeviceList) — Adding interface dna0@5 from config file
[32056] 27/11/2013 — 13:35:28 – (util-device.c:147) <Info> (LiveBuildDeviceList) — Adding interface dna0@6 from config file
[32056] 27/11/2013 — 13:35:28 – (util-device.c:147) <Info> (LiveBuildDeviceList) — Adding interface dna0@7 from config file
[32056] 27/11/2013 — 13:35:28 – (util-device.c:147) <Info> (LiveBuildDeviceList) — Adding interface dna0@8 from config file
[32056] 27/11/2013 — 13:35:28 – (util-device.c:147) <Info> (LiveBuildDeviceList) — Adding interface dna0@9 from config file
[32056] 27/11/2013 — 13:35:28 – (util-device.c:147) <Info> (LiveBuildDeviceList) — Adding interface dna0@10 from config file
[32056] 27/11/2013 — 13:35:28 – (util-device.c:147) <Info> (LiveBuildDeviceList) — Adding interface dna0@11 from config file
[32056] 27/11/2013 — 13:35:28 – (util-device.c:147) <Info> (LiveBuildDeviceList) — Adding interface dna0@12 from config file
[32056] 27/11/2013 — 13:35:28 – (util-device.c:147) <Info> (LiveBuildDeviceList) — Adding interface dna0@13 from config file
[32056] 27/11/2013 — 13:35:28 – (util-device.c:147) <Info> (LiveBuildDeviceList) — Adding interface dna0@14 from config file
[32056] 27/11/2013 — 13:35:28 – (util-device.c:147) <Info> (LiveBuildDeviceList) — Adding interface dna0@15 from config file
……..
……
[32056] 27/11/2013 — 13:35:28 – (runmode-pfring.c:555) <Info> (RunModeIdsPfringWorkers) — RunModeIdsPfringWorkers initialised
[32056] 27/11/2013 — 13:35:28 – (stream-tcp.c:374) <Info> (StreamTcpInitConfig) — stream “prealloc-sessions”: 2048 (per thread)
[32056] 27/11/2013 — 13:35:28 – (stream-tcp.c:390) <Info> (StreamTcpInitConfig) — stream “memcap”: 17179869184
[32056] 27/11/2013 — 13:35:28 – (stream-tcp.c:396) <Info> (StreamTcpInitConfig) — stream “midstream” session pickups: enabled
[32056] 27/11/2013 — 13:35:28 – (stream-tcp.c:402) <Info> (StreamTcpInitConfig) — stream “async-oneside”: disabled
[32056] 27/11/2013 — 13:35:28 – (stream-tcp.c:419) <Info> (StreamTcpInitConfig) — stream “checksum-validation”: disabled
[32056] 27/11/2013 — 13:35:28 – (stream-tcp.c:441) <Info> (StreamTcpInitConfig) — stream.”inline”: disabled
[32056] 27/11/2013 — 13:35:28 – (stream-tcp.c:454) <Info> (StreamTcpInitConfig) — stream “max-synack-queued”: 5
[32056] 27/11/2013 — 13:35:28 – (stream-tcp.c:472) <Info> (StreamTcpInitConfig) — stream.reassembly “memcap”: 25769803776
[32056] 27/11/2013 — 13:35:28 – (stream-tcp.c:490) <Info> (StreamTcpInitConfig) — stream.reassembly “depth”: 12582912
[32056] 27/11/2013 — 13:35:28 – (stream-tcp.c:573) <Info> (StreamTcpInitConfig) — stream.reassembly “toserver-chunk-size”: 2509
[32056] 27/11/2013 — 13:35:28 – (stream-tcp.c:575) <Info> (StreamTcpInitConfig) — stream.reassembly “toclient-chunk-size”: 2459
[32056] 27/11/2013 — 13:35:28 – (tm-threads.c:2191) <Notice> (TmThreadWaitOnThreadInit) — all 16 packet processing threads, 3 management threads initialized, engine started.
Results: after 45 min running (and counting) on 10Gbps 8010 rules (impressive) ->
root@suricata:/var/log/suricata# grep kernel /var/log/suricata/stats.log | tail -32
capture.kernel_packets | RxPFRdna0@01 | 467567844
capture.kernel_drops | RxPFRdna0@01 | 0
capture.kernel_packets | RxPFRdna0@11 | 440973548
capture.kernel_drops | RxPFRdna0@11 | 0
capture.kernel_packets | RxPFRdna0@21 | 435088258
capture.kernel_drops | RxPFRdna0@21 | 0
capture.kernel_packets | RxPFRdna0@31 | 453131090
capture.kernel_drops | RxPFRdna0@31 | 0
capture.kernel_packets | RxPFRdna0@41 | 469334903
capture.kernel_drops | RxPFRdna0@41 | 0
capture.kernel_packets | RxPFRdna0@51 | 430412652
capture.kernel_drops | RxPFRdna0@51 | 0
capture.kernel_packets | RxPFRdna0@61 | 438056484
capture.kernel_drops | RxPFRdna0@61 | 0
capture.kernel_packets | RxPFRdna0@71 | 428234219
capture.kernel_drops | RxPFRdna0@71 | 0
capture.kernel_packets | RxPFRdna0@81 | 452883734
capture.kernel_drops | RxPFRdna0@81 | 0
capture.kernel_packets | RxPFRdna0@91 | 469565553
capture.kernel_drops | RxPFRdna0@91 | 0
capture.kernel_packets | RxPFRdna0@101 | 442010263
capture.kernel_drops | RxPFRdna0@101 | 0
capture.kernel_packets | RxPFRdna0@111 | 451989862
capture.kernel_drops | RxPFRdna0@111 | 0
capture.kernel_packets | RxPFRdna0@121 | 452650397
capture.kernel_drops | RxPFRdna0@121 | 0
capture.kernel_packets | RxPFRdna0@131 | 464907229
capture.kernel_drops | RxPFRdna0@131 | 0
capture.kernel_packets | RxPFRdna0@141 | 443403243
capture.kernel_drops | RxPFRdna0@141 | 0
capture.kernel_packets | RxPFRdna0@151 | 432499371
capture.kernel_drops | RxPFRdna0@151 | 0
Some htop stats
In the examples directory of your PF_RING sources – /pfring-svn-latest/userland/examples you have some tools you can use to look at packets stats and such – example:
root@suricata:/home/pevman/pfring-svn-latest/userland/examples# ./pfcount_multichannel -i dna0
Capturing from dna0
Found 16 channels
Using PF_RING v.5.6.2
=========================
Absolute Stats: [channel=0][280911 pkts rcvd][0 pkts dropped]
Total Pkts=280911/Dropped=0.0 %
280911 pkts – 238246030 bytes [140327.9 pkt/sec – 952.12 Mbit/sec]
=========================
Actual Stats: [channel=0][99895 pkts][1001.8 ms][99715.9 pkt/sec]
=========================
Absolute Stats: [channel=1][271128 pkts rcvd][0 pkts dropped]
Total Pkts=271128/Dropped=0.0 %
271128 pkts – 220184576 bytes [135440.8 pkt/sec – 879.94 Mbit/sec]
=========================
Actual Stats: [channel=1][91540 pkts][1001.8 ms][91375.9 pkt/sec]
=========================
Absolute Stats: [channel=2][251004 pkts rcvd][0 pkts dropped]
Total Pkts=251004/Dropped=0.0 %
251090 pkts – 210457632 bytes [125430.9 pkt/sec – 840.91 Mbit/sec]
=========================
Actual Stats: [channel=2][85799 pkts][1001.8 ms][85645.2 pkt/sec]
=========================
Absolute Stats: [channel=3][256648 pkts rcvd][0 pkts dropped]
Total Pkts=256648/Dropped=0.0 %
256648 pkts – 213116218 bytes [128207.4 pkt/sec – 851.69 Mbit/sec]
=========================
Actual Stats: [channel=3][86188 pkts][1001.8 ms][86033.5 pkt/sec]
=========================
Absolute Stats: [channel=4][261802 pkts rcvd][0 pkts dropped]
Total Pkts=261802/Dropped=0.0 %
261802 pkts – 225272589 bytes [130782.1 pkt/sec – 900.27 Mbit/sec]
=========================
Actual Stats: [channel=4][86528 pkts][1001.8 ms][86372.9 pkt/sec]
=========================
Absolute Stats: [channel=5][275665 pkts rcvd][0 pkts dropped]
Total Pkts=275665/Dropped=0.0 %
275665 pkts – 239259529 bytes [137707.3 pkt/sec – 956.17 Mbit/sec]
=========================
Actual Stats: [channel=5][91780 pkts][1001.8 ms][91615.5 pkt/sec]
=========================
Absolute Stats: [channel=6][295611 pkts rcvd][0 pkts dropped]
Total Pkts=295611/Dropped=0.0 %
295611 pkts – 231543496 bytes [147671.2 pkt/sec – 925.33 Mbit/sec]
=========================
Actual Stats: [channel=6][100521 pkts][1001.8 ms][100340.8 pkt/sec]
=========================
Absolute Stats: [channel=7][268374 pkts rcvd][0 pkts dropped]
Total Pkts=268374/Dropped=0.0 %
268374 pkts – 230010930 bytes [134065.1 pkt/sec – 919.21 Mbit/sec]
=========================
Actual Stats: [channel=7][91749 pkts][1001.8 ms][91584.5 pkt/sec]
=========================
Absolute Stats: [channel=8][312726 pkts rcvd][0 pkts dropped]
Total Pkts=312726/Dropped=0.0 %
312726 pkts – 286419690 bytes [156220.9 pkt/sec – 1144.64 Mbit/sec]
=========================
Actual Stats: [channel=8][86361 pkts][1001.8 ms][86206.2 pkt/sec]
=========================
Absolute Stats: [channel=9][275091 pkts rcvd][0 pkts dropped]
Total Pkts=275091/Dropped=0.0 %
275091 pkts – 229807313 bytes [137420.5 pkt/sec – 918.39 Mbit/sec]
=========================
Actual Stats: [channel=9][91118 pkts][1001.8 ms][90954.6 pkt/sec]
=========================
Absolute Stats: [channel=10][289441 pkts rcvd][0 pkts dropped]
Total Pkts=289441/Dropped=0.0 %
289441 pkts – 254843198 bytes [144589.0 pkt/sec – 1018.45 Mbit/sec]
=========================
Actual Stats: [channel=10][95537 pkts][1001.8 ms][95365.7 pkt/sec]
=========================
Absolute Stats: [channel=11][241318 pkts rcvd][0 pkts dropped]
Total Pkts=241318/Dropped=0.0 %
241318 pkts – 200442927 bytes [120549.4 pkt/sec – 801.04 Mbit/sec]
=========================
Actual Stats: [channel=11][82011 pkts][1001.8 ms][81864.0 pkt/sec]
=========================
Absolute Stats: [channel=12][300209 pkts rcvd][0 pkts dropped]
Total Pkts=300209/Dropped=0.0 %
300209 pkts – 261259342 bytes [149968.1 pkt/sec – 1044.09 Mbit/sec]
=========================
Actual Stats: [channel=12][101524 pkts][1001.8 ms][101342.0 pkt/sec]
=========================
Absolute Stats: [channel=13][293733 pkts rcvd][0 pkts dropped]
Total Pkts=293733/Dropped=0.0 %
293733 pkts – 259477621 bytes [146733.0 pkt/sec – 1036.97 Mbit/sec]
=========================
Actual Stats: [channel=13][97021 pkts][1001.8 ms][96847.1 pkt/sec]
=========================
Absolute Stats: [channel=14][267101 pkts rcvd][0 pkts dropped]
Total Pkts=267101/Dropped=0.0 %
267101 pkts – 226064969 bytes [133429.1 pkt/sec – 903.44 Mbit/sec]
=========================
Actual Stats: [channel=14][86862 pkts][1001.8 ms][86706.3 pkt/sec]
=========================
Absolute Stats: [channel=15][266323 pkts rcvd][0 pkts dropped]
Total Pkts=266323/Dropped=0.0 %
266323 pkts – 232926529 bytes [133040.5 pkt/sec – 930.86 Mbit/sec]
=========================
Actual Stats: [channel=15][91437 pkts][1001.8 ms][91273.1 pkt/sec]
=========================
Aggregate stats (all channels): [1463243.0 pkt/sec][15023.51 Mbit/sec][0 pkts dropped]
=========================