FAQ
Licenses
I’m using nProbe with ntopng. Do I need a license for it?
Yes. See the nProbe product page.
I’m using nProbe Cento with ntopng. Do I need a license for it?
Yes. See the nProbe Cento product page.
I’m using n2disk with ntopng. Do I need a license for it?
Yes. See the n2disk product page.
What to Save: Timeseries, Flows, pcaps
In it’s standard setup, ntopng provides (near-)realtime visibility into what’s happening on the network. Historical analyses can be done with ntopng using:
Flows
pcaps
In terms of disk space used, timeseries take less space than flows which, in turn, take less space than pcaps. This article gives useful indications on the space required.
A good introduction and discussion of how to use timeseries, flows and pcaps to investigate issues is available in blog post Drill Down Deeper: Using ntopng to Zoom In, Filter Out and Go Straight to the Packets.
Timeseries
Timeseries are used to chart metrics over time, such as the bytes sent and received by an host, or the number of bytes for a Layer-7 application.
Use timeseries when neither flows nor packets are required for historical analyses.
Flows
Monitored Flows can be saved so they can be accessed when doing historical analyses. This allows to go back in time and browse all the past flows. To dump flows refer to Flows Dump and Historical.
pcaps
Saving pcaps means saving all the traffic seen into files. This allows to go back in time and fetch all the traffic packets seen at any past point in time. This can be highly challenging in terms of space used. To save pcaps, refer to Using ntopng with n2disk.
Maximum Number of Interfaces
The recommended number of interfaces monitored by an ntopng running on a commodity quad-core hardware is 8. However, the actual maximum number of interfaces can be greater than 8, when adequate hardware is used.
The maximum number of interfaces depends on the license, as is highlighted in the following table
Maximum Number of Interfaces |
|
Community |
8 |
Pro |
8 |
Enterprise M |
16 |
Enterprise L |
32 |
Enterprise XL |
64 |
Limits above also apply when disaggregated interfaces are used. For example, the maximum 32 interfaces limit can be hit when:
32 interfaces are used without disaggregation
A single interface is configured with disaggregation resulting in 31 disaggregated sub-interfaces
Two interfaces are configured with disaggregation resulting in 15 and 16 disaggregated sub-interfaces, respectively
Cannot Login into the GUI
If you locked yourself out of the ntopng GUI after a change in the authentication method, you can reset the ntopng login method to the default one (local authentication) with the following command:
# For ntopng 3.7 and above:
redis-cli set ntopng.prefs.local.auth_enabled 1

# For ntopng 3.6 and below:
redis-cli set ntopng.prefs.auth_type local
After restarting ntopng, you should be able to login with the administrator credentials.
If you forgot the administrator password, you can reset it with the following command:
redis-cli del ntopng.user.admin.password
After restarting ntopng, you can login with the default ntopng credentials (admin, admin).
Warning
Some browser plugins that perform JavaScript blocking may interfere with the login. Sometimes adding an exception for ntopng is not enough. Try to disable them before reporting an issue.
Note
If the login issue persist, deleting the browser cookies sometimes helps.
Too many failed authentication attempts
If a device tries to login with wrong credentials too many times, it’s IP address is blacklisted for 5 minutes. In order to manually clean the blacklist, the following command can be used:
for k in `redis-cli keys ntopng.cache.failed_logins.*`; do redis-cli del $k; done
After executing the above command and restarting ntopng, the device will be able to login again.
Reset ntopng Preferences
In order to reset the ntopng preferences the following commands can be used:
sudo systemctl stop ntopng
redis-cli keys "ntopng.*" | xargs redis-cli unlink
sudo rm /var/lib/ntopng/runtimeprefs.json
sudo systemctl restart ntopng
Note
On windows instead of restarting ntopnng with the systemctl tool you need to use the Windows Services Manager.
How Can I Troubleshoot SNMP ?
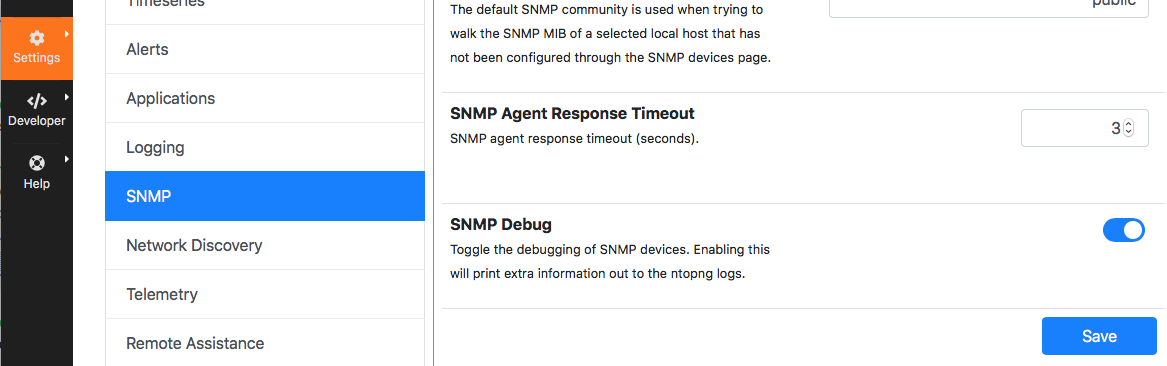
If SNMP polling is not working as expected it may be necessary to inspect the low-level SNMP messages exchanged by ntopng and the SNMP agents. In order to do this SNMP debug must be enabled as follows: inside menu Settings -> Preferences select SNMP from the left tab and enable “SNMP Debug” then save the form.
When SNMP polling starts (usually every 5 minutes) a detailed log of activities will be produced. Logs can be accessed as follows
Log to the system where ntopng is running
(as root) journalctl -u ntopng –since “1 hour ago” > /tmp/ntopng_log.txt
Send /tmp/ntopng_log.txt to the ntop team for troubleshooting
Do not forget to disable “SNMP Debug” in order to avoid filling up your disk space with ntopng SNMP logs.
How can I monitor the sites visited by an host?
To monitor the web sites visited by an host, make sure it is local (if unsure about what is a local host check page Hosts). Then, you’ll be able to immediately view its visited sites by following the simple instructions available at Sites.
Note that both plain HTTP sites as well as HTTPS sites are monitored!
How do I know who is using most of my bandwidth?
Is your Internet connection slow? Do you think someone in the network is consuming all the available bandwidth? Well, ntopng helps you in understanding this.
First, have a look at the Dashboard and the DashboardPro. You’ll immediately see the top local talkers and the top remote destinations there!
Then, you can click on any of the hosts that have the highest throughput to see what are they doing. Select the Flows page and sort flows according to an ascending order of the “Actual Thpt” to have visibility on the actually traffic the host is currently doing.
How can I associate an hostname to a certain category?
Let’s say you want to want to associate traffic from and to hostname
crazynetwork.it to category “Download-FileTransfer-FileSharing” as
you know that that particular host is a mirror for the download of ISO
images.
Select the “Settings” wheel and click on “Categories”
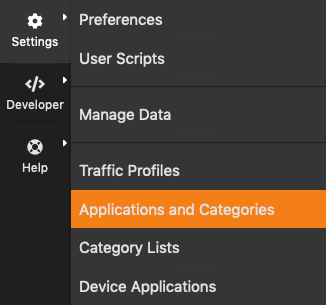
The Edit Categories Menu Entry
Then, add hostname crazynetwork.it to category
“Download-FileTransfer-FileSharing” by clicking on “Edit Hosts”.
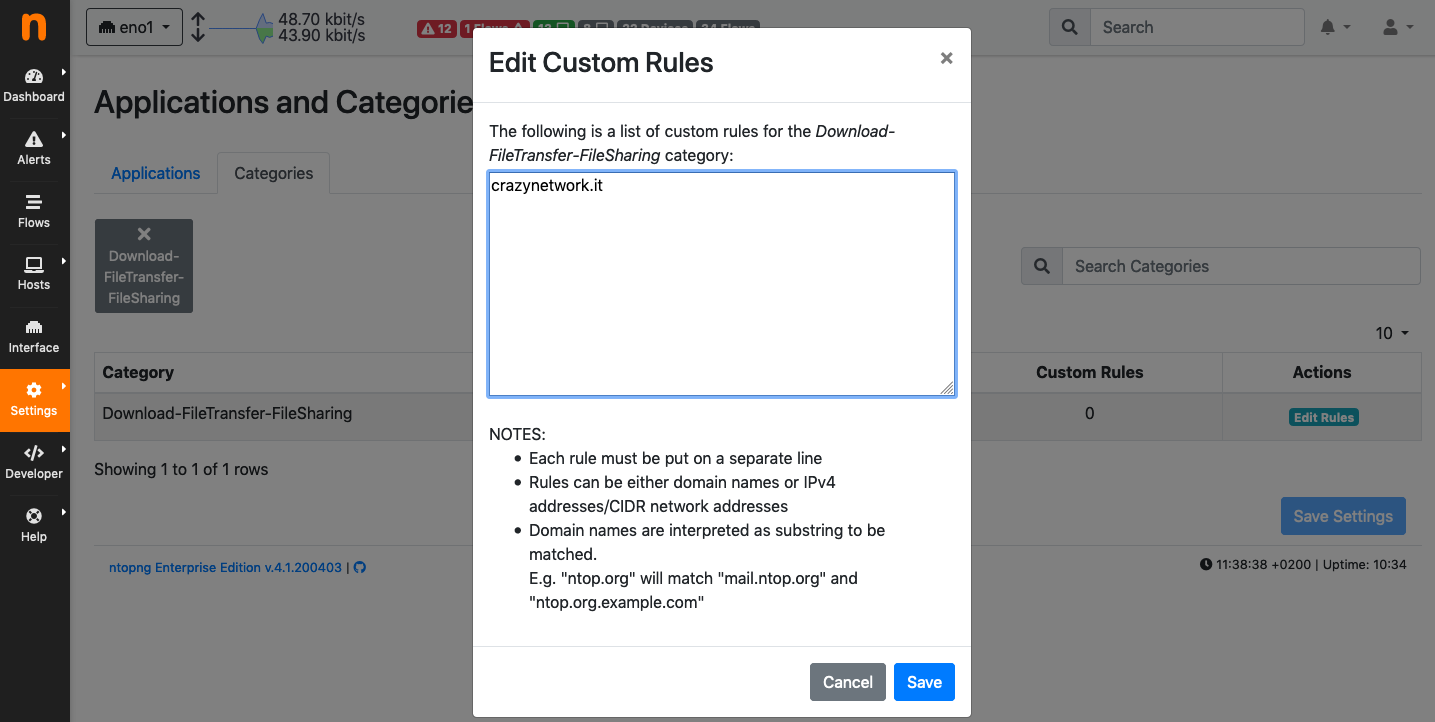
The Edit Category Hostnames Page
Finally, save and from that moment on you’ll have the matching traffic opportunely categorized
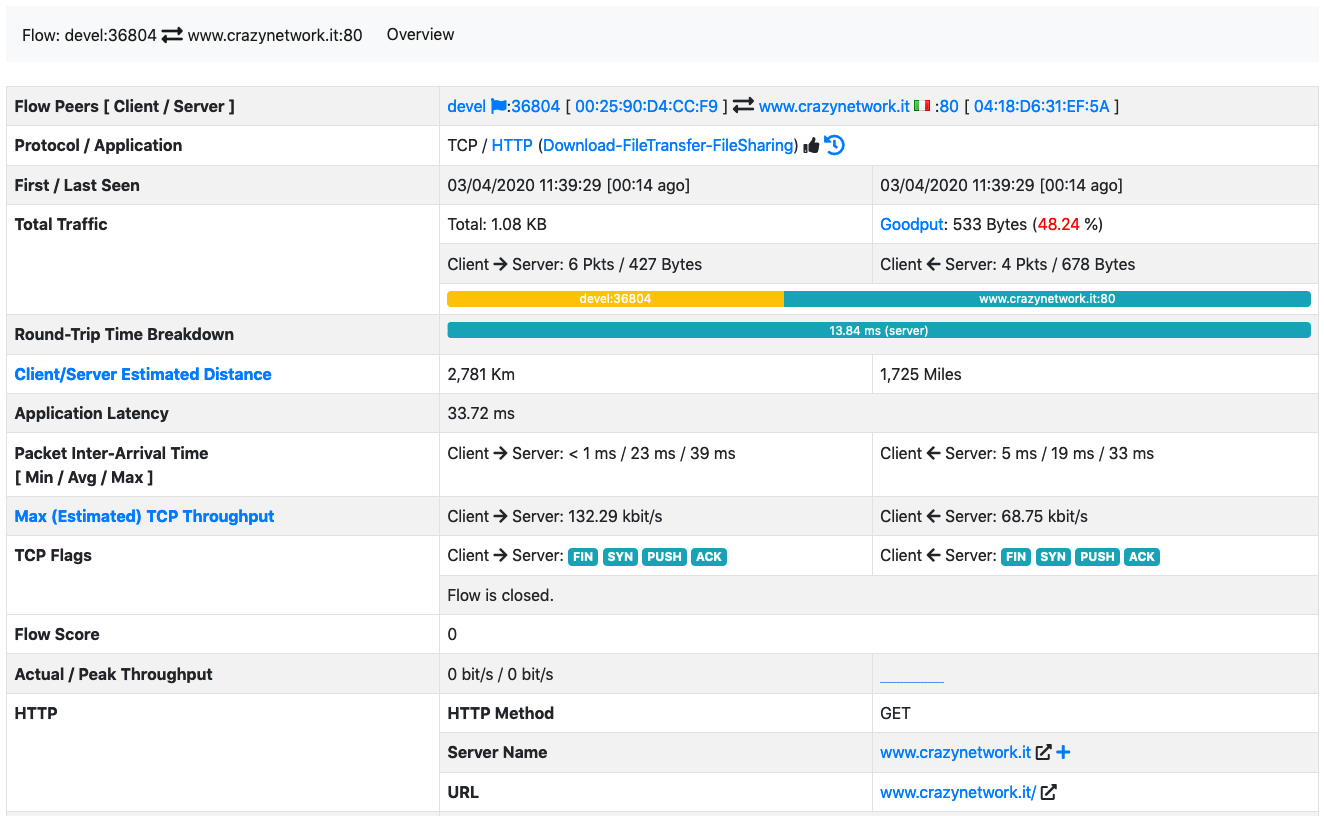
The Flow Details Page of a Flow with a Custom Category
Additional details and examples can be found at Custom Categories.
How can I estimate the disk space required by ntopng?
The following blog post gives accurate estimations of the disk space required by ntopng to store timeseries and flows: https://www.ntop.org/ntopng/ntopng-disk-requirements-for-timeseries-and-flows/
Cannot see data in Grafana
When ntopng is configured to export timeseries to InfluxDB, it is possible to use Grafana with InfluxDB as a data source to create customized dashboard. If the Grafana visualization does not display any data, here are some steps for the troubleshooting:
Verify that the data is actually written to the database. An easy way to do this is to open the interface charts page into ntopng and see if the past traffic is shown. A more accurate way is to run a query from command line: influx -database ntopng -execute ‘select * from “iface:traffic” order by time desc limit 1’ it will show the most recent data point written into the DB.
Ensure that the InfluxDB database connected to Grafana is the same as the database configured into the ntopng timeseries settings.
If the data is correctly written to the database, the problem may be related to the missing Time Series Index due to an InfluxDB version upgrade. The necessary steps to enable the TSI are described in the InfluxDB documentation. In short, the steps to perform should be:
Change the [data] section of the config and set index-version = “tsi1”
Convert the existing data to the TSI: su -m influxdb -c “influx_inspect buildtsi -database ntopng -datadir /var/lib/influxdb/data -waldir /var/lib/influxdb/wal”
Permission denied errors
If the ntopng log shows permission denied errors, then permissions on the ntopng data directory may need to be set manually.
Error ‘opening ‘/var/lib/ntopng/1/rrd/bytes.rrd’: Permission denied’ while calling rrd_fetch_r(/var/lib/ntopng/1/rrd/bytes.rrd, AVERAGE): is the RRD corrupted perhaps
Such errors usually occur in the following cases:
ntopng was started as root with -s or –dont-change-users options and now it is started as a normal user
on Ubuntu 18, sometimes the permissions for new files are wrong.
In order to fix this issue, the following commands should be used:
sudo systemctl stop ntopng
sudo chown -R ntopng:ntopng /var/lib/ntopng
sudo find /var/lib/ntopng -type d -exec chmod 700 {} +
sudo find /var/lib/ntopng -type f -exec chmod 600 {} +
sudo systemctl restart ntopng