What is nAnalyst?
Modern network teams face an interpretation problem, not a visibility problem. Terabytes of flow data are captured every day, thousands of alerts fire, and analysts still spend hours manually correlating evidence to answer a single question: why is this happening?
nAnalyst is the answer to that gap.
It is an agentic network intelligence layer built into ntopng that bridges raw telemetry and human understanding. Given a natural language question, nAnalyst autonomously:
Determines which tools and data sources are relevant
Executes SQL queries against the ntopng ClickHouse database
Collects evidence from flows, hosts, asset inventory, SNMP, and alerts
Visualizes results as charts embedded directly in the chat
Proposes and optionally applies next steps — policies, monitoring scripts, alert silences
The result is a shift from passive monitoring to active understanding:
Traditional monitoring |
With nAnalyst |
|---|---|
Dashboards |
Explanations |
Raw alerts |
Prioritized, contextualized incidents |
Manual SQL queries |
Grounded, cited answers |
Hours of manual investigation |
Automated reasoning in seconds |
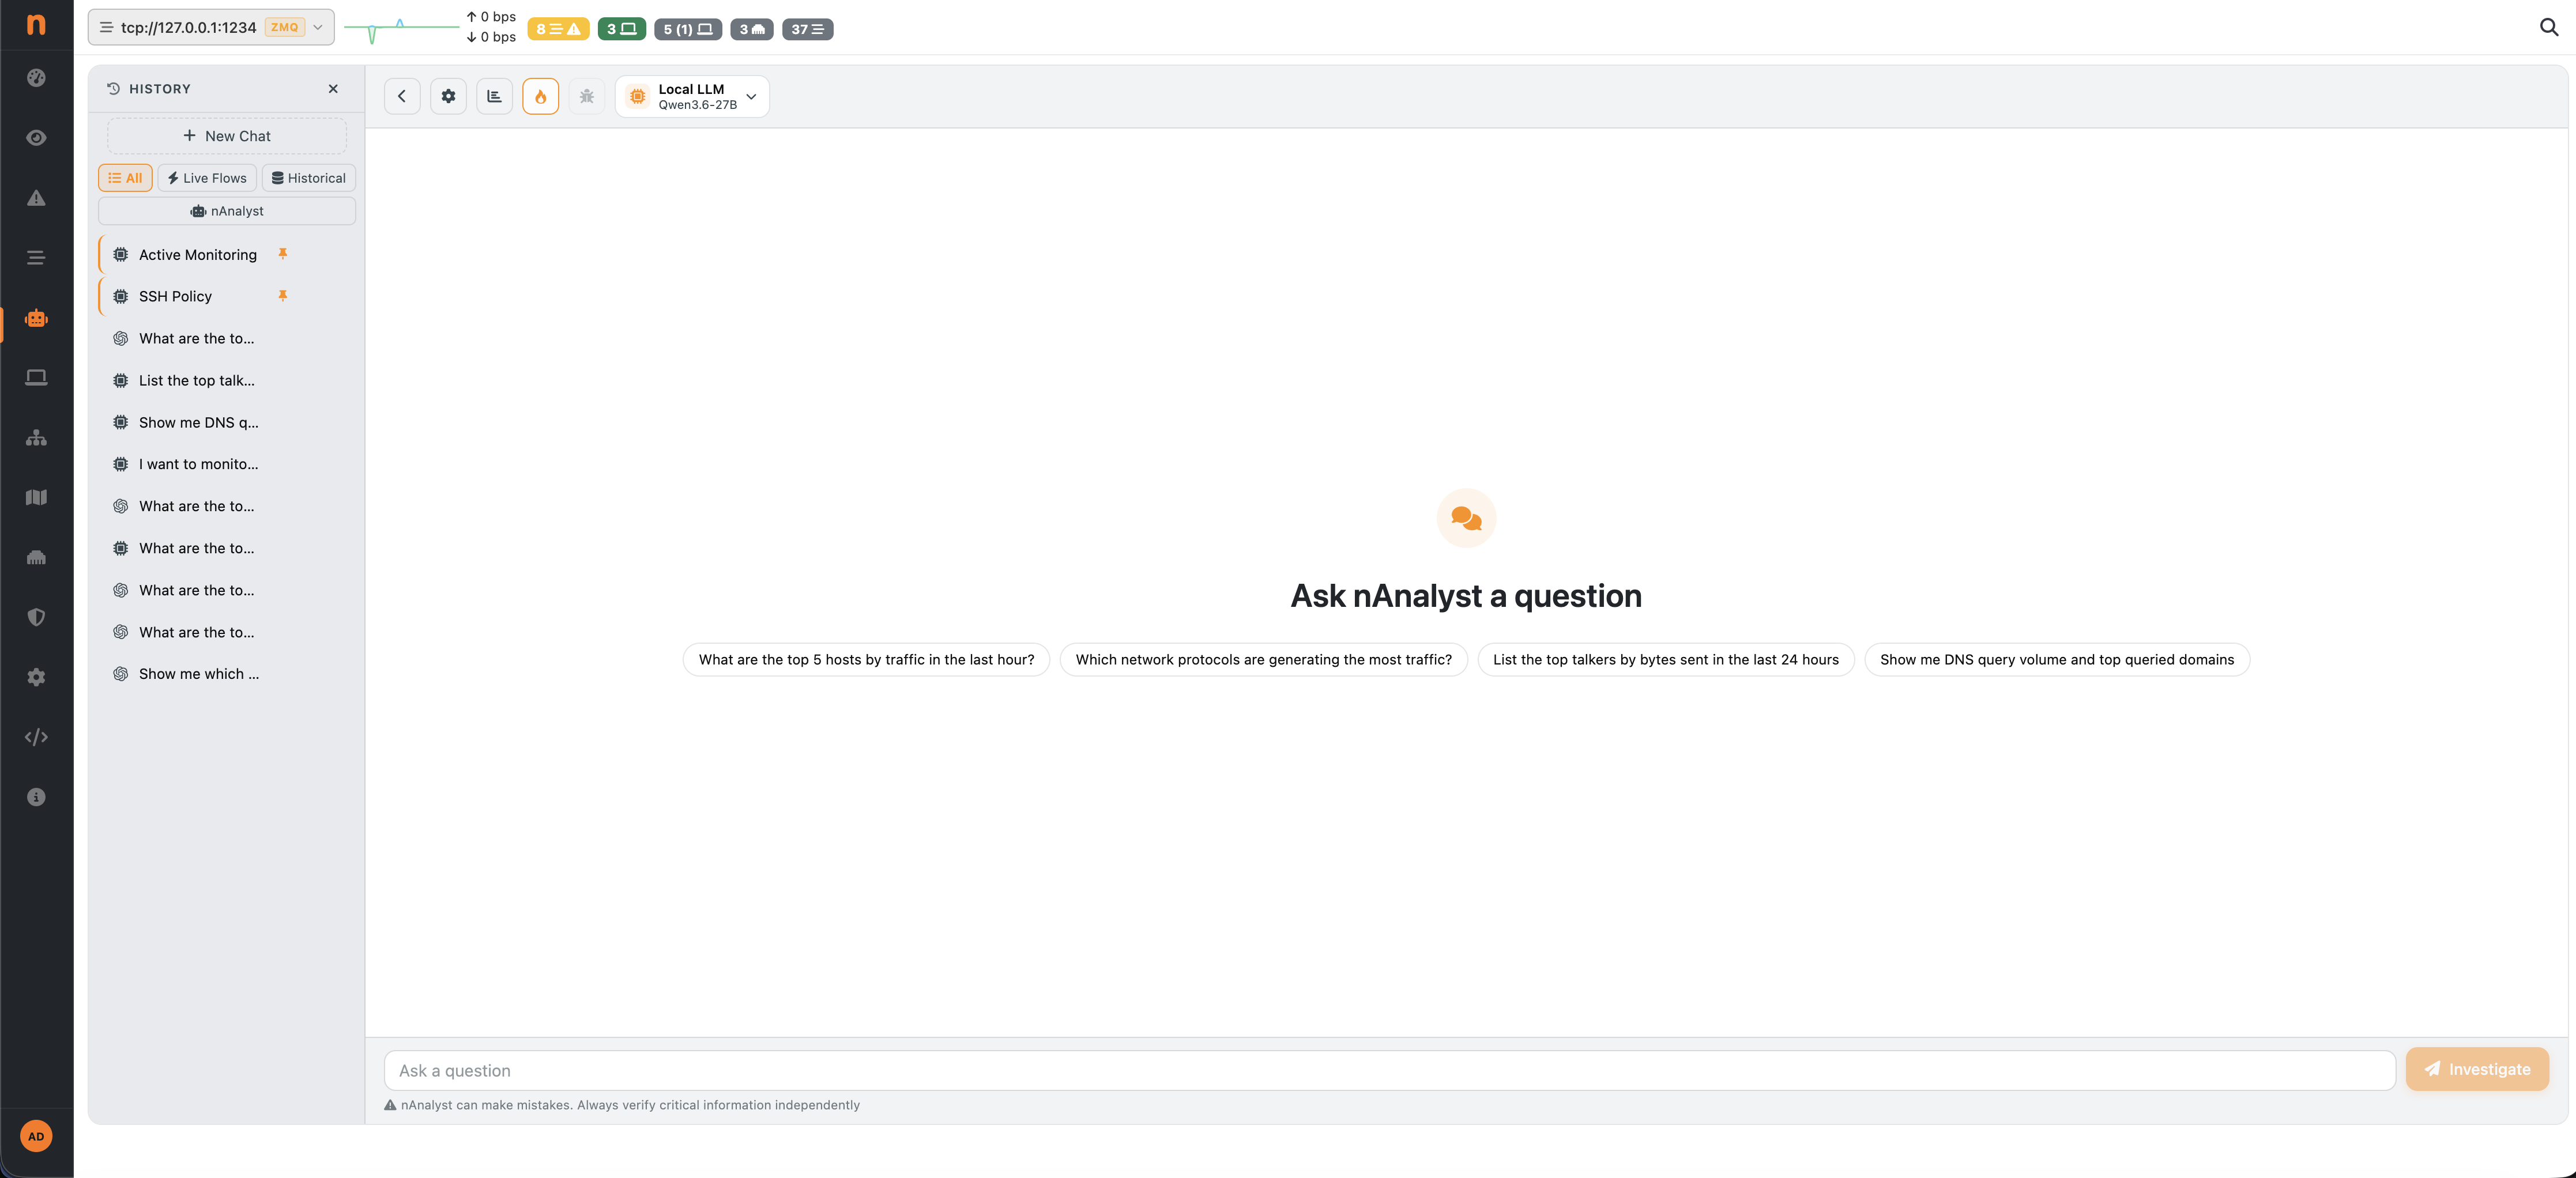
nAnalyst chat interface
What makes nAnalyst different
nAnalyst is not a generic LLM wrapper or a chatbot bolted onto a monitoring tool. It is a purpose-built network intelligence agent with 25+ domain-specific tools that understand ntopng data natively.
Explainability, not black boxes
Every step of the reasoning process is logged and shown to the user: which tools were called, what SQL was executed, what evidence was collected, and how the final answer was derived. There are no hidden inferences.
Full audit trail
Every action nAnalyst takes — creating a policy, adding a monitoring script, silencing an alert — is logged with the initiating user, the agent, the tool call content, and a timestamp. This provides SOC2-style evidence out of the box.
Privacy by design
nAnalyst runs entirely within your ntopng instance. No traffic data, no queries, and no API keys are transmitted to external services beyond the LLM endpoint you configure. You can run nAnalyst fully on-premises with a local inference server.
Cost transparency
Token usage and dollar costs are tracked per user, per model, and per tool call. Usage dashboards and model cost configuration are built in.
Native ntopng and nDPI integration
nAnalyst has direct access to ntopng’s flow engine, nDPI application signatures, host inventory, SNMP data, and alert subsystem. It understands the data semantics natively rather than through generic API calls.