Alerts Explorer
Alerts triggered by ntopng are stored in a databased (SQLite or ClickHouse) and can be visualized and managed using the built-in Alerts Explorer, in addition to delivering them to external endpoints by using Notifications.
Alerts are organized in the Alerts Explorer according to the entity (subject for which the alert has been generated), whose list includes Host, Interface, Network, Flow, etc. as described in Alerts.
Alerts can be just triggered as one-shot, or can have a duration, that is, they are active for a certain period of time. This period of time starts then a condition is verified (e.g. a threshold is met) and stops when the condition is no longer verified. For this reason, such alerts are said to be engaged or past, depending on whether the triggering threshold is still met or not.
Engaged Alerts
When the threshold is first met, ntopng puts the corresponding alert in an engaged state. The set of alerts that are currently engaged is available from the engaged alerts page identified by the hourglass icon.
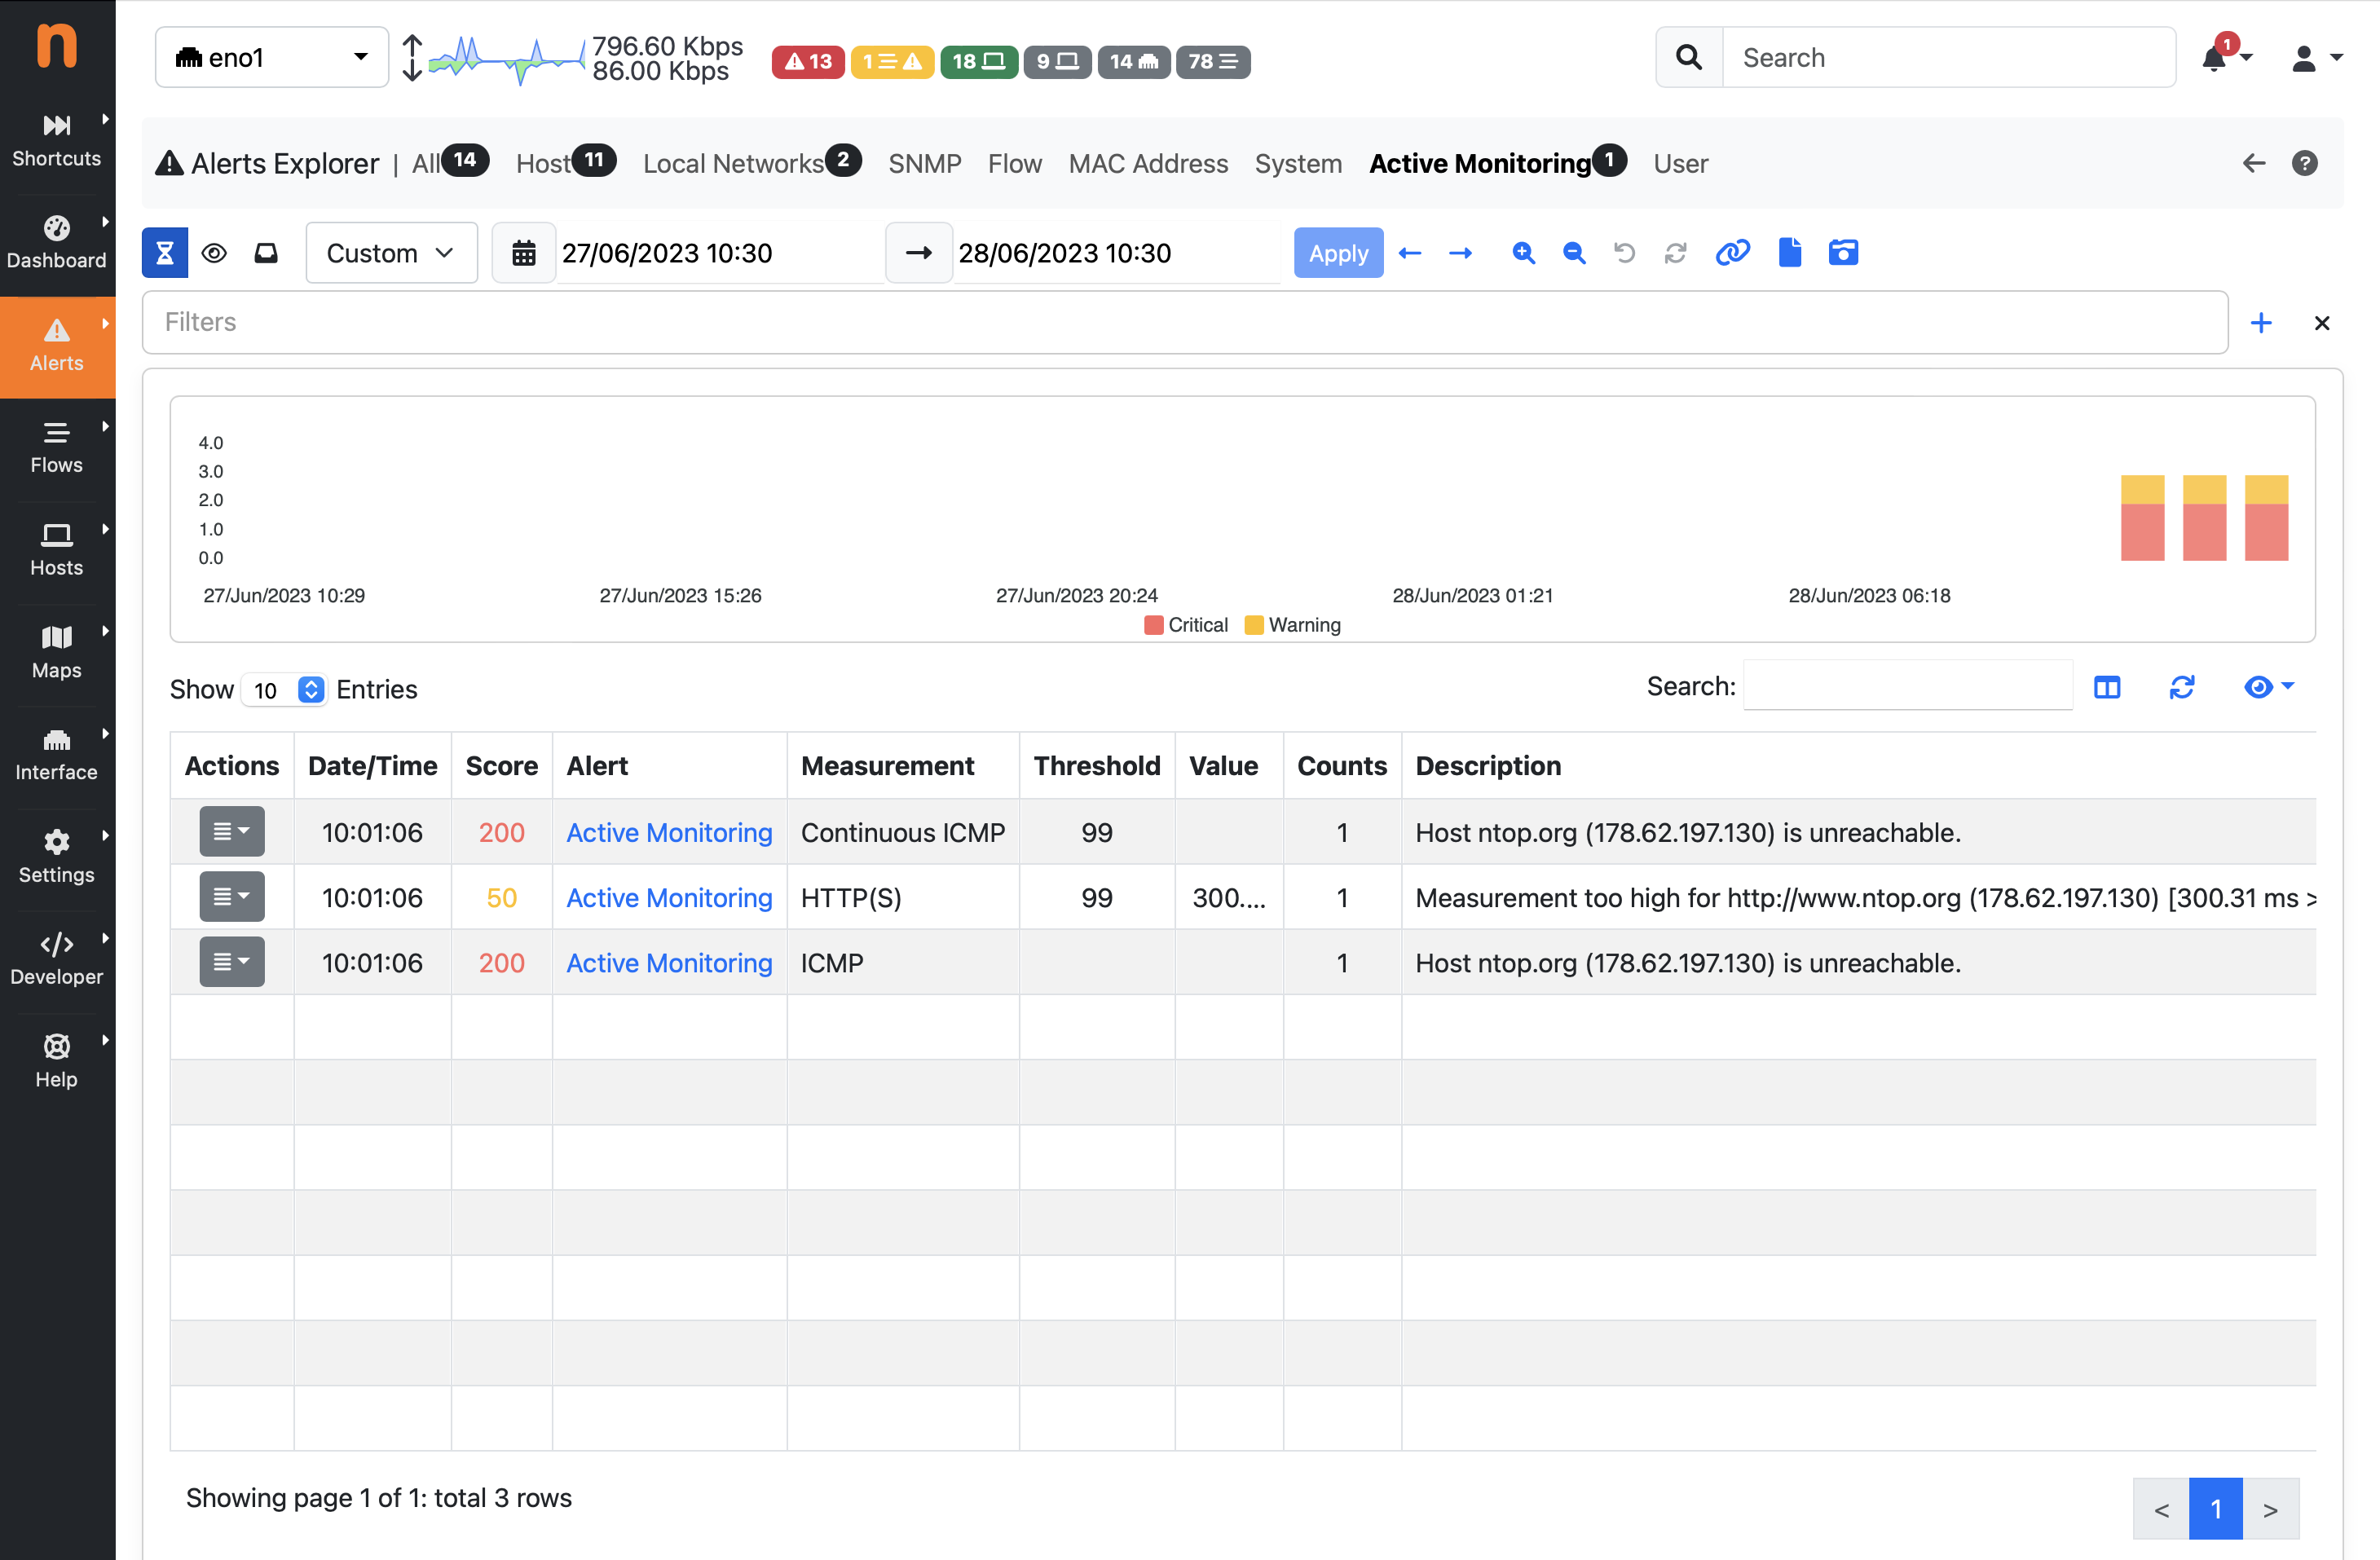
Engaged Alerts Page
Past Alerts
When the triggering threshold of an engaged alert is no longer met, the alert becomes past an it will no longer be visible in the engaged alerts page. Alerts, once released, become available from the all alerts page identified by the inbox icon, and their duration is indicated in the corresponding column.
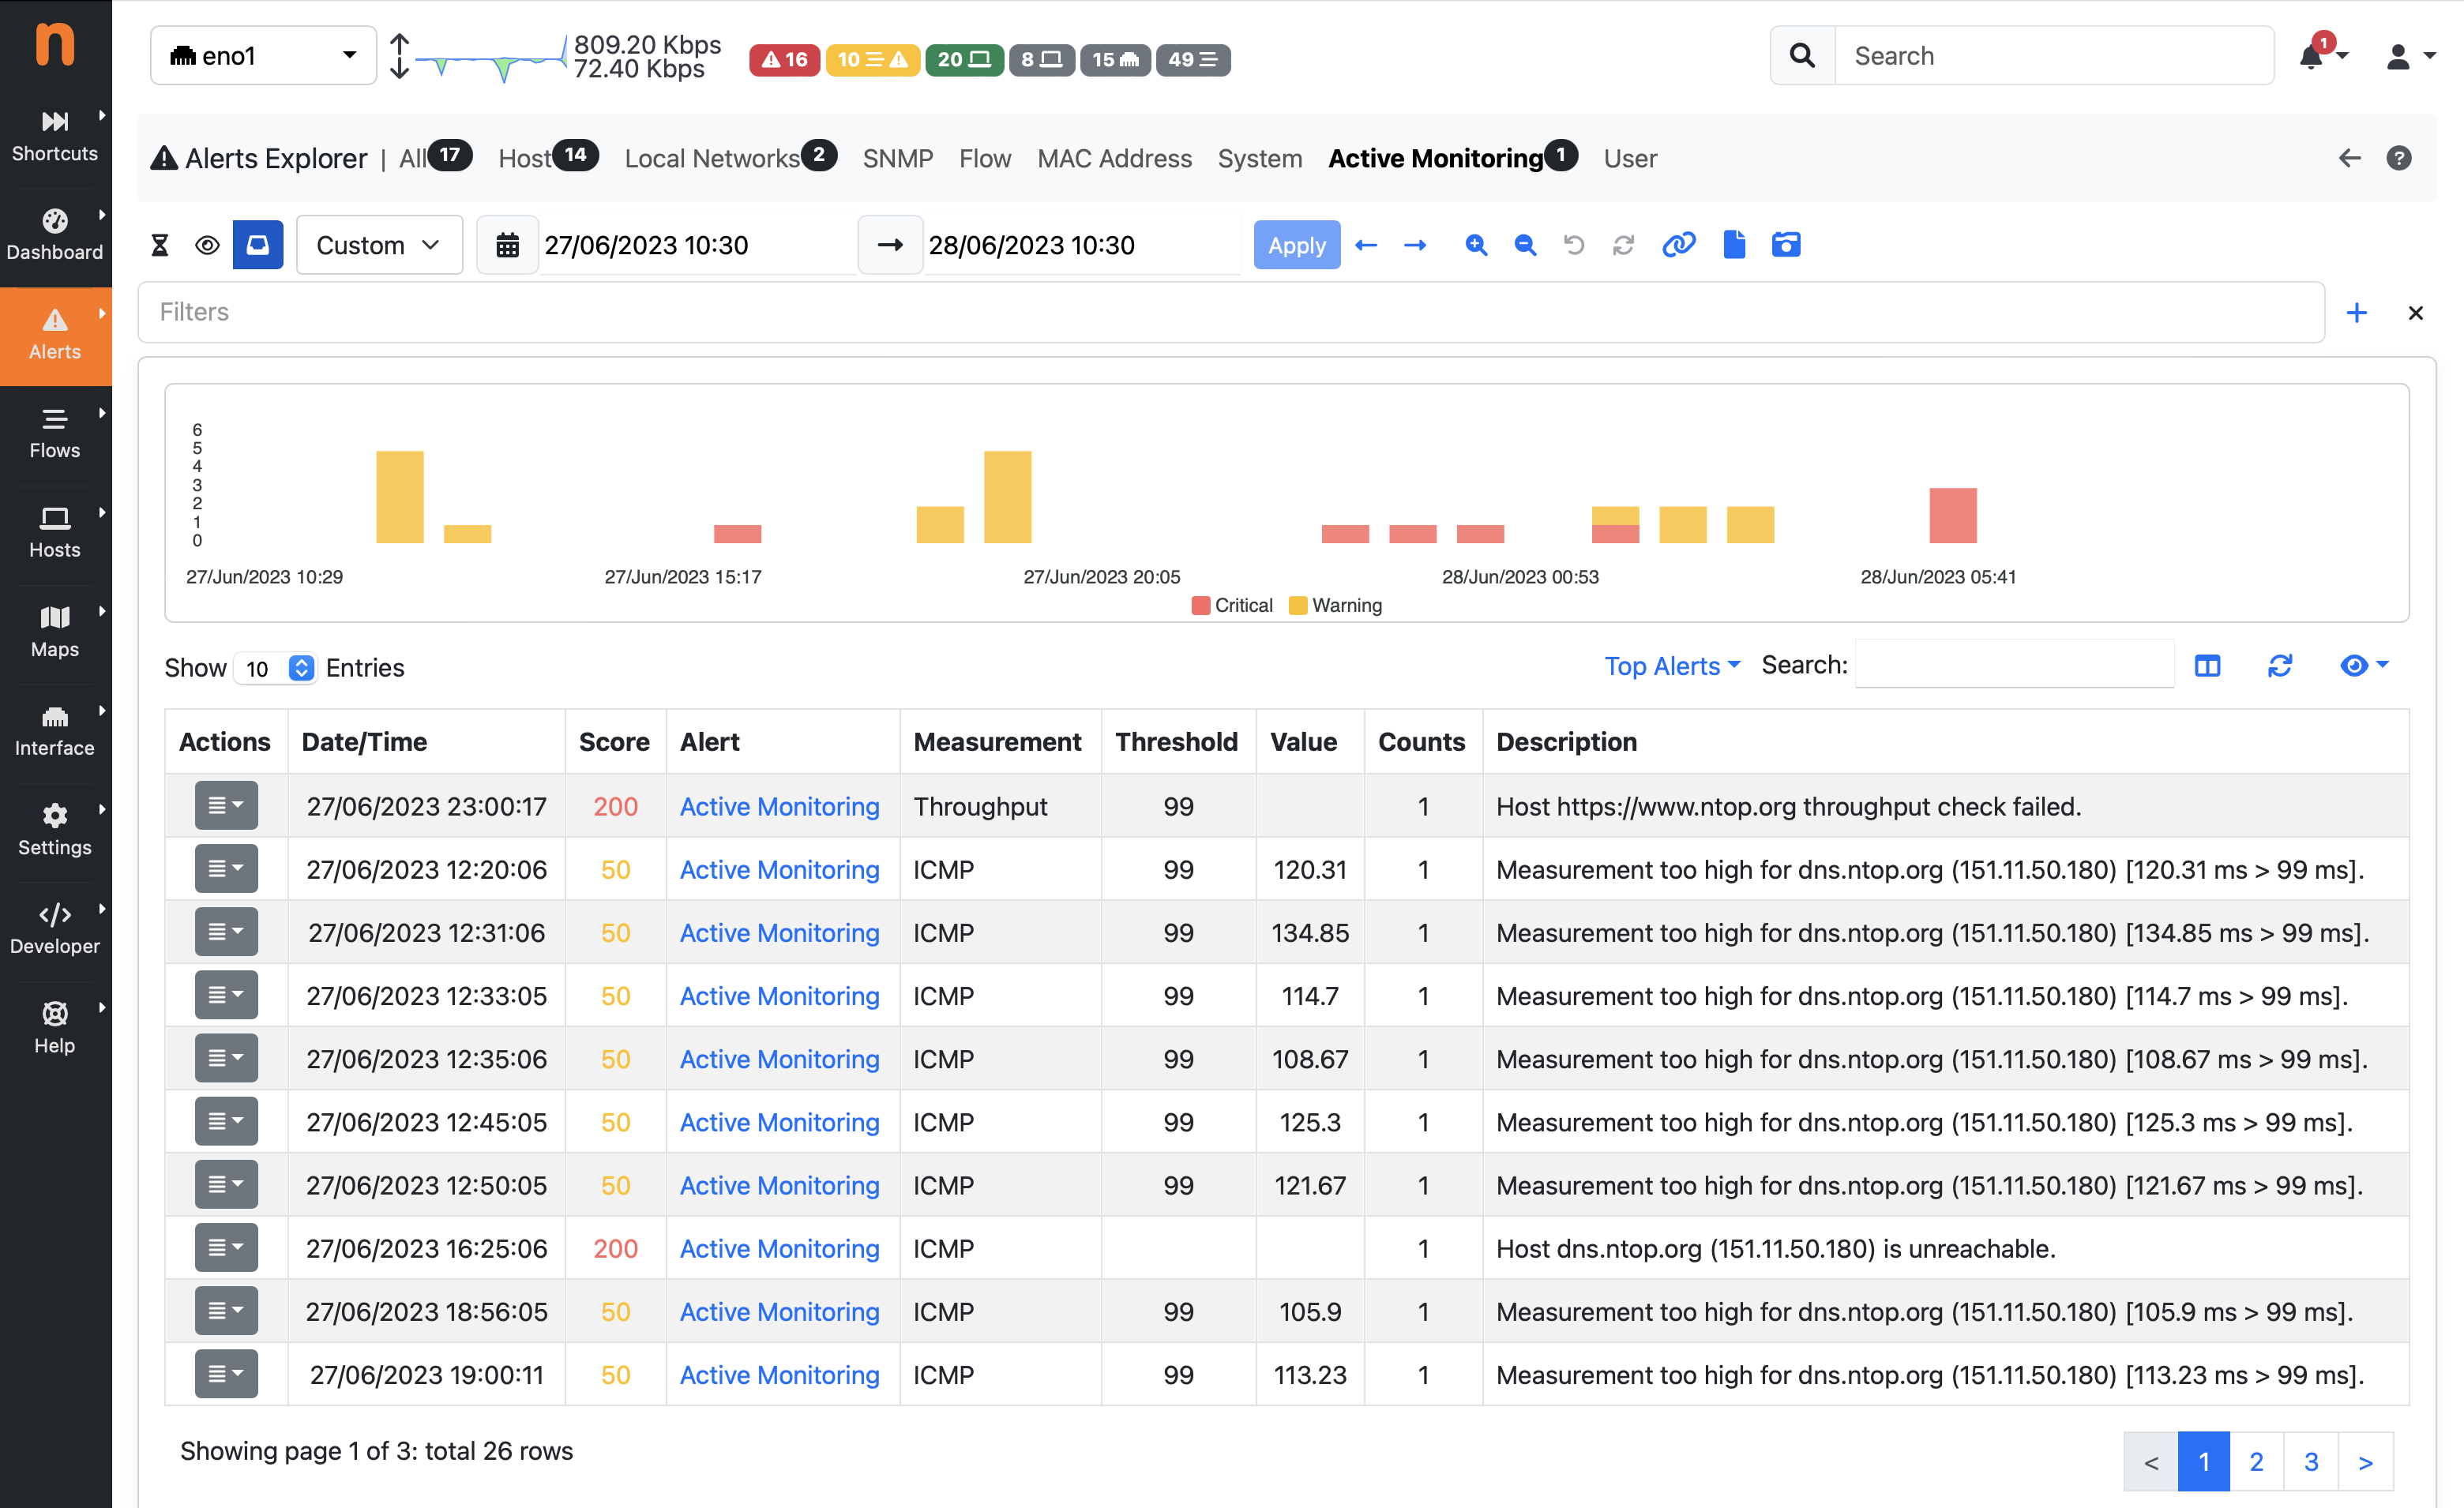
All Past Alerts Page
Alerts associated with events don’t have a duration associated. They are triggered at the time of the event but any duration is not meaningful for them. For this reason, such alerts are never engaged or released, they are just considered past as soon as they are detected, and they are placed under the all alerts page without any duration indicated.
Flow Alerts
During its execution, ntopng can detect anomalous or suspicious flows for which it triggers special flow alerts. Such alerts not only carry the event that caused the alert to be fired, they also carry all the flow details, including source and destination IP addresses, layer-7 application protocol, and ports.
Flow alerts are always associated with events and thus they are never engaged or released and are placed in the past alerts directly.
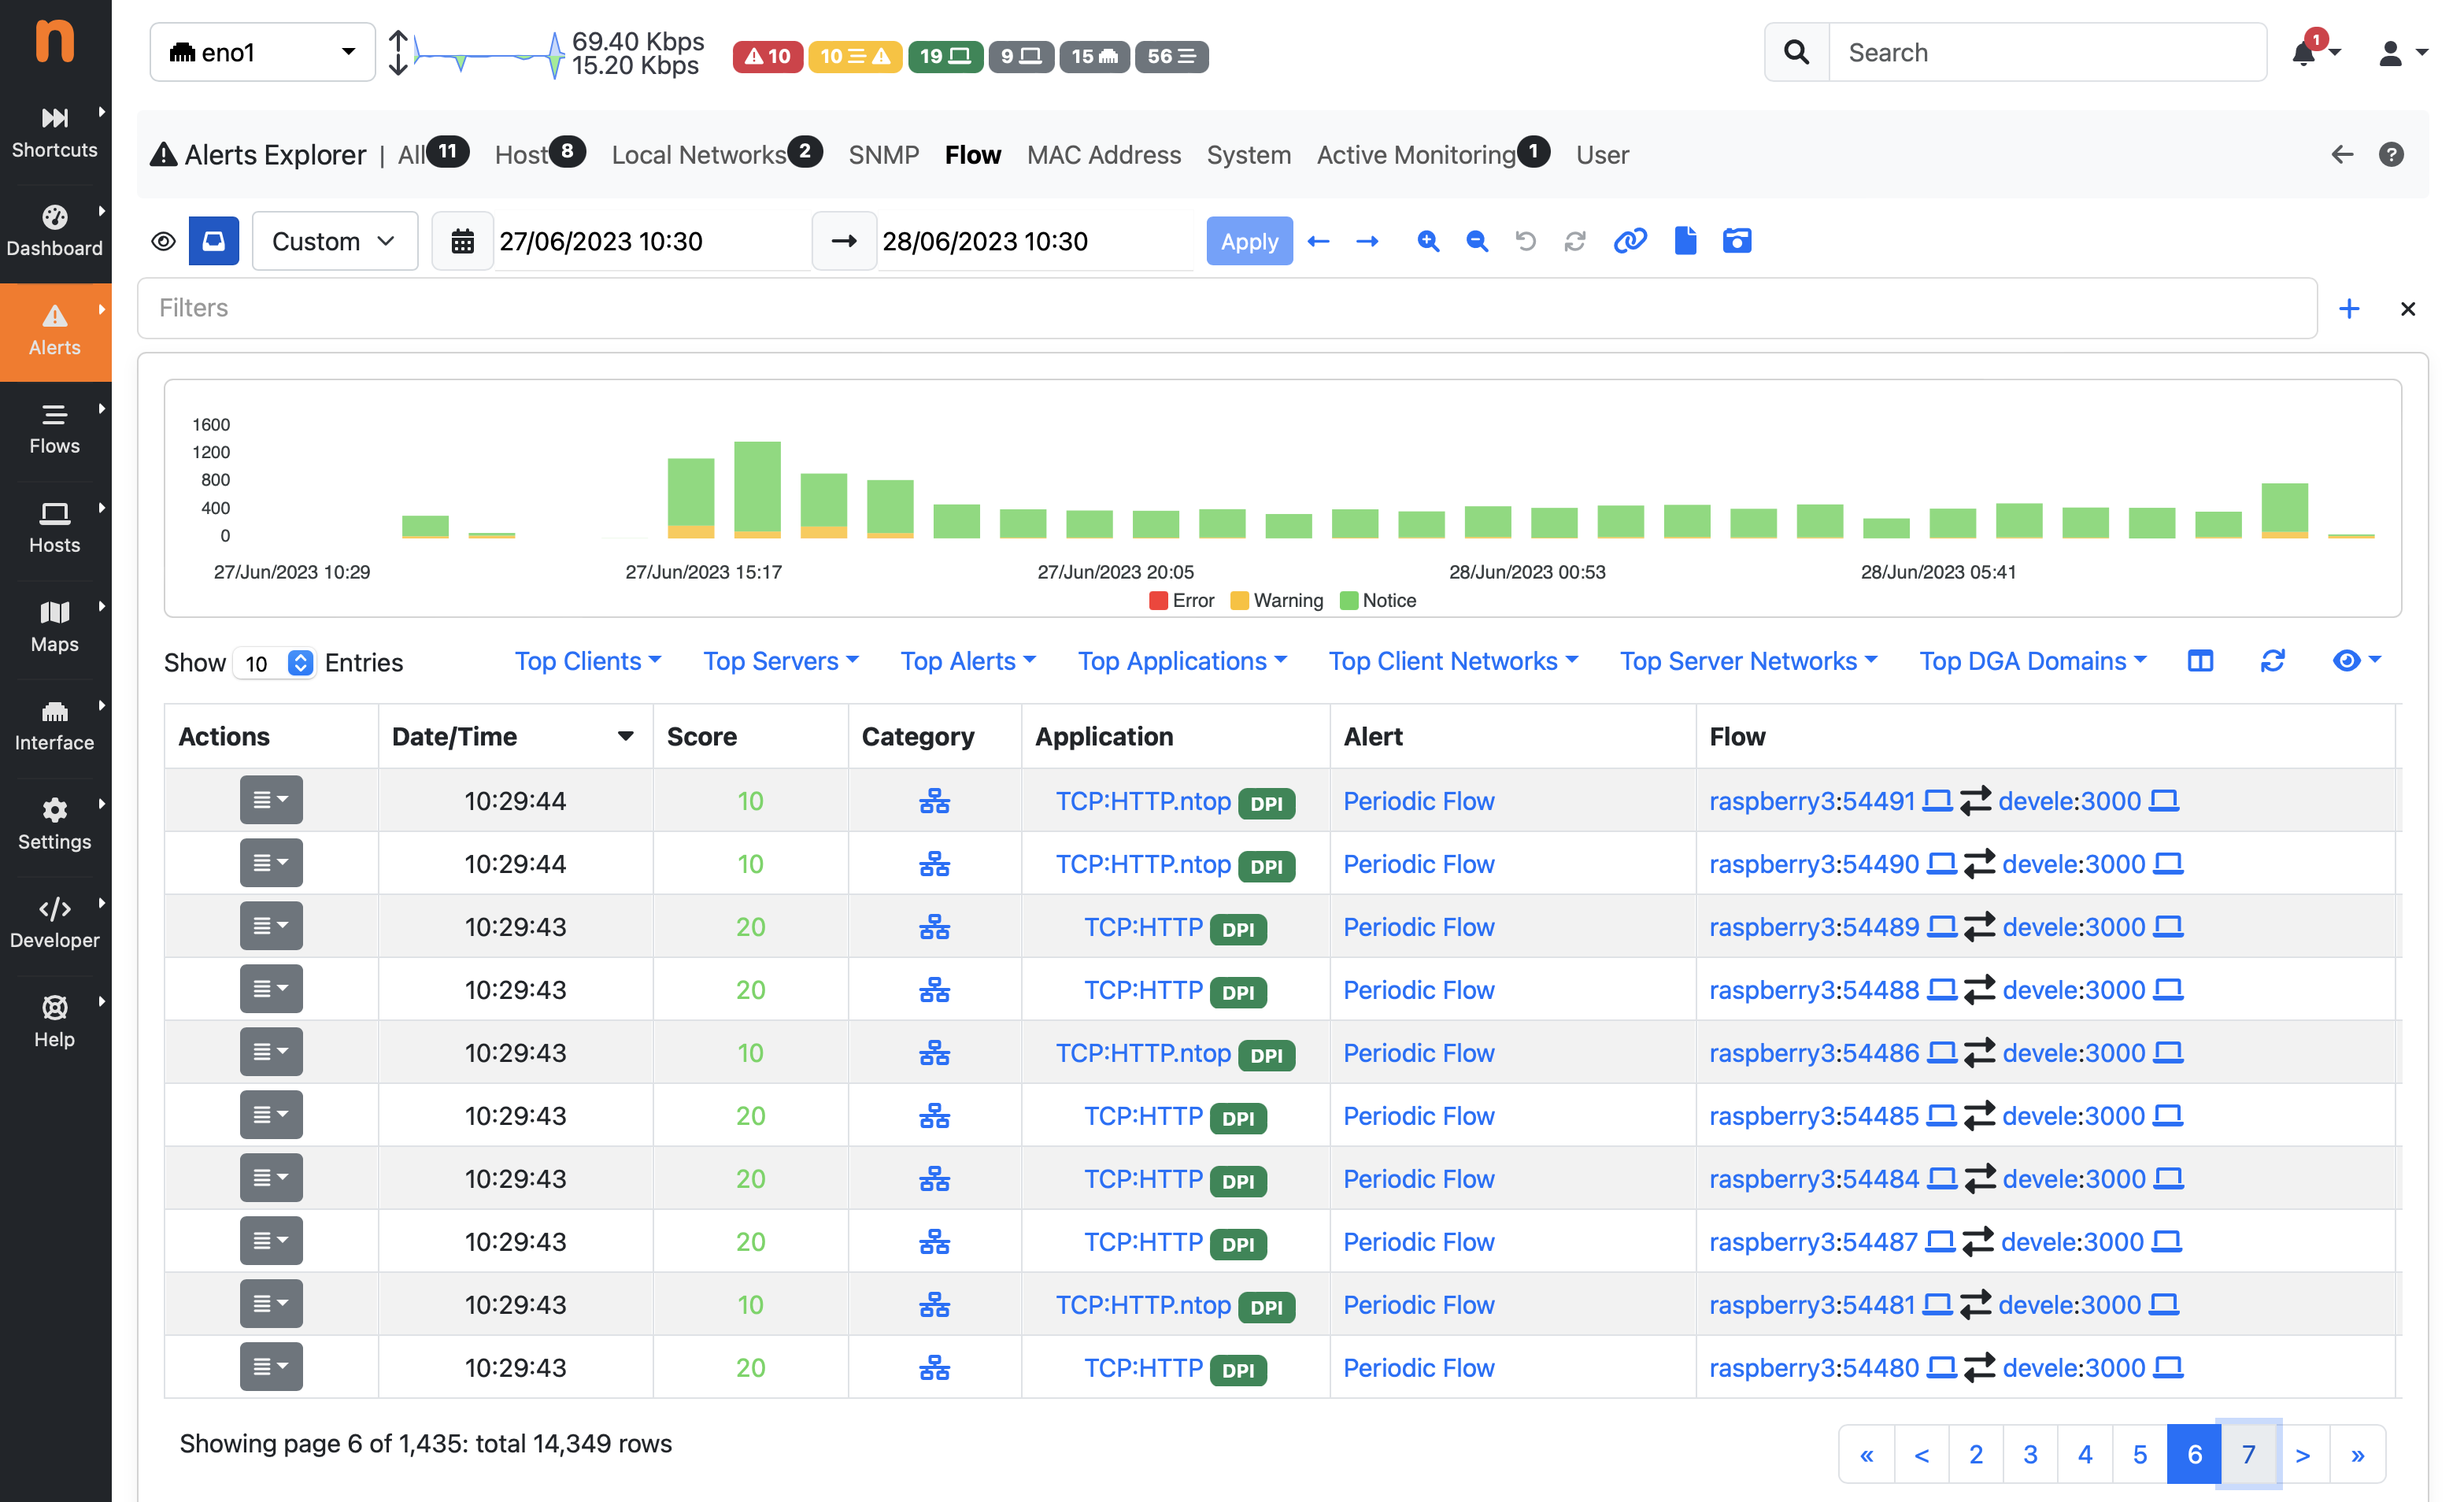
Flow Alerts Page
Alerts that require human attention and should be manually handled (e.g. related to security issues), are also placed in the page identified by the eye icon, until they are acknowledged.
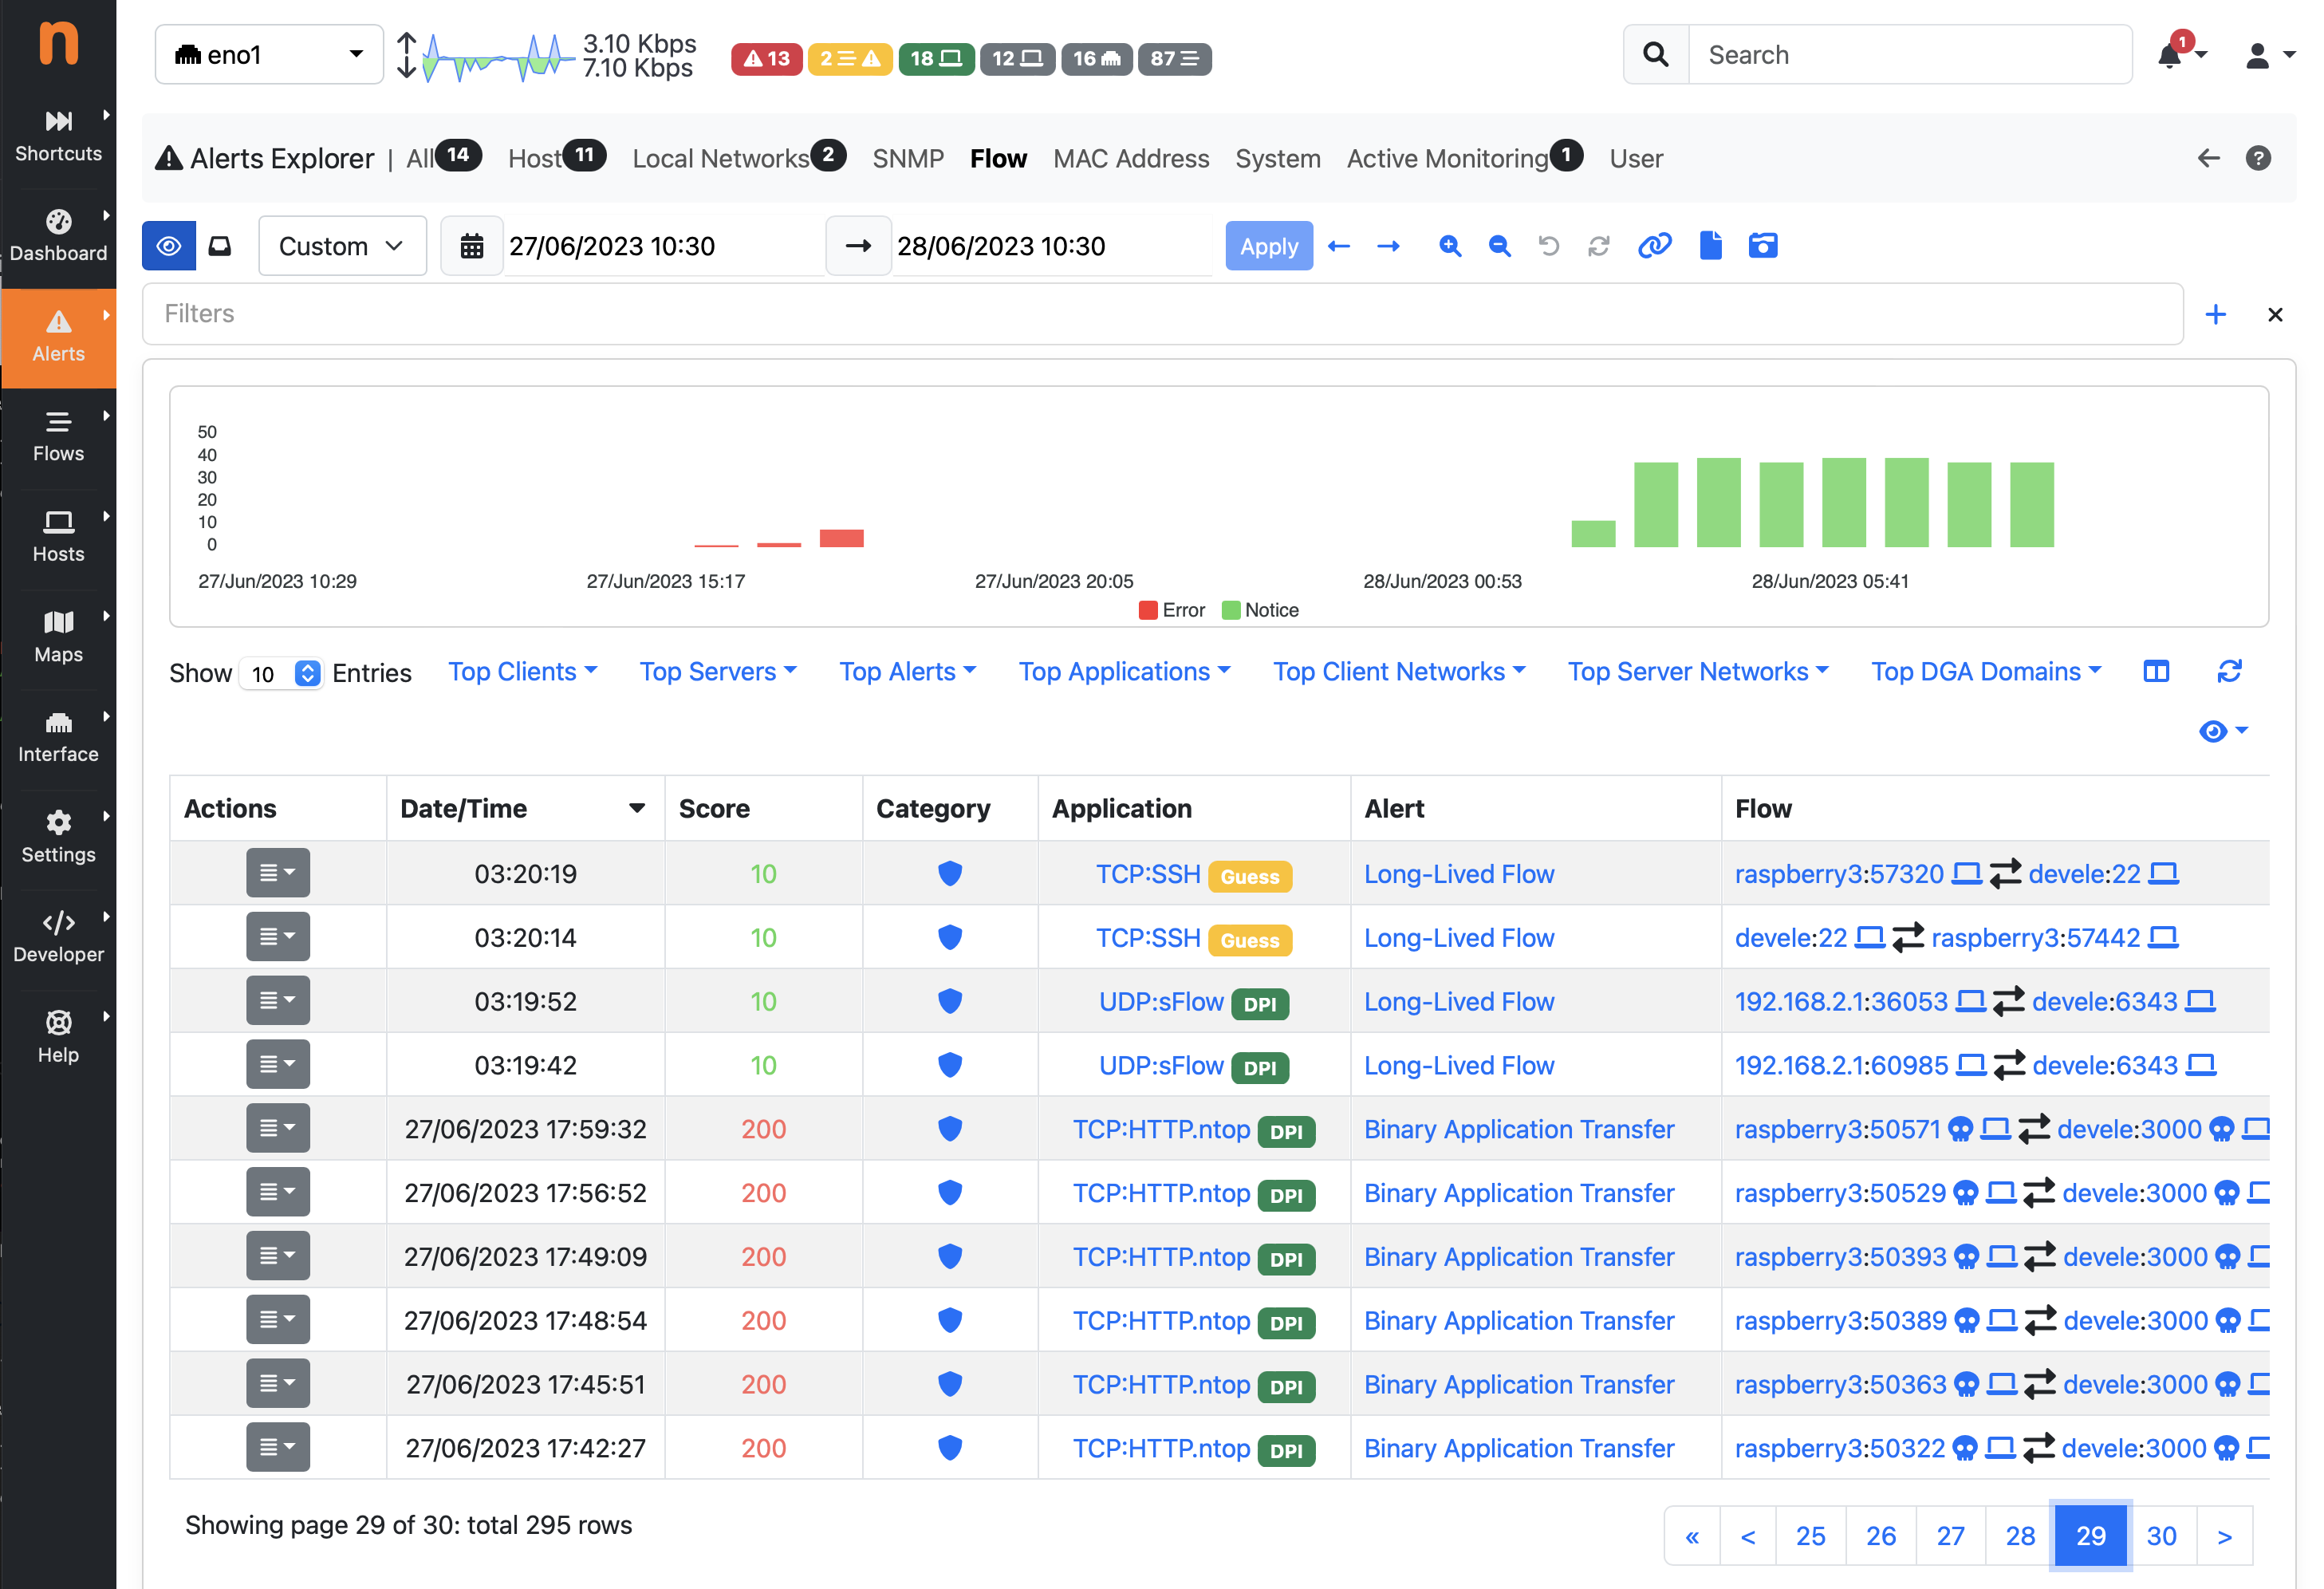
Important Past Alerts Page
Alerts Filters
Clicking on the + icon enables the specification of multiple filters in the alerts explorer page.
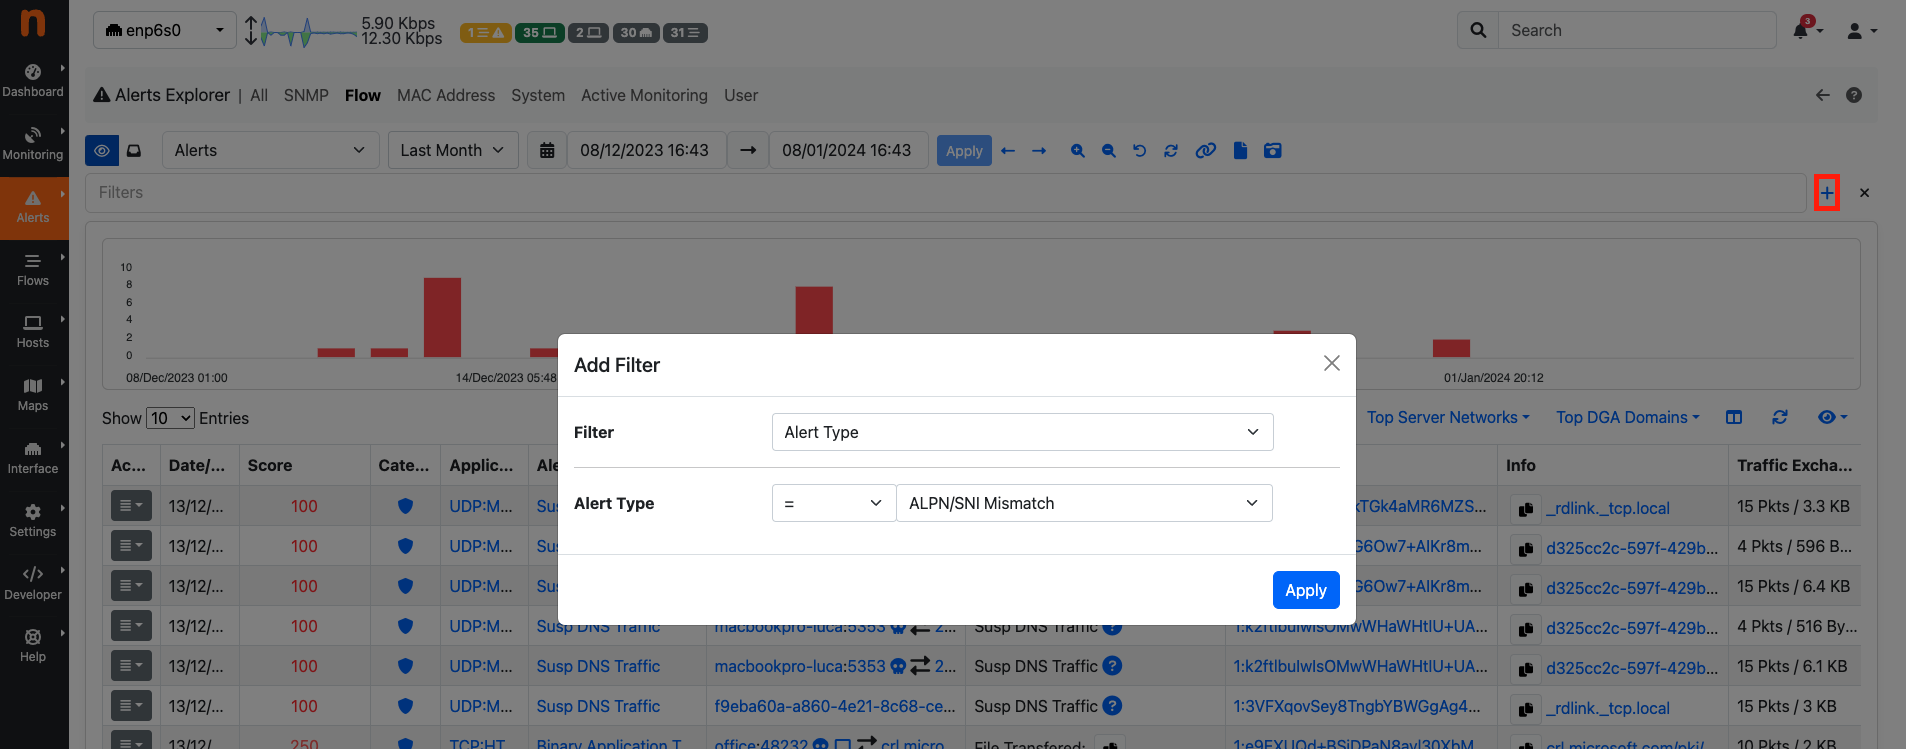
Add Filter on Alert Explorer
The filter types correspond to each column on the alerts explorer page.
By adding two filters of the same type, they will be combined using OR operator. Otherwise, adding two filters of different types will combine them using AND operator.
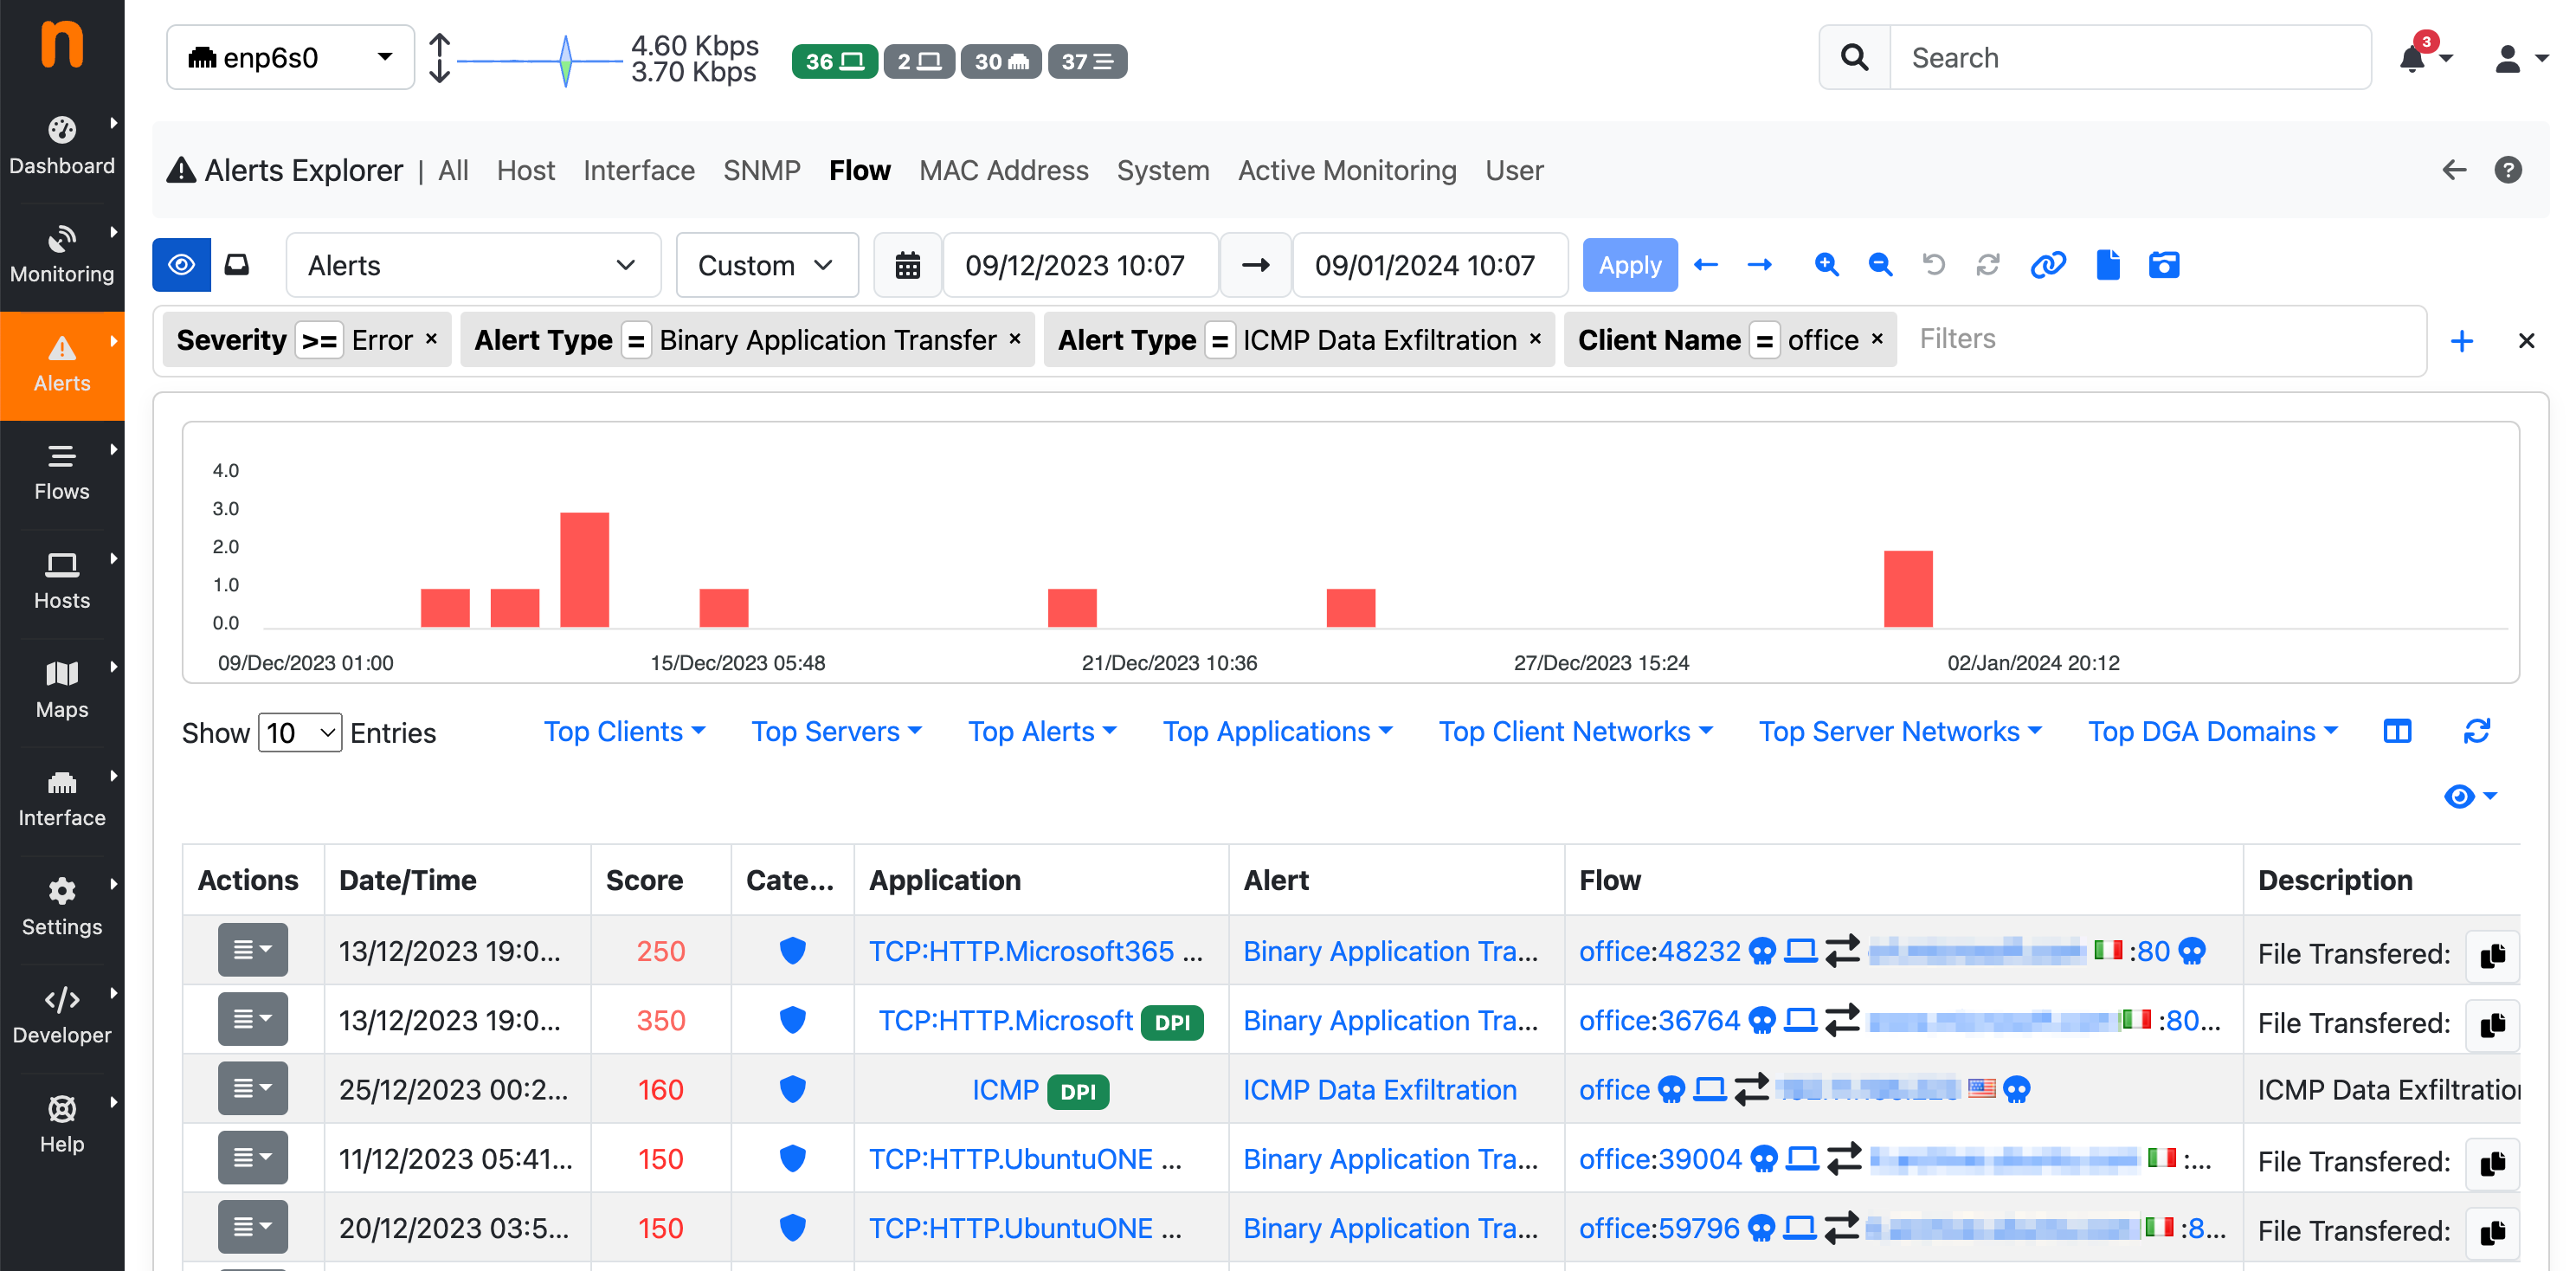
(Severity >= Error AND Client Name = office AND (Alert Type = Binary Application Transfer OR Alert Type = ICMP Data Exfiltration))
For each alert entity (such as Host, Flow, Interface, etc.), it’s possible that ntopng has emitted more than one issue. For instance, a single Flow could have issues like ‘Susp Device Protocol,’ ‘Clear-Text Credentials,’ and ‘HTTP Susp User-Agent.’
Typically, the ‘Alert Type’ filter in ntopng searches for the main issue (the one with the highest score indicated in the ‘Description’ column of the Alerts Explorer page) emitted for a Flow, Host, or other alert entities. However, if ClickHouse is enabled and the ‘Alert Type’ filter is used, ntopng can search for the specified ‘Alert Type’ across all issues (also secondary) emitted for every Flow, Host, etc.
Custom Queries
In a system which analyses traffic of a large network, the amount of alerts (in particular those which are about Network issues) can be high, also depending on the number of Behavioural Checks we enable, and how we tune them. Checking the health of the Network, by looking at those alerts one by one, may definitely be a challenging and time-consuming task. For this reason the Alerts Explorer computates and display alerts statistics through dropdowns at the top of each page, including Top Alert Types, Clients, Servers, etc, to summarize what are the main issues affecting our networks, and who are the main actors.
In order to analyze alerts when cardinality is high, ntopng also provides the ability to build additional custom views that can be defined by means of custom queries, and that can aggregate alerts according to some criteria, or manipulate them in any way allowed by SQL.
Custom queries can be defined using a simple JSON syntax, placed as .json files on the filesystem, and automatically appear in a dropdown under the Queries section in the Alerts Explorer. It is possible to build a query which groups alerts based on Client, Server and Alert Type for instance, and list all alerts matching a specific 3-tuple from the table Actions.
The default view in the Alerts Explorer is “Alerts”, which shows the full list of raw alerts. In addition to the raw “Alerts”, additional built-in views are available, which are built on top of the Custom Queries engine and include:
- Alert Type: group and count alerts by Alert Type
- Cli / Srv: group and count alerts by Client and Server
- Cli / Srv / Alert Type: group and count alerts by Client, Server and Type
- Cli / Srv / Srv Port: group and count alerts by Client, Server and Server Port
- Info: group and count alerts by domain or URL
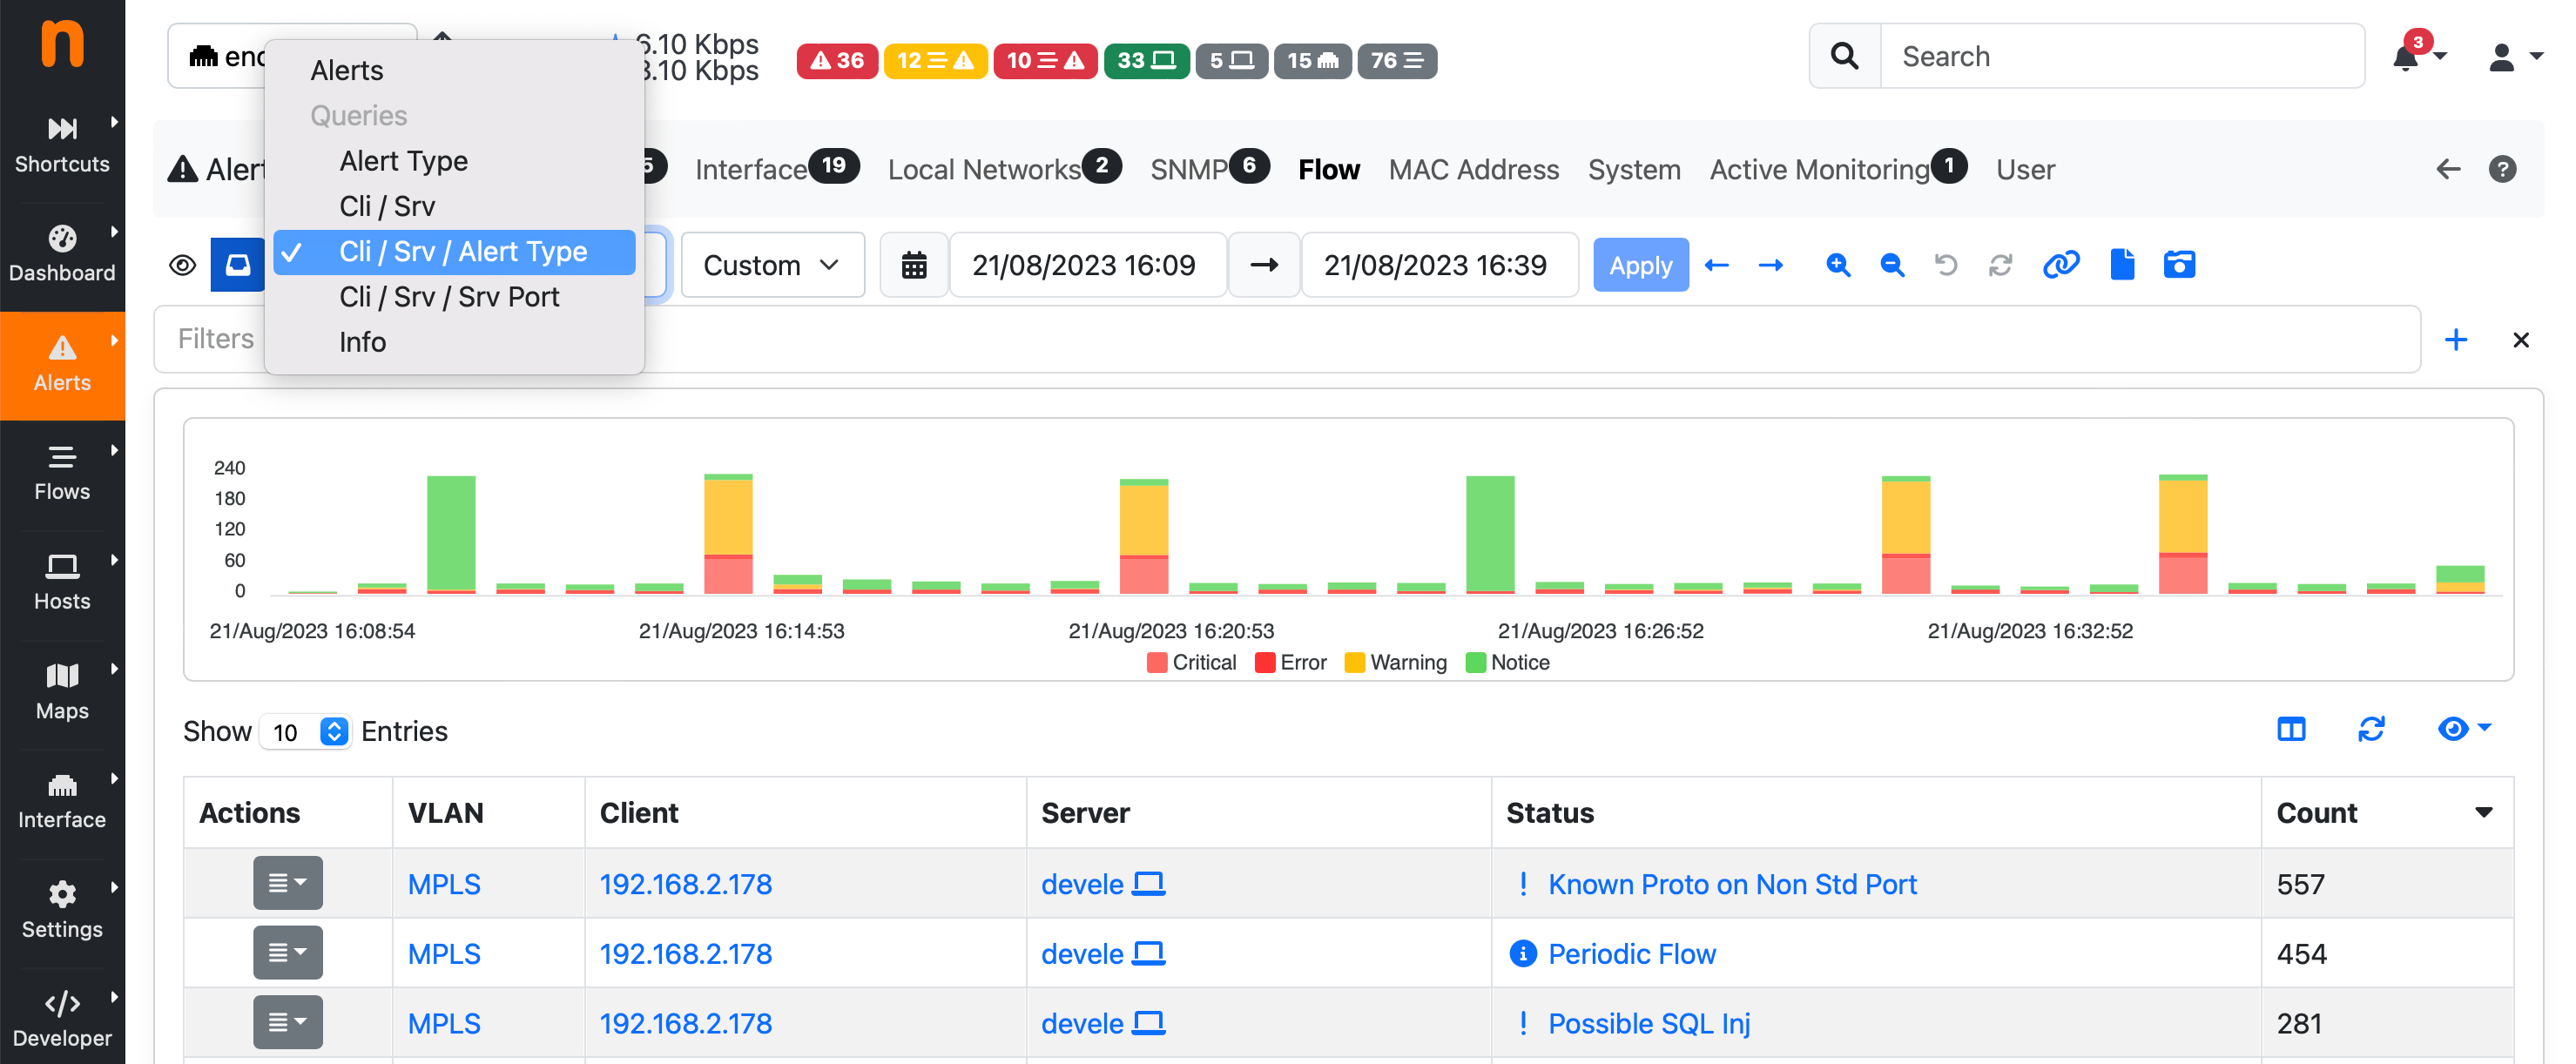
Alerts Explorer Queries
The above built-in Custom Queries can be extended by the user by creating simple JSON files containing the query description. The query definitions corresponding to the above built-in queries are available on the filesystem as JSON files under
/usr/share/ntopng/scripts/historical/alerts/{alert entity}/{query name}.json
Example:
/usr/share/ntopng/scripts/historical/alerts/flow/alert_types.json
Adding a new alerts view is as simple as placing one more JSON file within the same folder.
Here is an example JSON file for the Clients flow view.
{
   "name" : "Alert Type",
   "i18n_name" : "alert_types",
   "select" : {
      "items" : [
         {
            "name" : "alert_id"
         },
         {
            "name" : "count",
            "func" : "COUNT",
            "param" : "*",
            "value_type" : "number"
         }
      ]
   },
   "filters" : {
      "items" : [
         {
            "name" : "alert_id"
         }
      ]
   },
   "groupby" : {
      "items" : [
         {
            "name" : "alert_id"
         }
      ]
   },
   "sortby" : {
      "items" : [
         {
            "name" : "count",
            "order" : "DESC"
         }
      ]
   }
}
The JSON format is self-explanatory. It is possible to define the columns to be shown under the select tree, the columns on which the group-by is applied under the groupby tree, and the default column on which sorting is applied under the sortby tree. Aggregation functions can also be defined, such as the ‘count’ item, which is used in the example to display the number of alerts for each 3-tuple. For more complicated examples, it is recommended to take a look at the built-in query definitions available in the same folders.
The complete list of columns is available in the database schema located at /usr/share/ntopng/httpdocs/misc/alert_store_schema.sql