Historical Flow Explorer
Warning
MySQL flow explorer is deprecated and it has ben discontinued in favor of the ClickHouse (Flow Dump) flows explorer. ClickHouse support is not available on Windows and embedded architectures.
When ClickHouse is enabled, an historical flows explorer becomes available in the ntopng web GUI. This page is used to navigate through the flows seen and stored by ntopng.
Note
ClickHouse support including the Historical Flows Explorer is only available in ntopng Enterprise M or above.
The explorer is available from the left sidebar, under the Flows section.
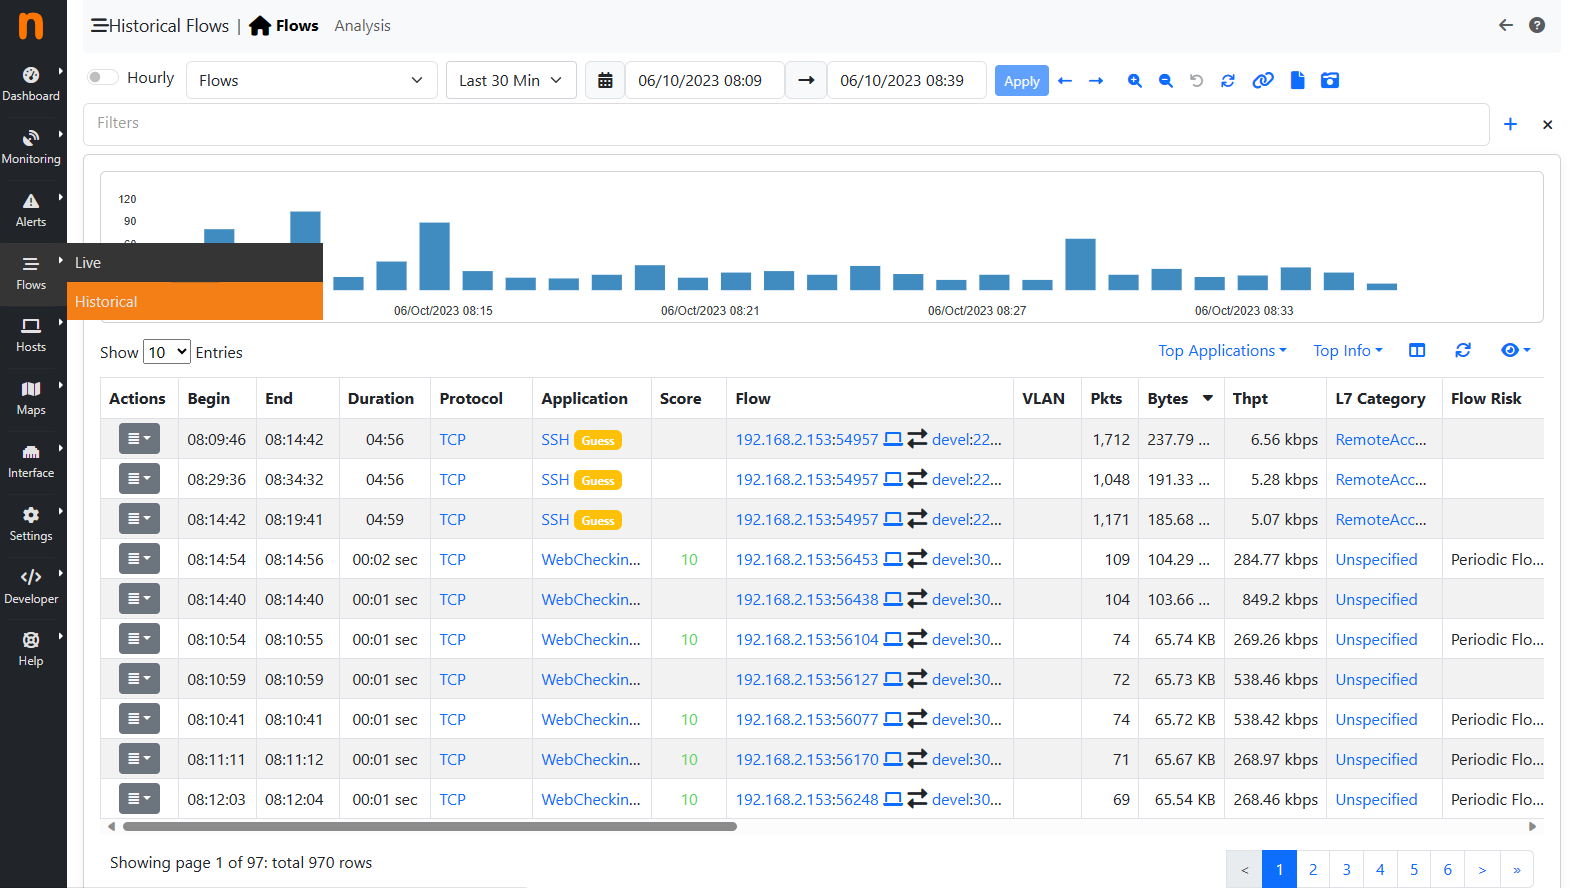
Historical Flows Explorer
It is possible, as for the Alerts Page, to navigate through the flows by filtering the results. Multiple filters are available by clicking the various results (e.g. The host develv5, to investigate its activities) or by clicking the + symbol in the right upper part of the GUI and selecting the wanted filter.
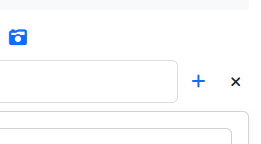
Filtering
It is possible to navigate through the time by adjusting the Date and Time using the Navigation Menu or by dragging the time from the chart.
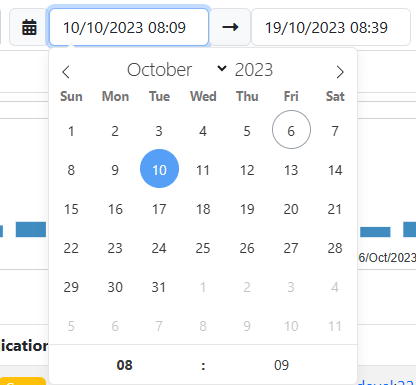
Navigation Menu
Not all the fields are shown by default into the records, to show/hide them click the eye below the chart and select the wanted information.
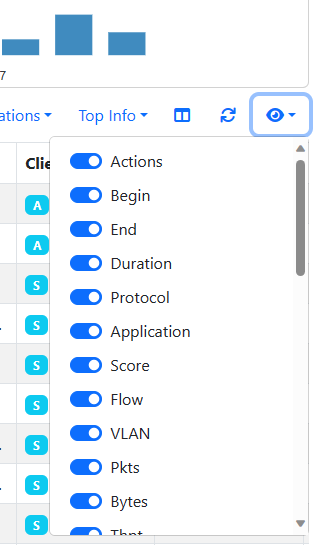
Show/Hide Records Info
Other actions are possible by clicking the Action button (left most side of the records). For example the Info action redirects the user to a new page with detailed information regarding the flow.

Flow Example
Historical flows data can be also accessed from the Historical Charts .

Enabling Flow Dump
ntopng can dump flows data to a persistent storage and provides view to browse recorded flows data in the past. Check out the Flows Dump documentation for more details on how to setup the connection and the historical views available for this mode.
In order to dump flows to disk ntopng requires the -F clickhouse option to be specified as described in the Flows Dump documentation.
Custom Queries
In order to analyze historical flows dumped by ntopng on ClickHouse, it is possible to use the use additional flows views, with custom queries that can aggregate the data according to some criteria, or manipulate the data in any way allowed by SQL.
The default flows view in the Historical Flows Explorer is “Flows”, which shows the full list of raw flows.
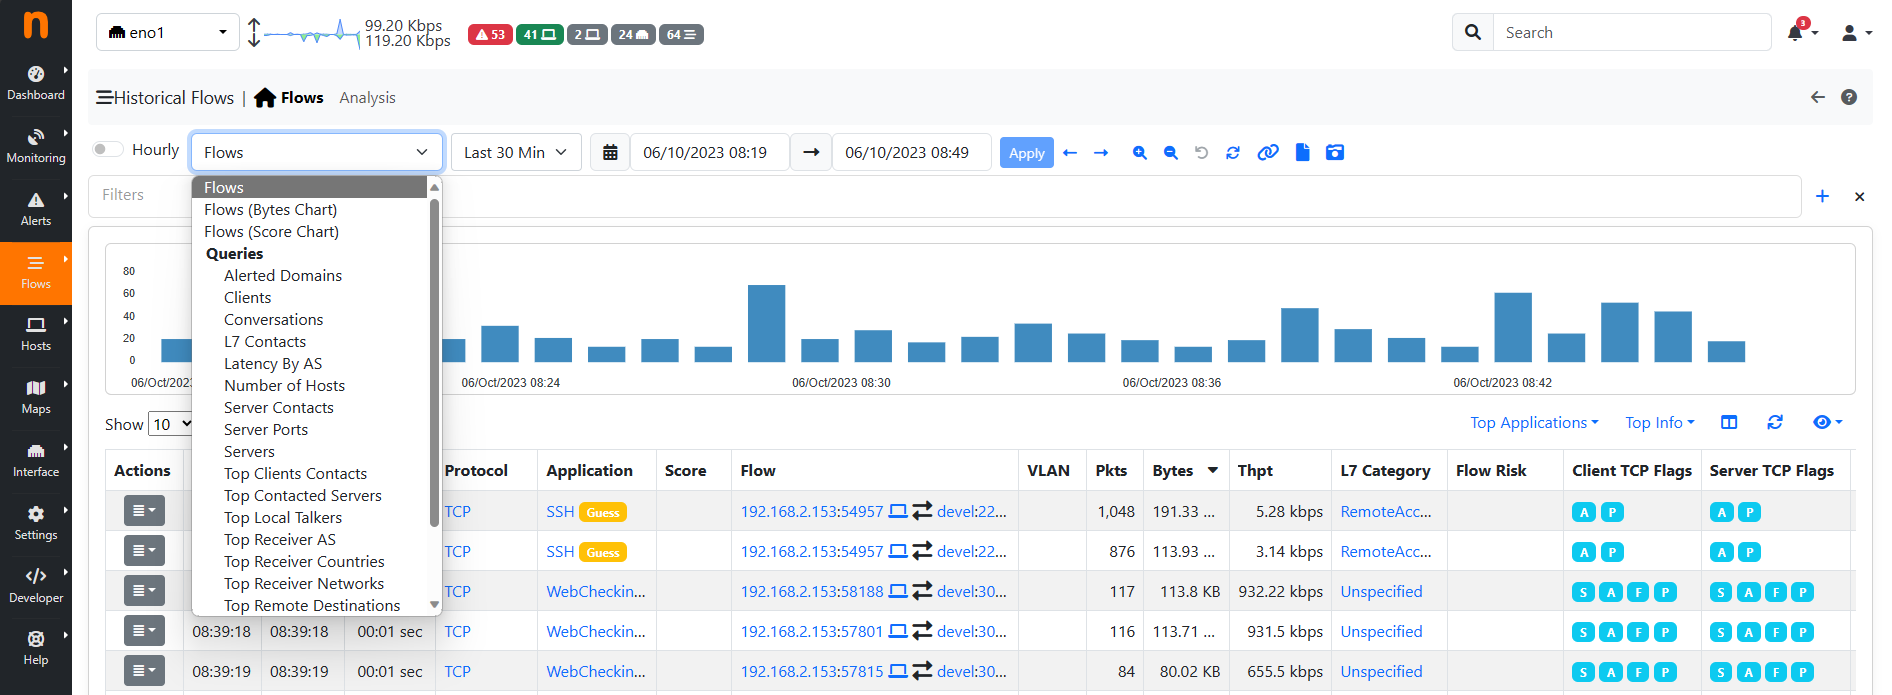
In addition to the raw “Flows”, additional built-in views are available, which are built on top of the Custom Queries engine. Here is an overview of the currently available flows views:
- Flows (Bytes Chart): Displays the flows view with a bytes chart
- Flows (Score Chart): Displays the flows view with a score chart
- Alerted Domains: Shows the count of alerted domains
- Clients: Displays the top hosts as flow clients and their traffic
- Conversations: Shows the top conversations <client, server> with the highest number of flows and total traffic
- L7 Contacts: L7 Contacts: Displays the top <client, server, L7 protocol> pairs and their total traffic
- Latency By AS: Displays the average latency of source and destination Autonomous Systems
- Number of Hosts: Shows the number of IPv4 Clients, IPv4 Servers, IPv6 Clients, and IPv6 Servers
- Server Contacts: Displays servers ordered by the number of connections
- Server Ports: Shows the count of used destination ports
- Servers: Displays the top hosts as flow servers and their traffic
- Top Clients Contacts: Shows the clients that contact the highest number of different servers
- Top Contacted Servers: Shows the servers contacted by the highest number of different clients
- Top Local Talkers: Displays the top local hosts with the most traffic
- Top Receiver AS: Displays the top Autonomous Systems with the most received traffic
- Top Receiver Countries: Displays the top countries with the most received traffic
- Top Receiver Networks: Displays the top networks with the most received traffic
- Top Remote Destinations: Displays the top remote destinations with the most traffic
- Top Sender AS: Displays the top Autonomous Systems with the most sent traffic
- Top Sender Countries: Displays the top countries with the most sent traffic
- Top Sender Networks: Displays the top networks with the most sent traffic
- Visited Sites: Shows the most visited domains
- Major Connection State: Displays TCP Major Connection State (ATTEMPTED, ESTABLISHED, CLOSED)
- Minor Connection State: Displays TCP Major and Minor Connection State
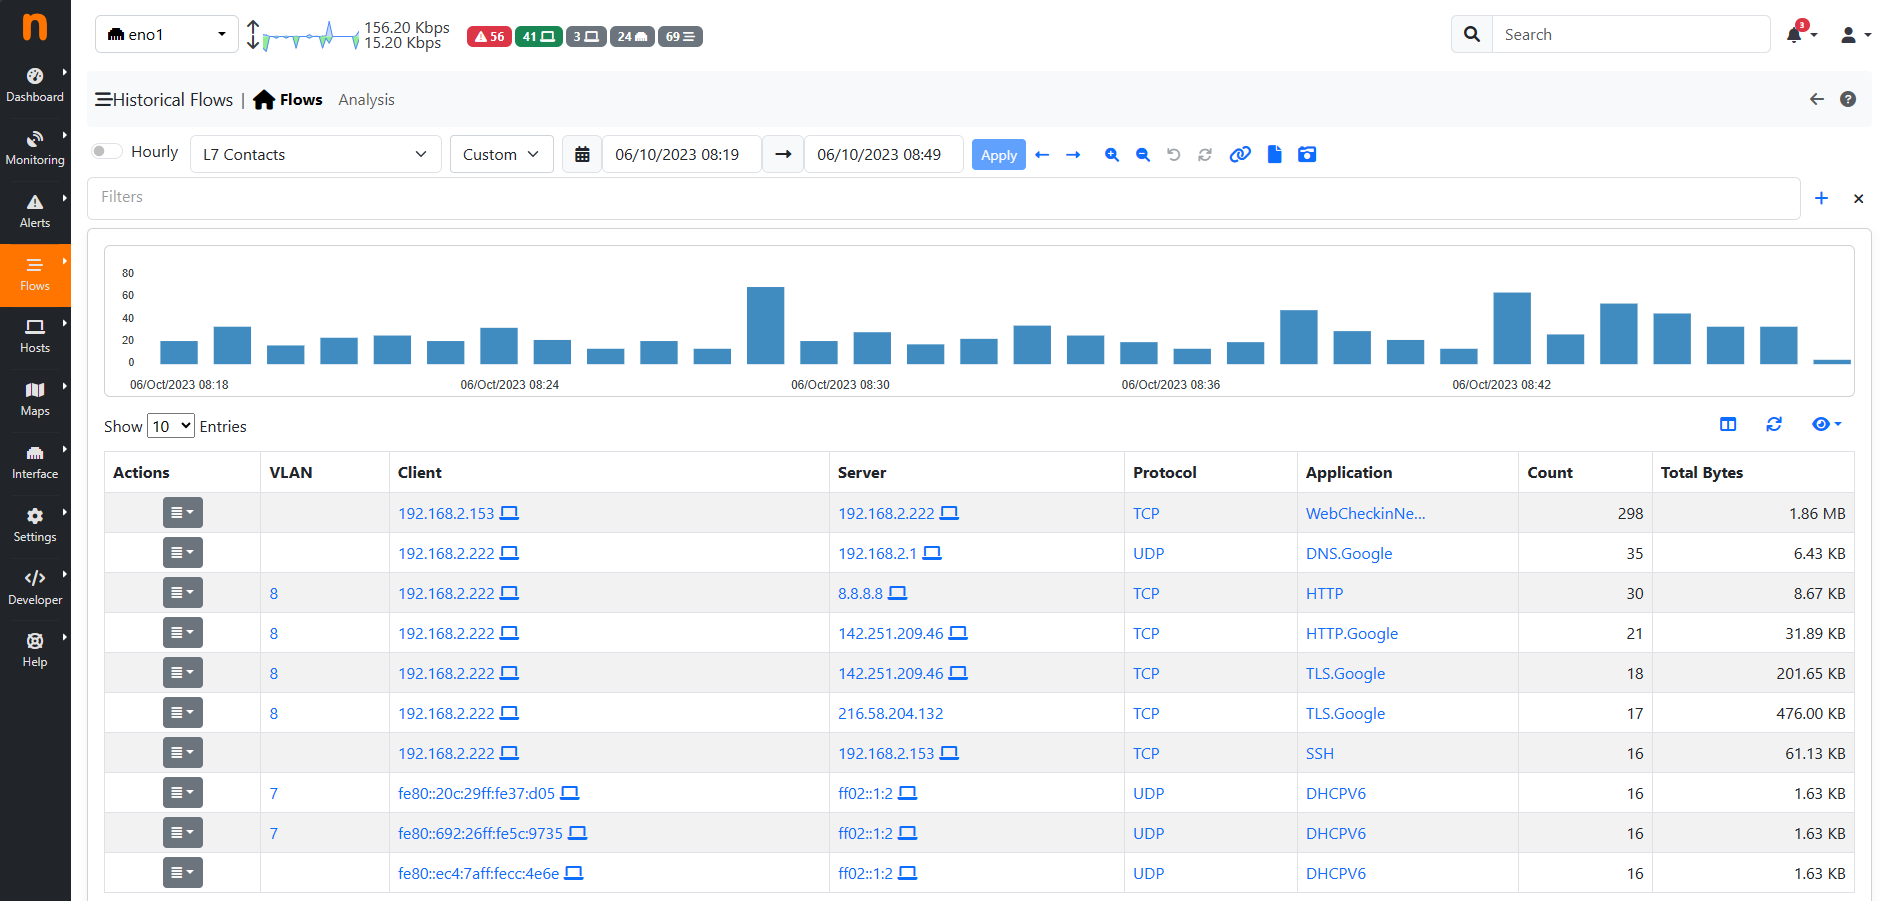
Top L7 Contacts Table
The above built-in Custom Queries can be extended by the user by creating simple JSON files containing the query description. The query definitions corresponding to the above built-in queries are available on the filesystem as JSON files under /usr/share/ntopng/scripts/historical/tables/*.json. Adding a new flow view is as simple as placing one more JSON file within the same folder.
Here is an example JSON file for the Clients flow view.
{
  "name" : "Clients",
  "i18n_name" : "clients",
  "data_source" : "flows",
  "show_in_page" : "overview",
  "hourly": true,
  "visualization_type" : "table",
  "select" : {
    "items" : [
      {
        "name" : "VLAN_ID"
      },
      {
        "name" : "IPV4_SRC_ADDR"
      },
      {
        "name" : "IPV6_SRC_ADDR"
      },
      {
        "name" : "SRC_LABEL"
      },
      {
        "name" : "SRC_COUNTRY_CODE"
      },
      {
        "name" : "total_bytes",
        "func" : "SUM",
        "param" : "TOTAL_BYTES",
        "value_type" : "bytes"
      }
    ]
  },
  "filters" : {
    "items" : [
      {
        "name": "PROBE_IP"
      },
      {
        "name": "INPUT_SNMP"
      },
      {
        "name": "OUTPUT_SNMP"
      }
    ]
  },
  "groupby" : {
    "items" : [
      {
        "name" : "VLAN_ID"
      },
      {
        "name" : "IPV4_SRC_ADDR"
      },
      {
        "name" : "IPV6_SRC_ADDR"
      },
      {
        "name" : "SRC_LABEL"
      },
      {
        "name" : "SRC_COUNTRY_CODE"
      }
    ]
  },
  "sortby" : {
    "items" : [
      {
        "name" : "total_bytes",
        "order" : "DESC"
      }
    ]
  }
}
The JSON format is self-explanatory. It is possible to define the columns to be shown under the select tree, the columns on which the group-by is applied under the groupby tree, and the default column on which sorting is applied under the sortby tree. Aggregation functions can also be defined, such as the ‘sum’ item in the example. For more complicated examples, it is recommended to take a look at the built-in query definitions available in the same folders.
The complete list of columns is available in the database schema located at /usr/share/ntopng/httpdocs/misc/db_schema_clickhouse.sql
Historical Flows Explorer Analysis
Similar to Custom Queries, this page enables the users to create and display their own charts for analysing the traffic on the database. To access it, click the Analysis entry next to the Home icon in the navigation menu.
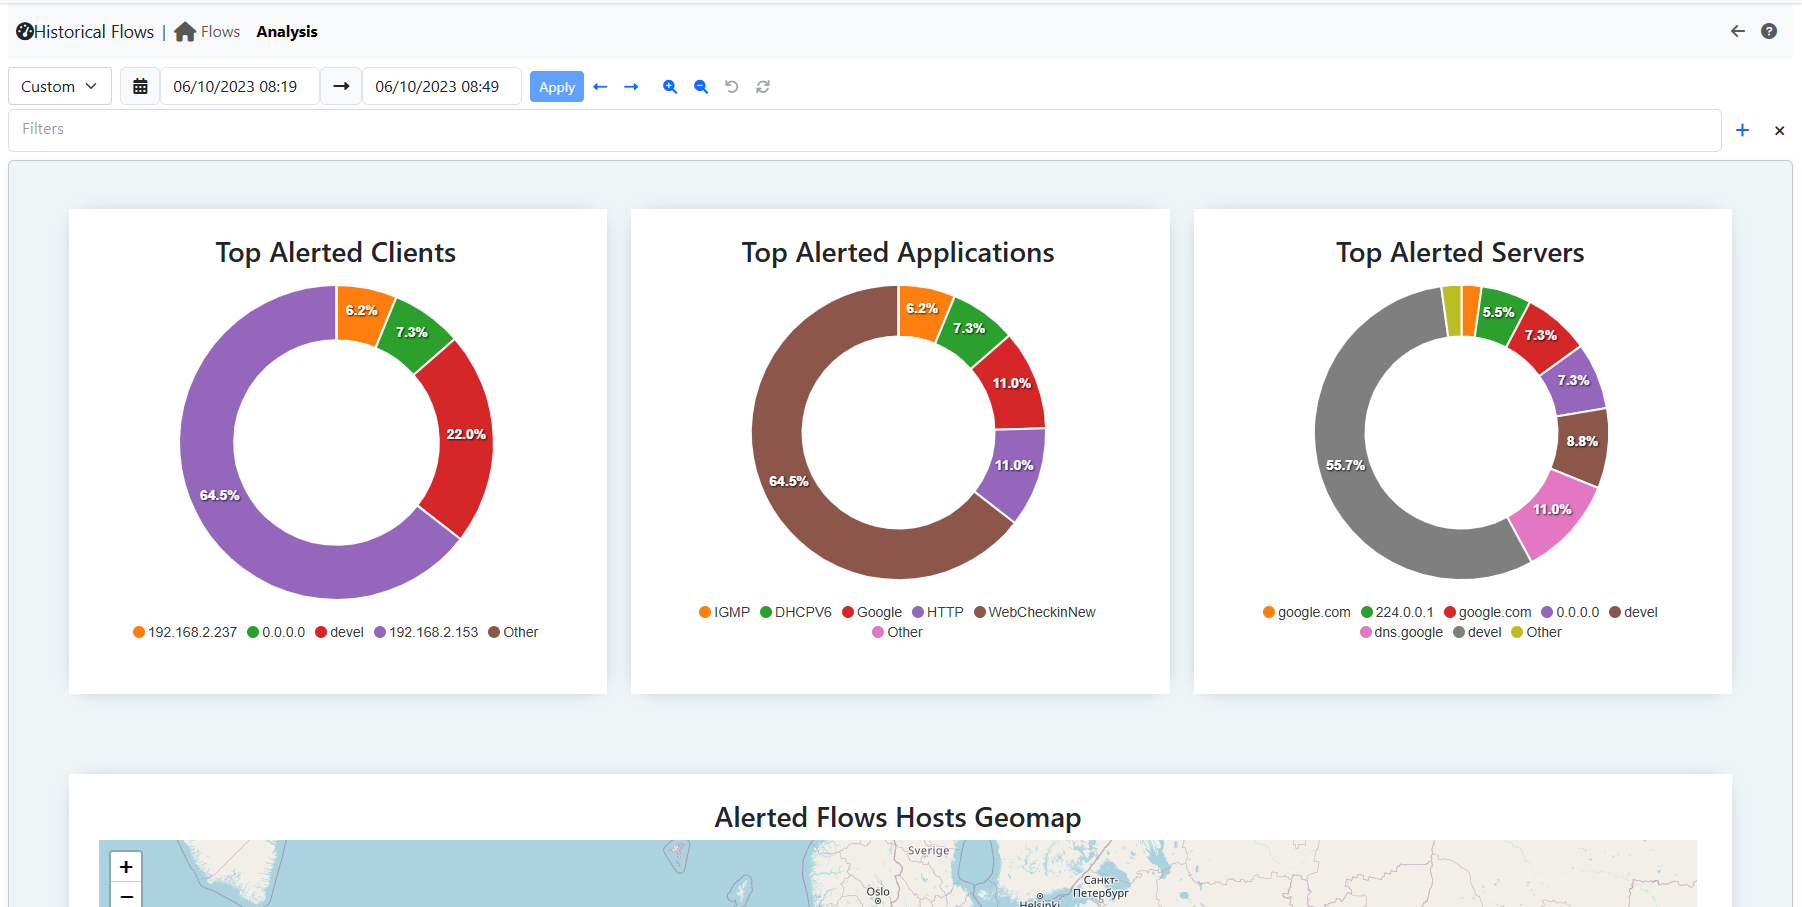
Historical Flows Explorer Analysis
As for the Table view, users can switch between graphs by using the navigation menu and filter results. The characteristic of this page is that users can write their own charts, by writing a json file. Each JSON is a different entry of the navigation menu. These JSON files needs to be added into /usr/share/ntopng/scripts/historical/analysis/ directory. They are formatted as follows:
{
   "name" : "Autonomous Systems",          /* Name of the Navigation Menu Entry */

   "i18n_name" : "top_asn",                /* Same as above, but this name needs to be added into the localization file */

   "data_source" : "flows",                /* Which table are users looking at (Alwais use flows) */

   "show_in_page" : "analysis",            /* In which page the entry is going to be shown, Table (`analysis`) view or Analysis (`analysis`) view*/

   "chart" : [{                            /* An array of charts, each entry is going to be a different chart shown in the GUI */
      "chart_id" : "top_src_asn",          /* An ID of the chart. NB: each ID must be different */

      "chart_name" : "Top Src ASN",        /* Chart name, same as above */

      "chart_i18n_name" : "top_src_asn",   /* Chart name, same as above */

      "chart_css_styles" : {               /* Optional Feature: CSS chart styles */
            "max-height" : "25rem",
            "min-height" : "25rem",
      },

      "chart_endpoint" : "/lua/rest/v2/get/db/charts/default_rest.lua", /* Endpoint of the chart. By default use this one, change it if particular data are requested and format it as the user like */

      "chart_events" : {                                                /* Optional Feature: chart events on click of the value. Use this value by default. */
            "dataPointSelection" : "db_analyze"
      },

      "chart_gui_filter" : "srv_asn",                                   /* Optional Feature: Applied filtering on click of the chart data */

      "chart_sql_query" : "SELECT SRC_ASN,any(IPv4NumToString(IPV4_SRC_ADDR)) as IPV4_SRC_ADDR_FORMATTED,SUM(TOTAL_BYTES) /* MySQL query */
                           AS bytes FROM flows WHERE ($WHERE) GROUP BY SRC_ASN ORDER BY bytes DESC LIMIT 10",

      "chart_type" : "radar_apex_chart",                                /* Chart type to be displayed */

      "chart_record_value" : "bytes",                                   /* Record values (Use the data from the query) */

      "chart_record_label" : "SRC_ASN",                                 /* Record label (Use the data from the query) */

      "chart_width" : 6,                                                /* Optional Feature: Chart width, it must be an Integer between 1 and 12 */

      "chart_y_formatter" : "format_bytes",                             /* Optional Feature: JS tooltip event */
   }]
}
There are various charts available to be used (replace the chart_type entry with the required chart):
- Donut Chart, use the donut_apex_chart;
- Pie Chart, use the pie_apex_chart;
- Radar Chart, use the radar_apex_chart;
- Polar Area Chart, use the polararea_apex_chart;
- Radial Bar Chart, use the radialbar_apex_chart;
- Bar Chart, use the bar_apex_chart;
- Heatmap Chart, use the heatmap_apex_chart;
- Treemap Chart, use the treemap_apex_chart;
- Timeline Chart, use the timeline_apex_chart;
- Bubble Chart, use the bubble_apex_chart;
- Area Chart, use the area_apex_chart;
Regarding the Formatting Optional Feature (chart_y_formatter) there are different build-in formatters to be used:
- format_pkts, used to format packets data;
- format_value, used to format generic data (e.g. number of flows);
- format_bytes, used to format bytes data;
If a user would like to have a particular chart with a customized endpoint then a specific endpoint needs to be used. Please contact us in that case and, if possible, we will release the requested chart.
Exporting Flows
By clicking on the ![]() icon, it’s possible to download a copy of
the raw flows in CSV format. Here is the same data shown in the picture above in
CSV format:
icon, it’s possible to download a copy of
the raw flows in CSV format. Here is the same data shown in the picture above in
CSV format:
L7_PROTO|IP_DST_PORT|FLOW_TIME|BYTES|FIRST_SEEN|LAST_SEEN|IP_SRC_PORT|NTOPNG_INSTANCE_NAME|IP_PROTOCOL_VERSION|IPV4_SRC_ADDR|JSON|PACKETS|IPV4_DST_ADDR|INTERFACE_ID|PROFILE|INFO|IPV6_DST_ADDR|VLAN_ID|PROTOCOL|IPV6_SRC_ADDR
143|443|1544712866|18262|1544712646|1544712866|32886|PC local|4|192.168.1.6||53|17.248.146.148|1|ssl|feedbackws.icloud.com|::|0|6|::
143|443|1544712876|13958|1544712749|1544712876|34078|PC local|4|192.168.1.6||46|17.248.146.148|1|ssl|p66-iwmb0.icloud.com|::|0|6|::
143|443|1544718548|203978|1544718247|1544718548|38928|PC local|4|192.168.1.6||431|17.248.146.148|1|ssl|p66-ckdatabasews.icloud.com|::|0|6|::
143|443|1544718821|175770|1544718548|1544718821|38928|PC local|4|192.168.1.6||370|17.248.146.148|1|ssl|p66-ckdatabasews.icloud.com|::|0|6|::
143|443|1544723738|14663|1544723557|1544723738|49328|PC local|4|192.168.1.6||45|17.248.146.148|1|ssl|p66-pushws.icloud.com|::|0|6|::
Data Retention
The retention of the flows dump on disk can be configured from the Data Retention preferences setting.
Hourly Historical Flows
Note
The Hourly Historical Flows view is exclusive to ntopng Enterprise XL.
Enabling the ‘Hourly’ flag on the Historical Flow Explorer in ntopng displays an aggregated view of the historical flows.
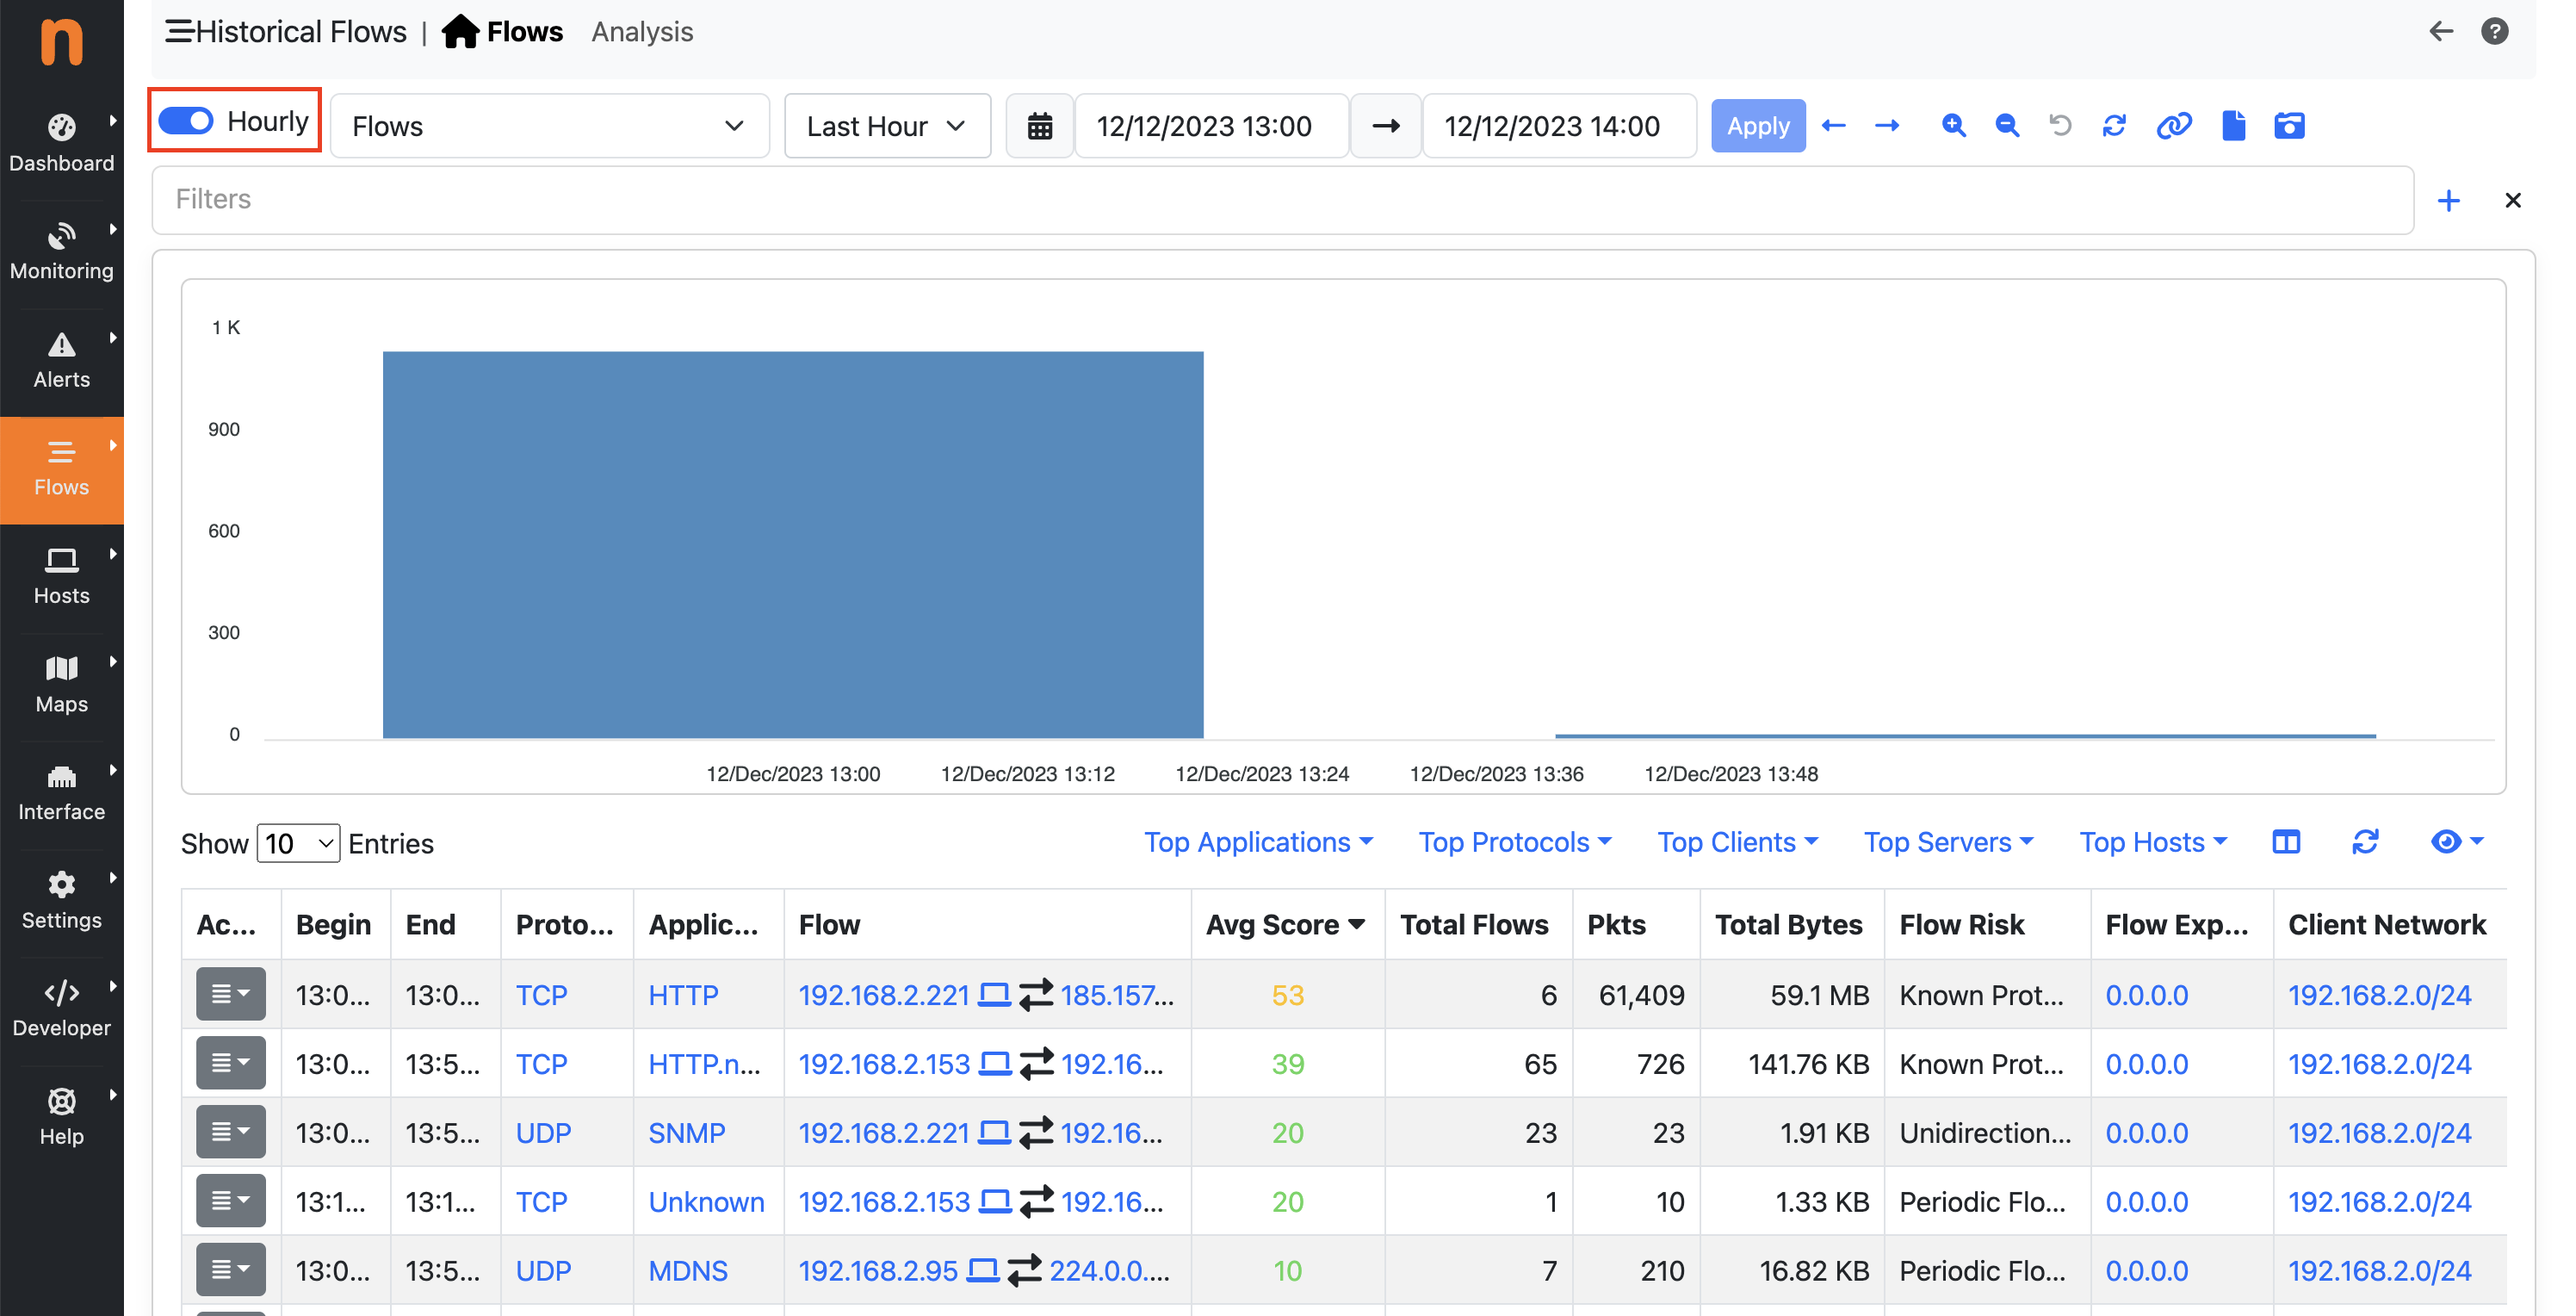
Hourly Historical Flows Explorer
The historical flows are aggregated by several fields, including:
- Begin (Start epoch of the flows)
- End (End epoch of the flows)
- Protocol (L4 Protocol)
- Application (L7 Protocol)
- Flow (Client IP - Client Port - Server IP - Server Port)
- Avg Score (The average score of the aggregated raw flows)
- Total Flows (The total number of aggregated flows in the single entry)
- Pkts (The total number of packets in the aggregated flows in the single entry)
- Total Bytes (The sum of TX and RX traffic of the aggregated flows in the single entry)
- Client ASN (Autonomous System Number assigned to the client)
- Server ASN (Autonomous System Number assigned to the server)
- Flow Risk (Level of risk associated with flow)
- Flow Exporter (System or tool exporting flow data)
- Client Network (Network associated with the client)
- Server Network (Network associated with the server)
- In SNMP iface (Input SNMP interface)
- Out SNMP iface (Output SNMP interface)
- Client Country (Country associated with the client)
- Server Country (Country associated with the server)
- Client MAC (MAC Address of the client)
- Server MAC (MAC Address of the server)
- ntopng Instance Name
With Hourly Historical Flows, it is possible to better analyze past traffic by providing a summary of historical flows.
Clicking on the ‘Flows’ entry in the ‘Actions’ menu of a specific hourly historical flow entry allows the user to navigate back to the Historical Flows, filtered by client IP, server IP, server port, flow exporter, and ntopng instance name.
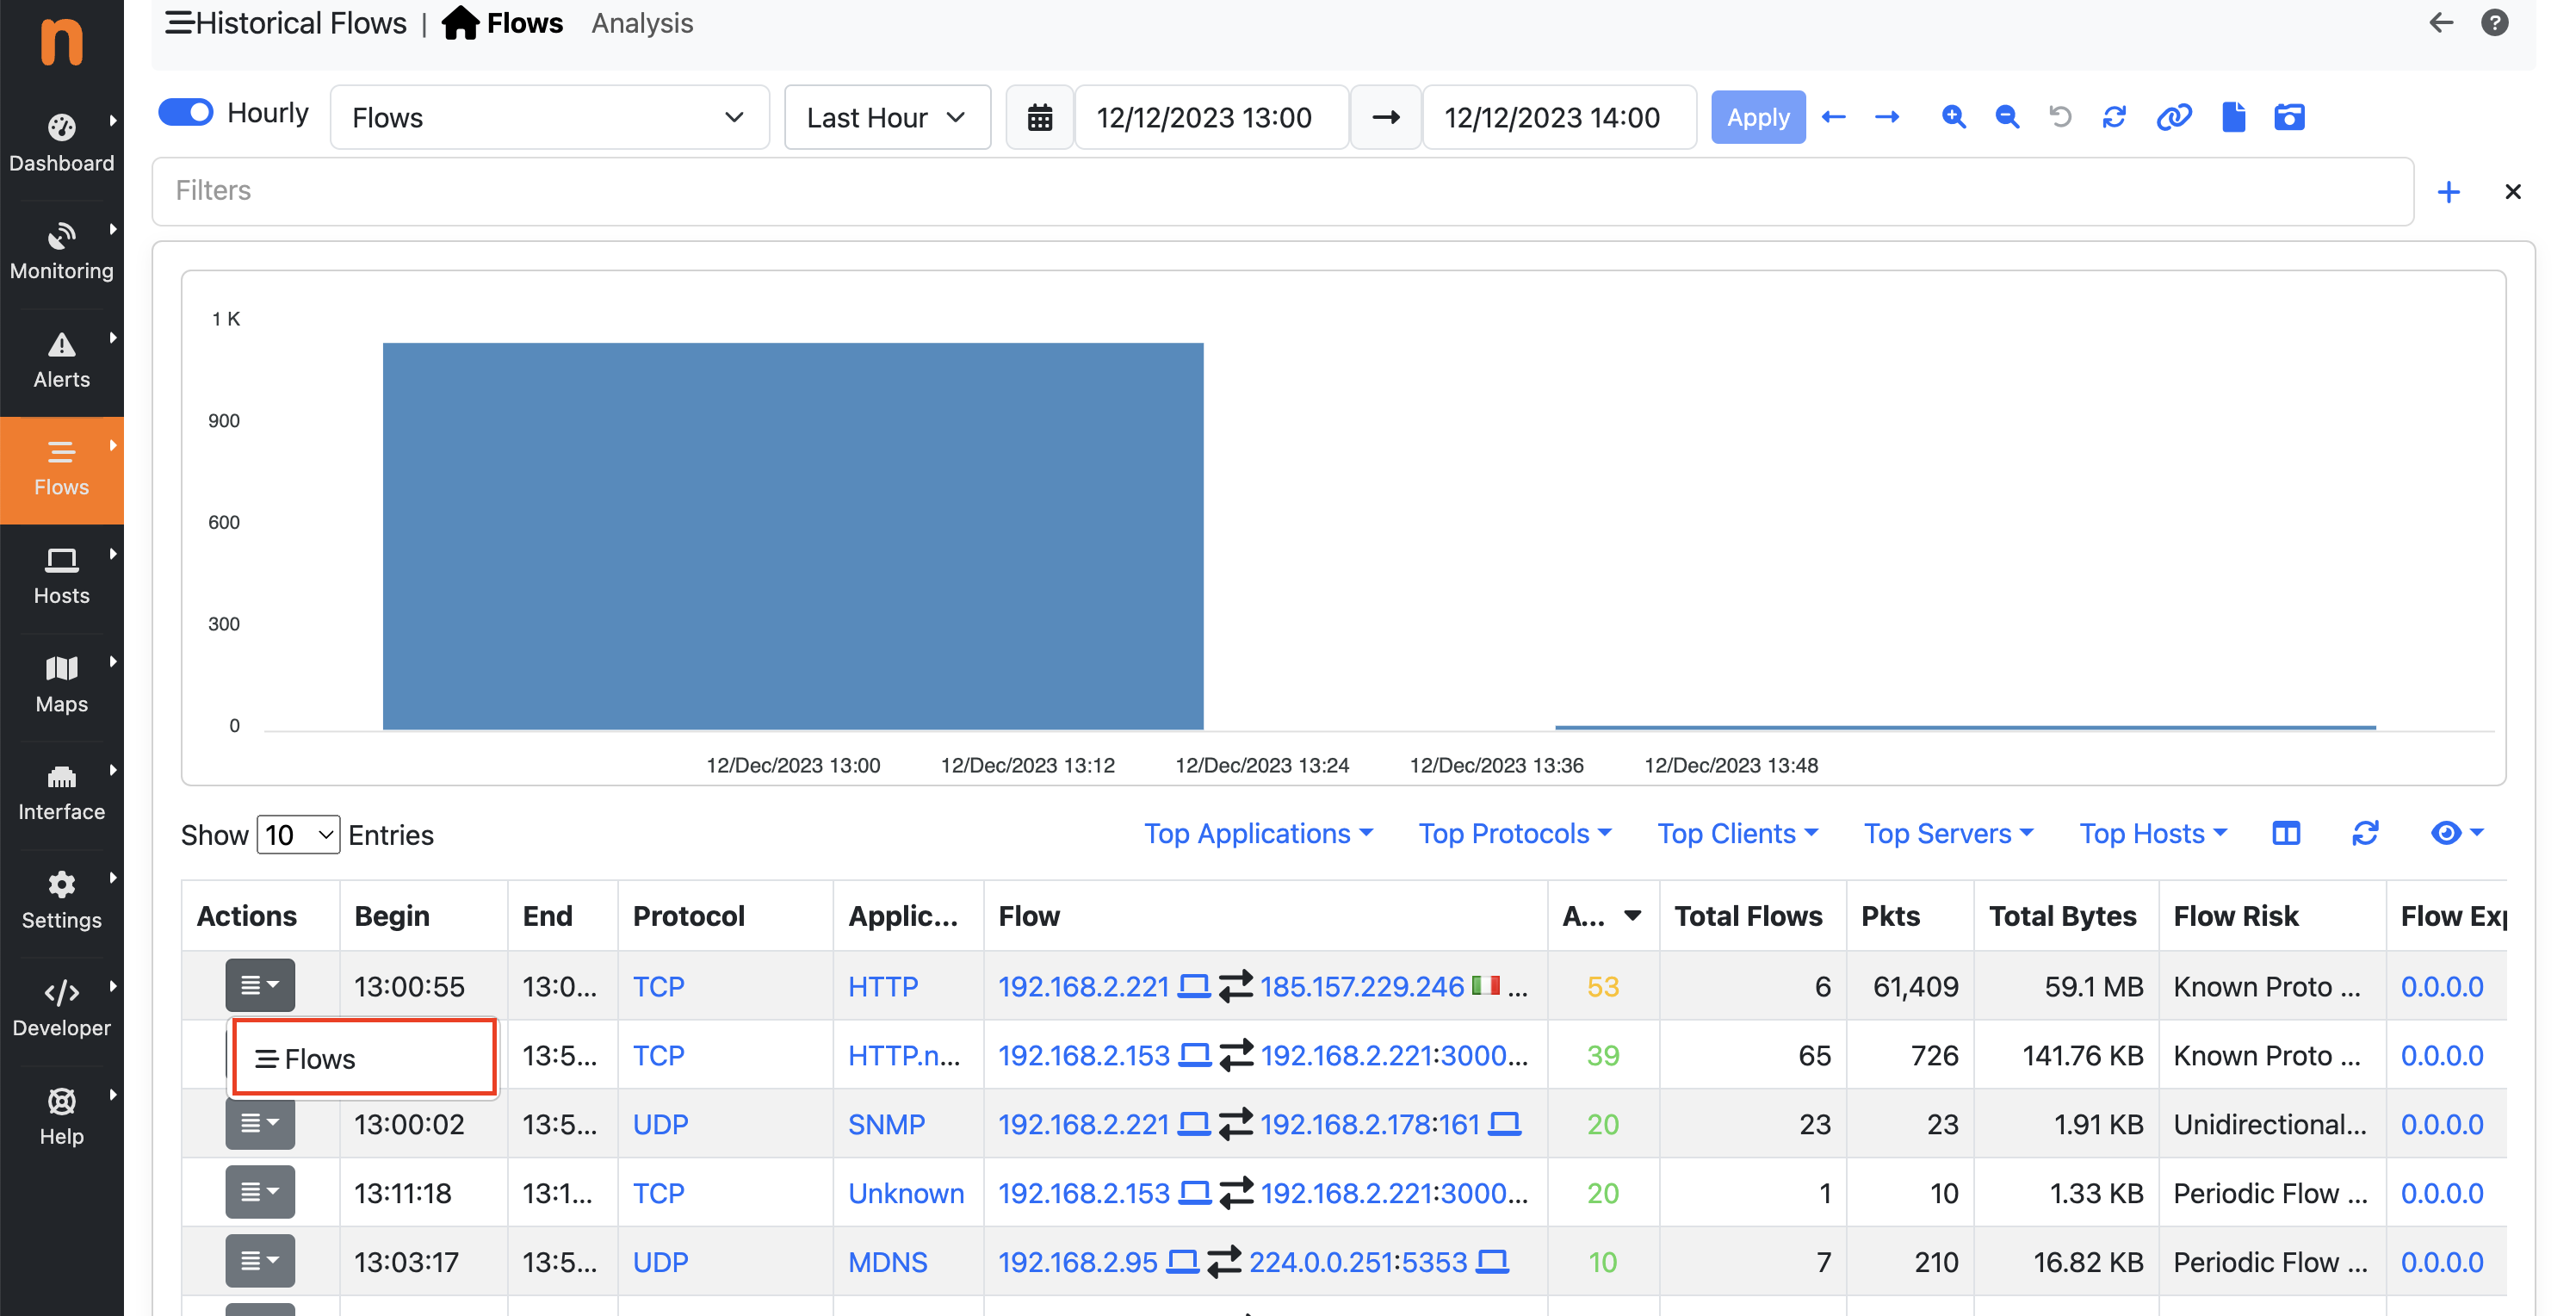
Hourly Historical Flows - Flows button
This displays the flows that compose the single entry of the hourly historical flows.
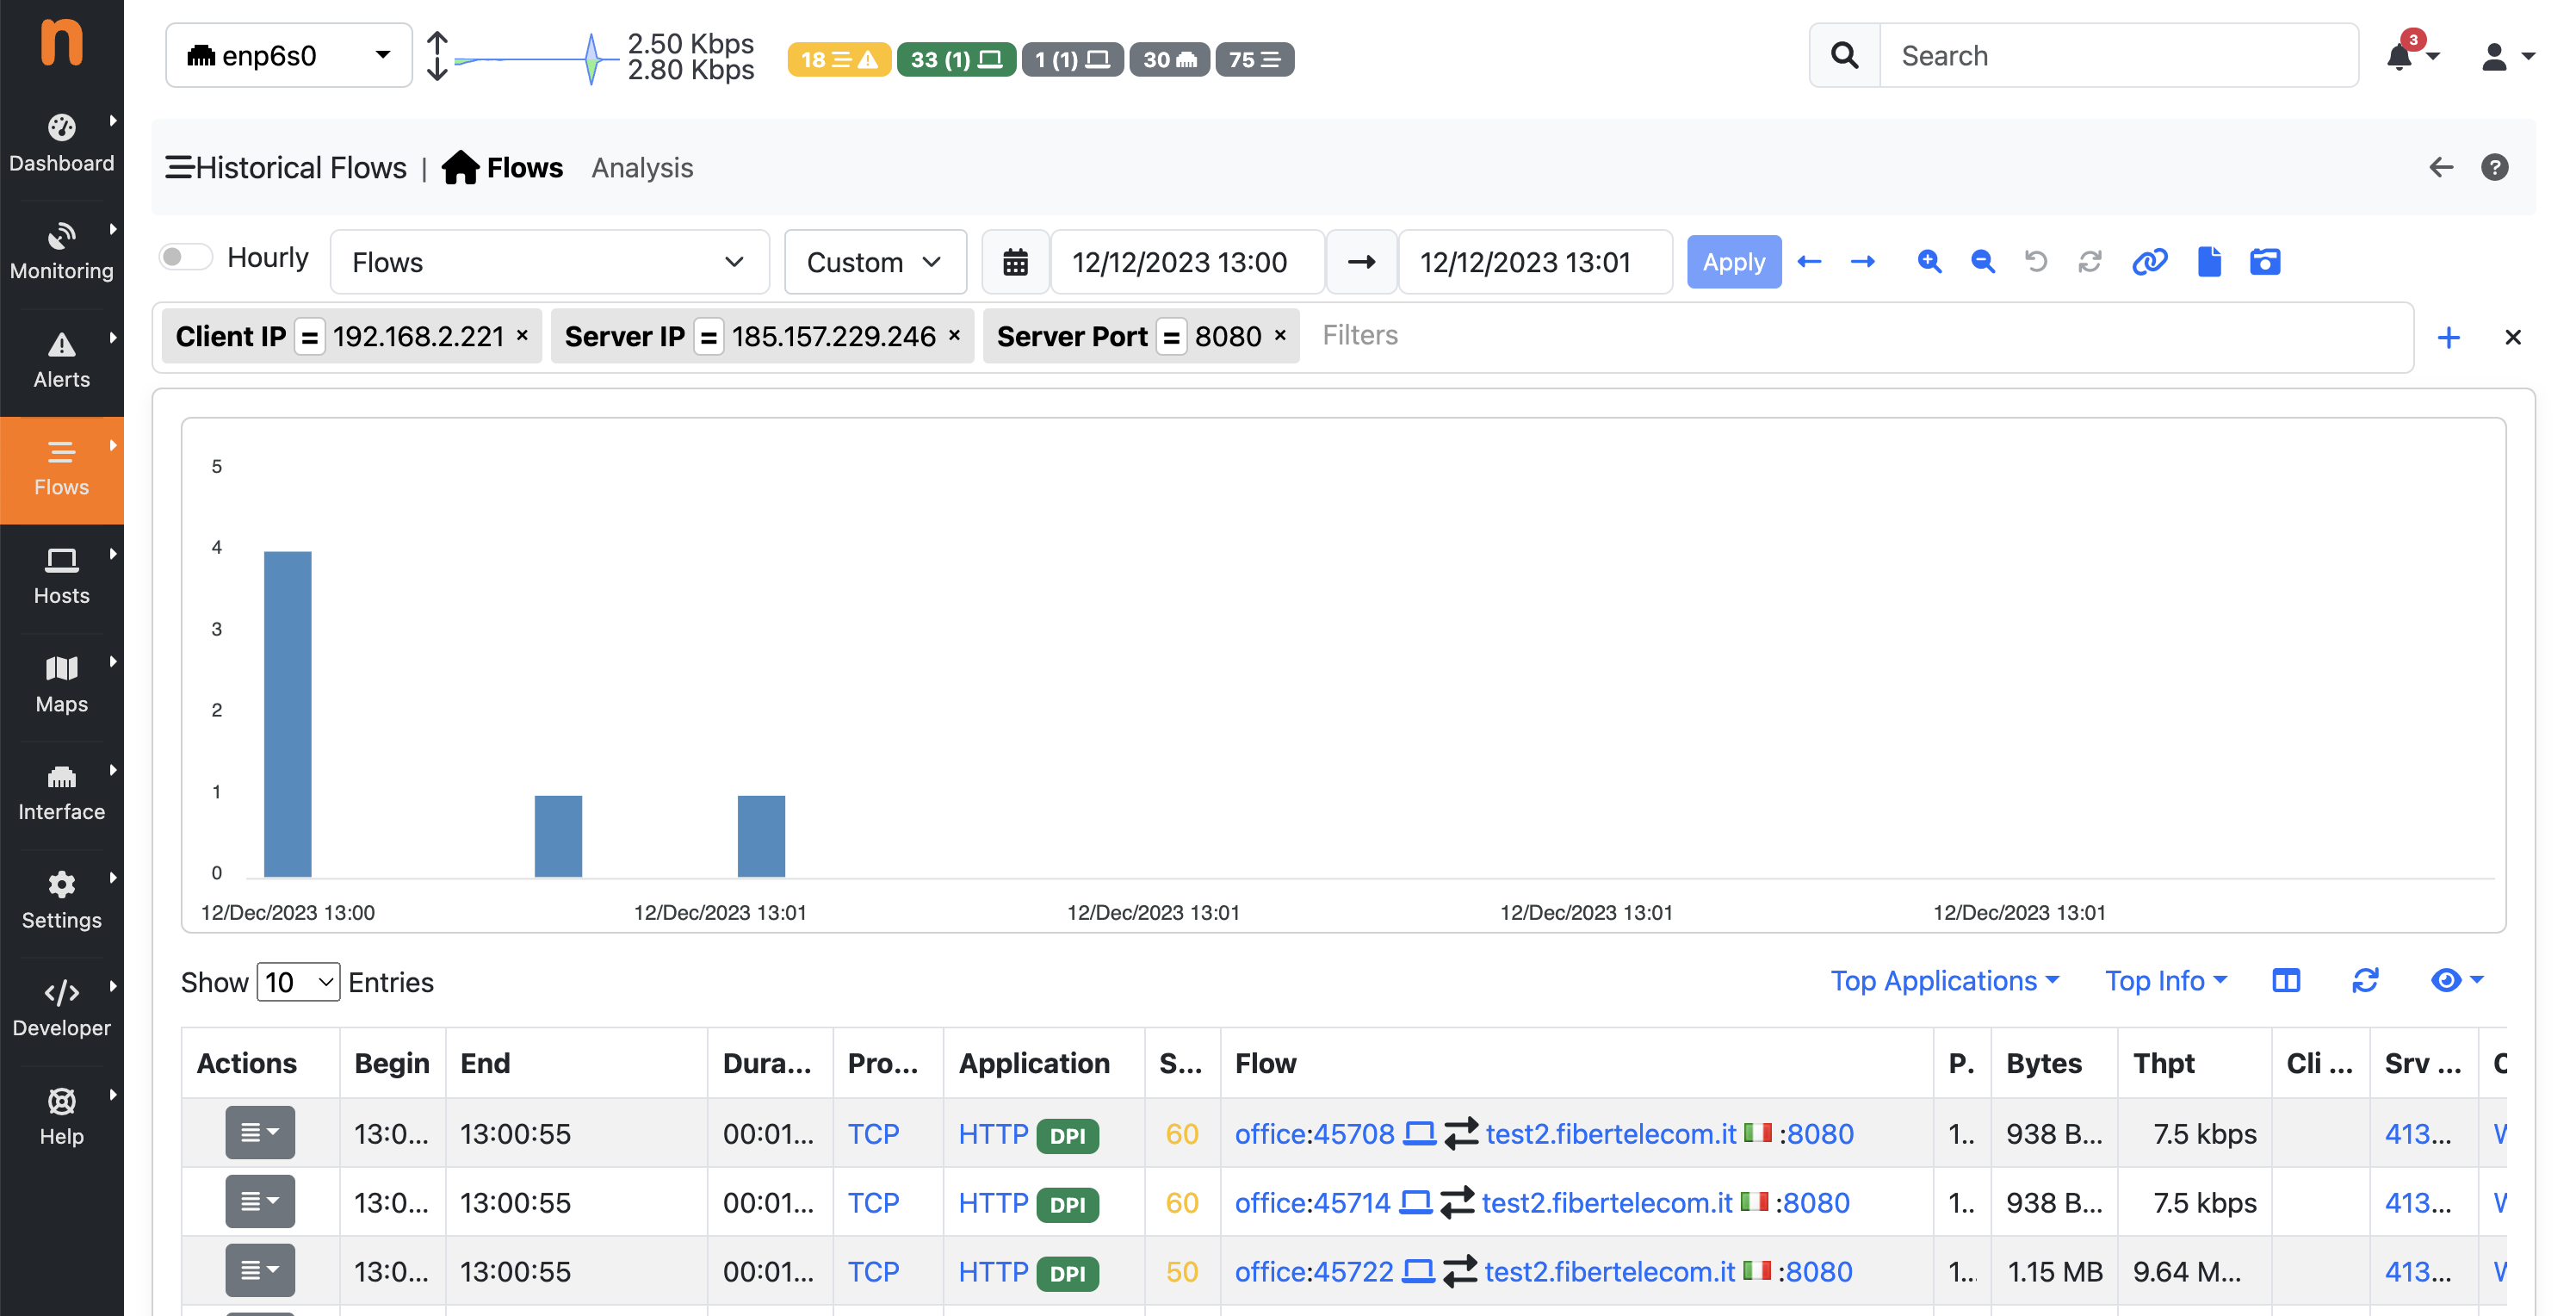
Historical Flows Filtered
On the Hourly Historical Flows Explorer, many ‘Top Filters’ are present, including:
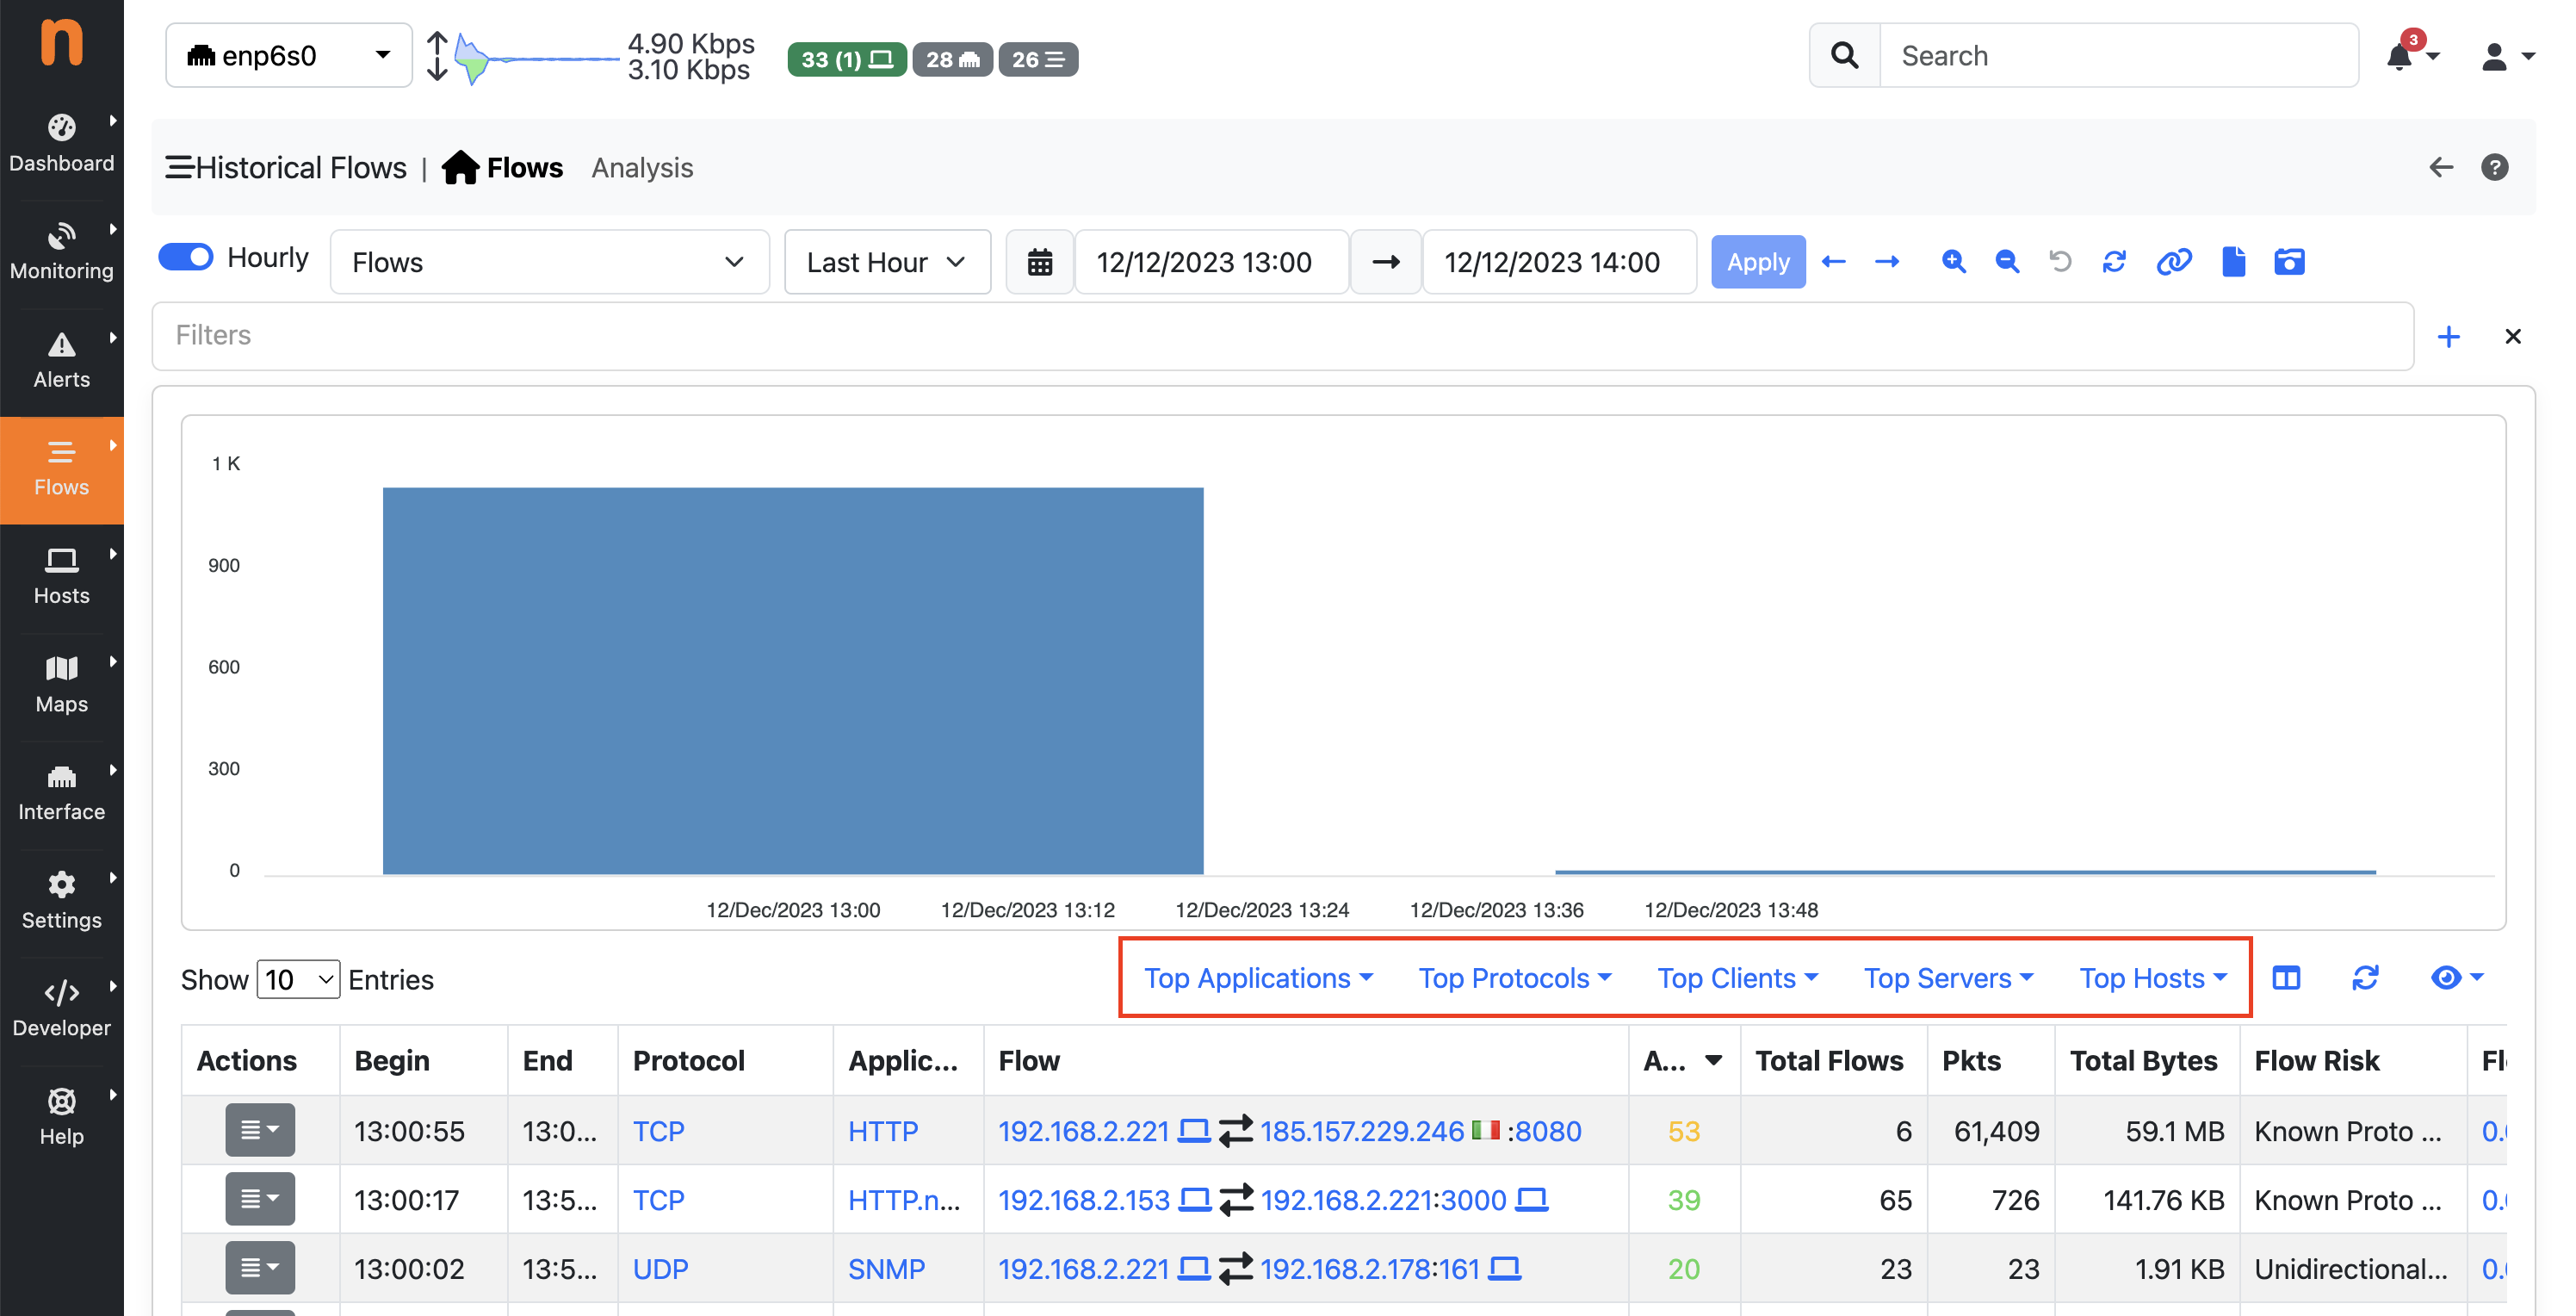
Hourly Historical Flows Filters
- Top Applications (L7 Protocols with most traffic)
- Top Protocols (L4 Protocols with most traffic)
- Top Clients (Clients with most traffic)
- Top Servers (Servers with most traffic)
- Top Hosts (Hosts with most traffic)
Aggregation Preferences
On the preferences page, in the ClickHouse tab, it is possible to modify the hourly flows aggregation settings.
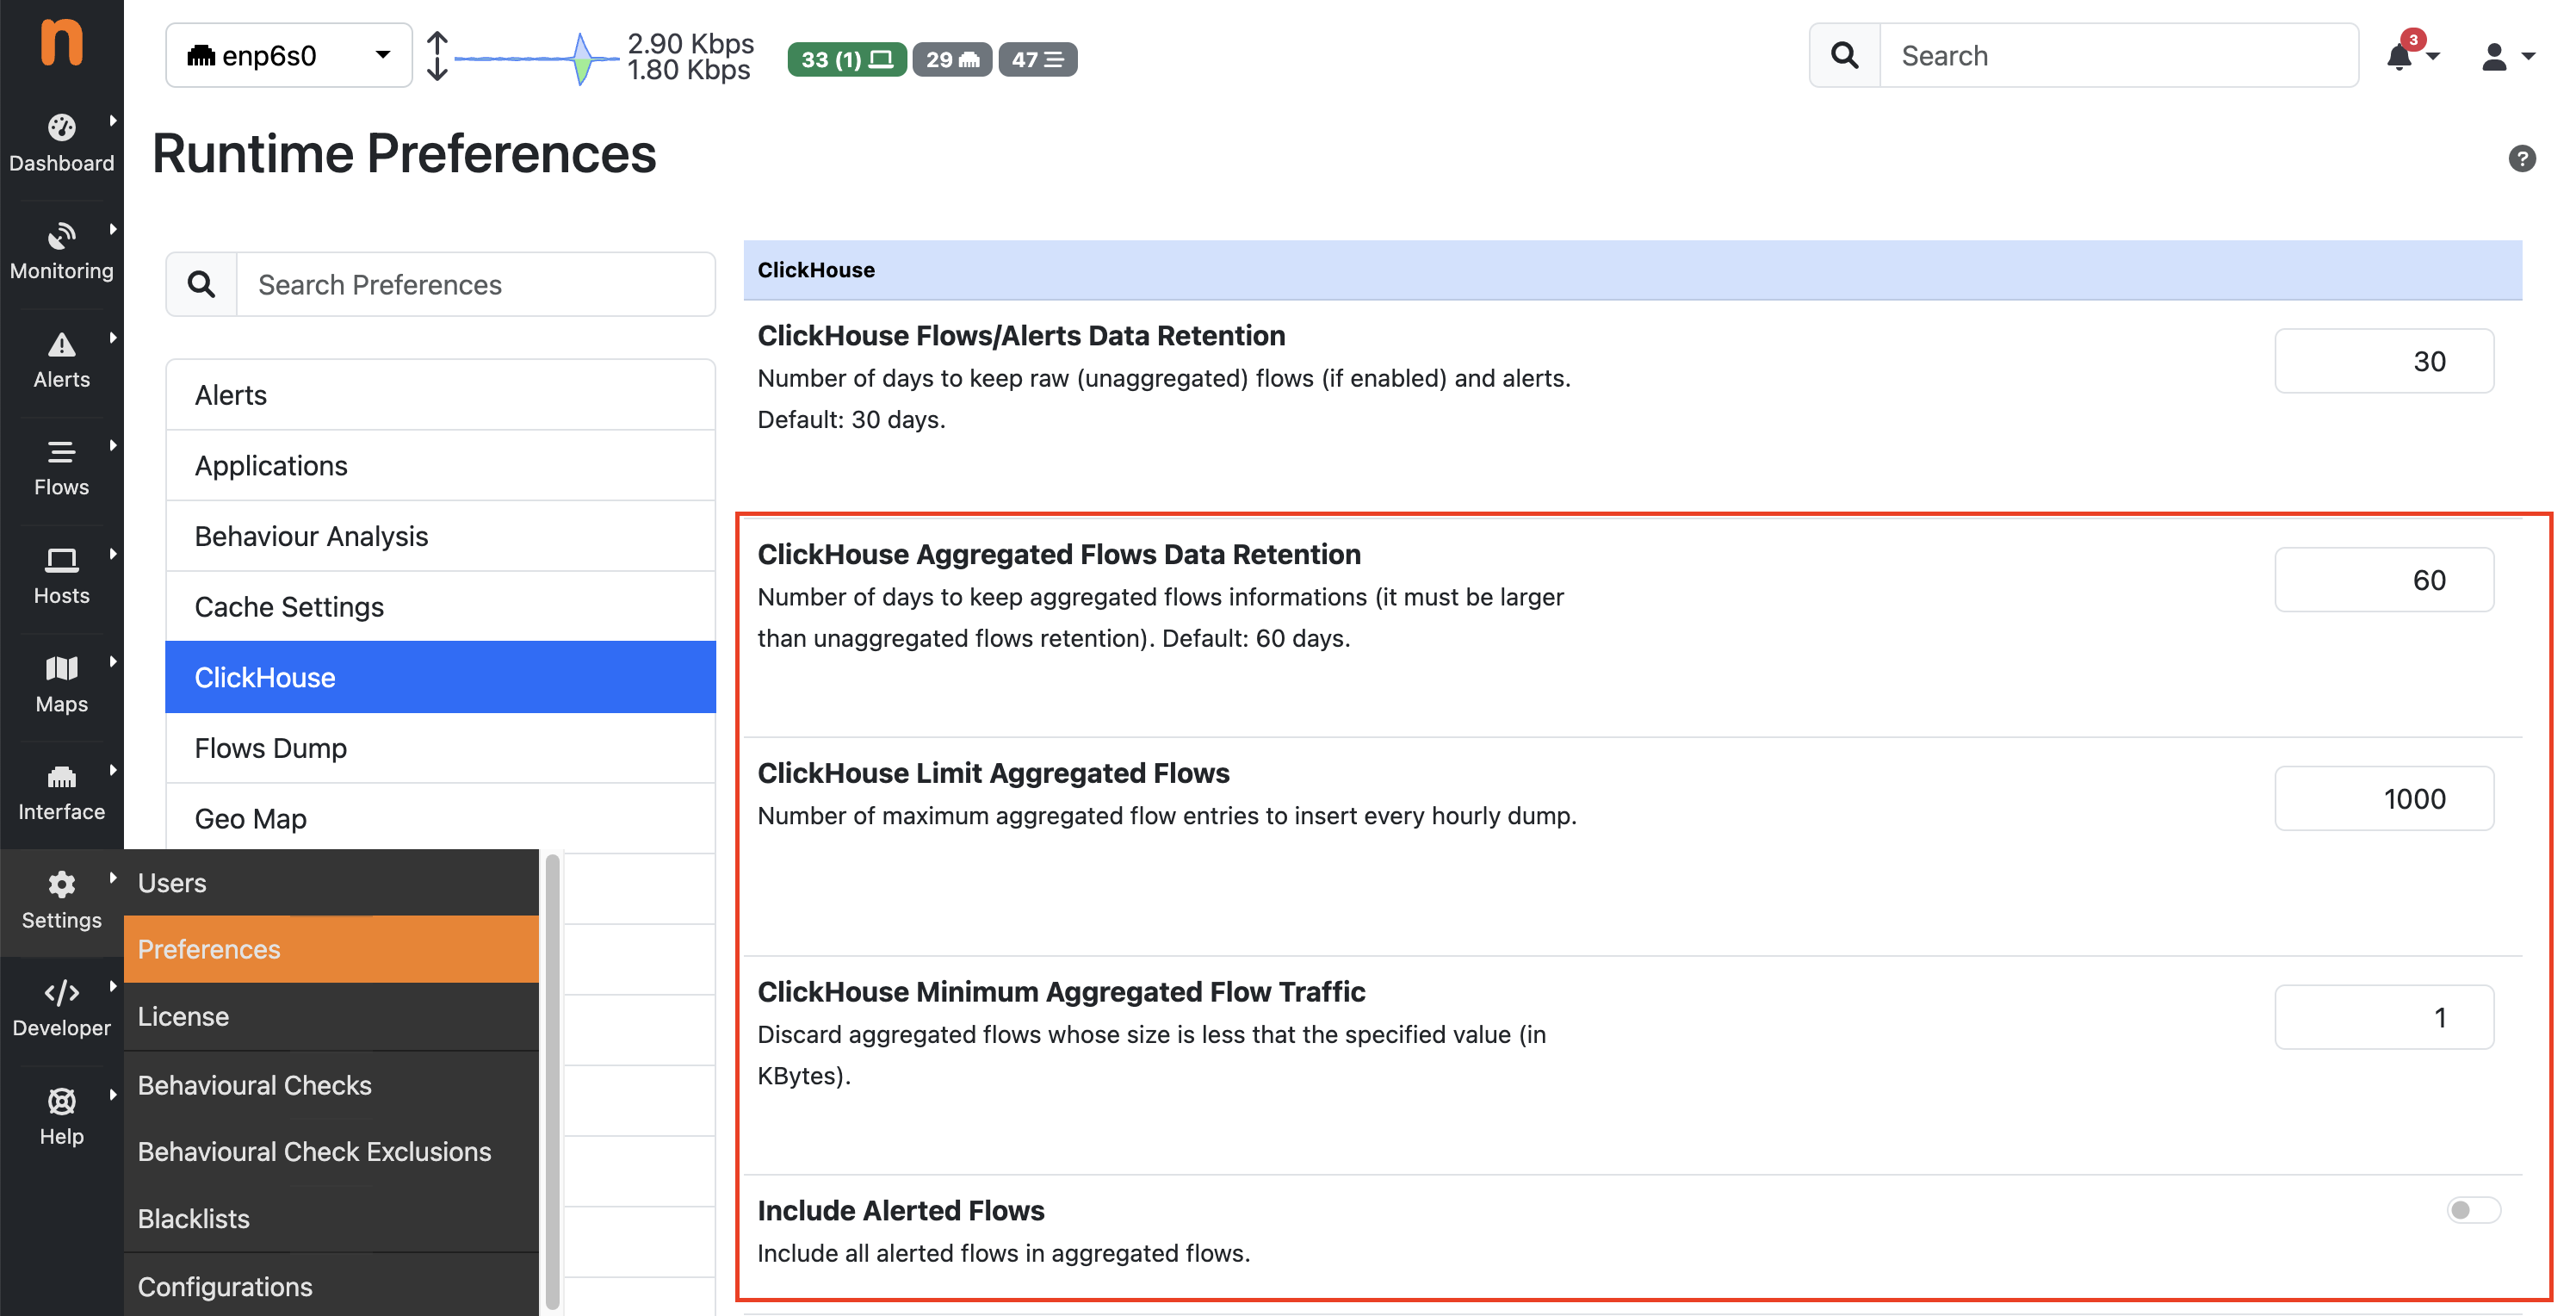
Hourly Historical Flows Settings
- ClickHouse Aggregated Flows Data Retention: Number of days to retain aggregated flow information (must be greater than the retention period for unaggregated flows); the default is 60 days.
- ClickHouse Limit Aggregated Flows: Maximum number of aggregated flow entries to insert in each hourly dump.
- ClickHouse Minimum Aggregated Flow Traffic: Discard aggregated flows with a size less than the specified value (in kilobytes).
- Include Alerted Flows: Include all alerted flows in the aggregated flows.