SNMP Usage
ntopng has the ability to monitor the usage percentage of each interfaces for each SNMP device.
Note
Enterprise L license or above is required
Warning
It is mandatory to have the SNMP timeseries enabled; then a new Usage page is going to be accessible.
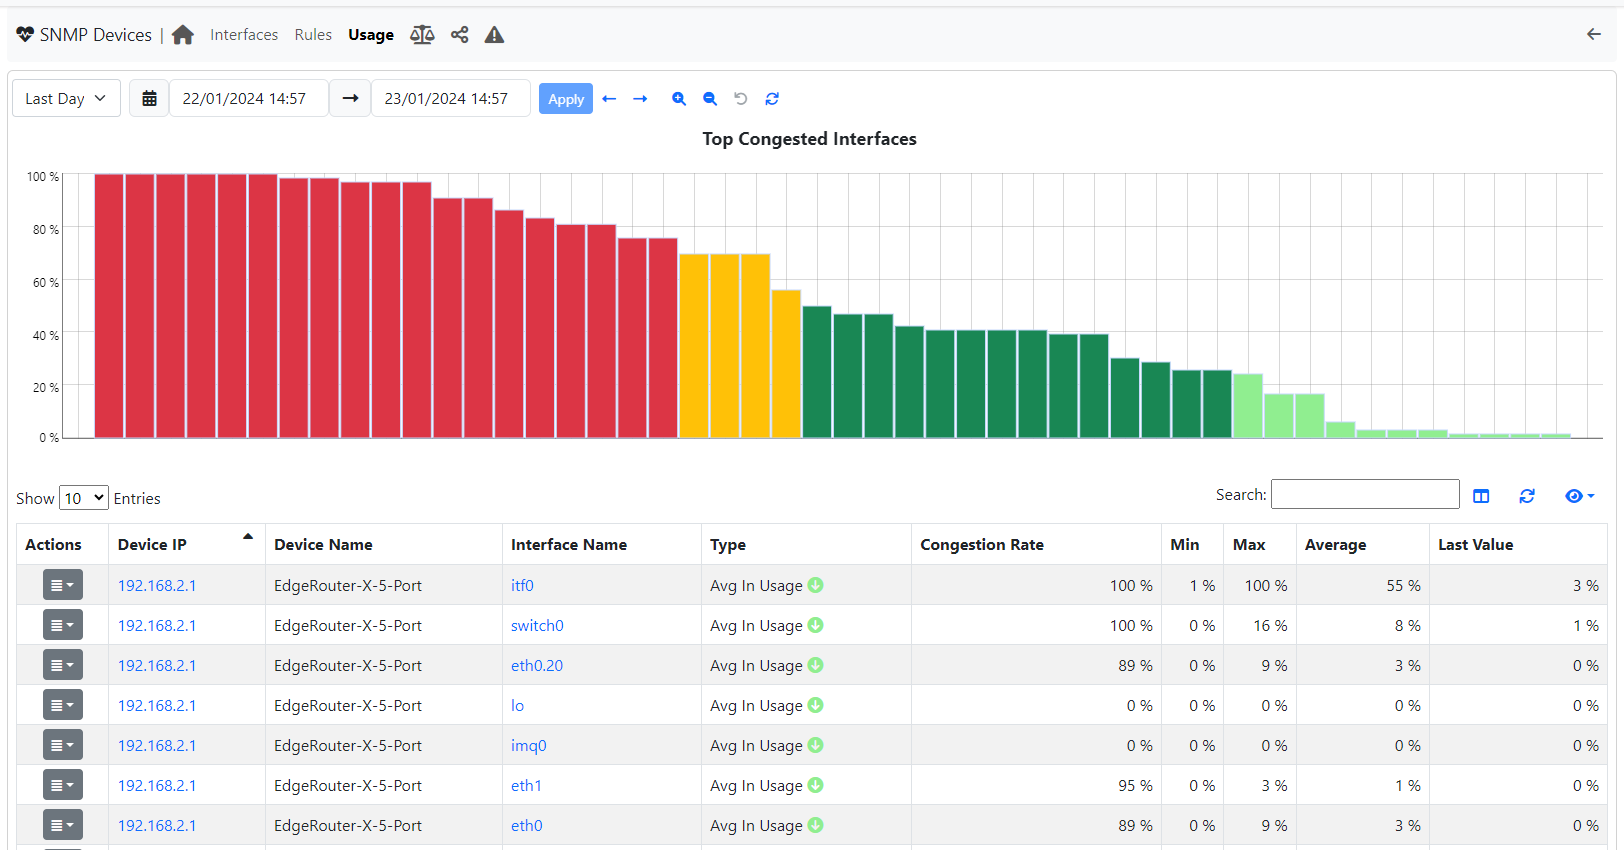
Here it is possible to understand with interface is congested and which not.
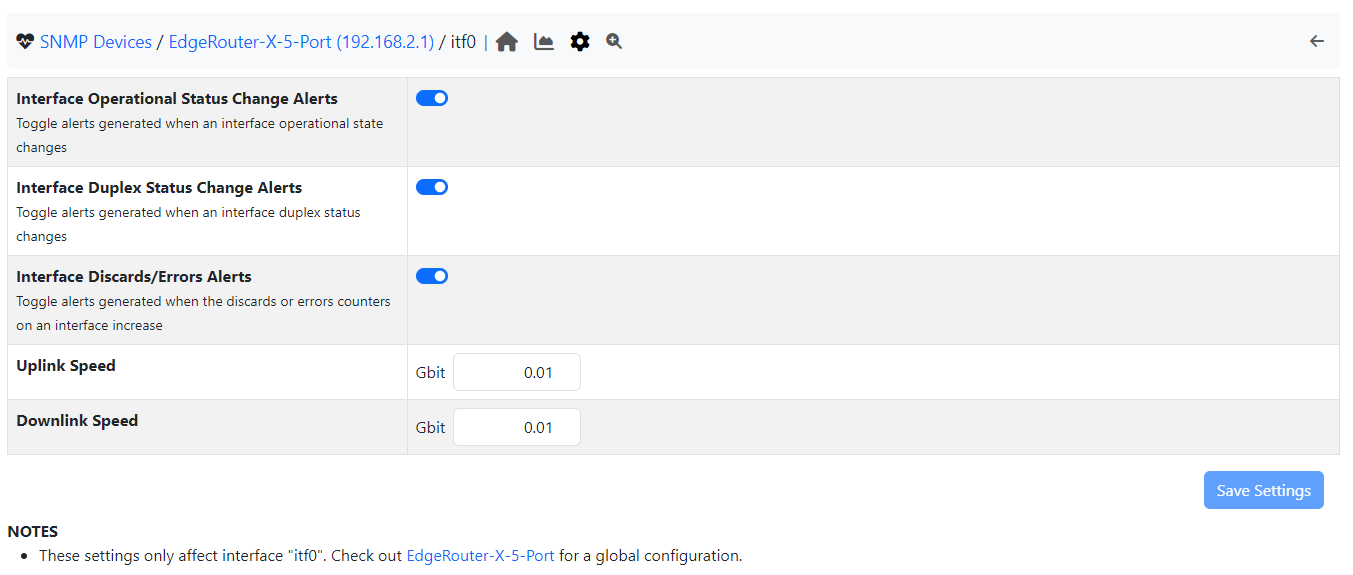
The chart, shows only the Top congested SNMP interfaces; an interface is considered congested if at least 75% of the link is used. The link speed (up and down) info, is provided by SNMP in most cases, however sometimes the link speed is not correct. It is however possible to manually configure it by jumping to the SNMP Interface configuration page.
Given the timeframe (selectable above the Top Congested Interfaces chart), the congestion percentage is calculated by adding the various usage percentages (a timeserie, obtained by comparing the Traffic and the configured Max Link Speed) of the interface and dividing it per the number of points.
Note
Being the congestion, dependent on the usage timeseries, it can have at most 1 point per 5 minutes (the usage timeseries is updated every 5 minutes).
The table instead, shows the congestion rate and other base information of the devices. By clicking on the ‘Action’ button, it is possible to jump to the interface configuration (in case of misconfiguration) or directly drill-down to the Usage timeserie.
Note
An other way to drill-down to the timeserie is by clicking on the corresponding bar in the chart
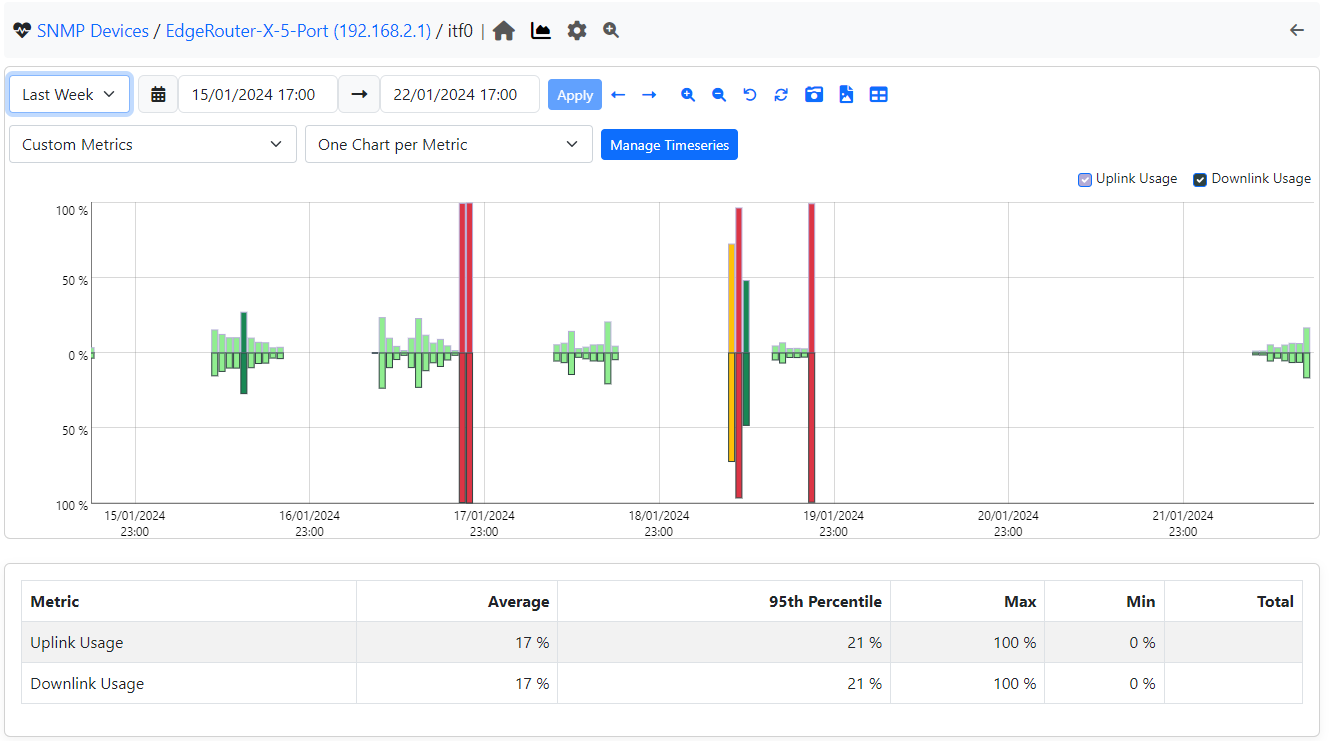
Note that both, the Usage timeseries and the Top Congested Interfaces charts, have different colored bars based on the percentage:
- between 0 and 25, the bar has a light green color
- between 25 and 50, the bar has a green color
- between 50 and 75, the bar has a yellow color
- between 75 and 100, the bar has a red color