Active Monitoring Automation
nAnalyst can add active monitoring scripts to ntopng through natural language, eliminating the need to navigate the monitoring configuration UI.
What is active monitoring?
ntopng’s active monitoring subsystem periodically probes services and hosts to verify they are reachable and performing within expected parameters. Supported probe types include:
ICMP ping — basic reachability check
HTTP/HTTPS — HTTP status code and response time
Speedtest — bandwidth measurement
Throughput — sustained transfer rate test
Adding a monitor via nAnalyst
Simply describe what you want to monitor:
"I want to monitor if there is connectivity to https://qubitowl.com"
nAnalyst will:
Select the appropriate monitoring probe type (HTTPS in this example)
Call the
add_active_monitoring_scripttoolRegister a new monitoring hook that runs every minute by default
Confirm the script was added and show its configuration
The monitor appears immediately in the ntopng active monitoring dashboard alongside any manually configured monitors.
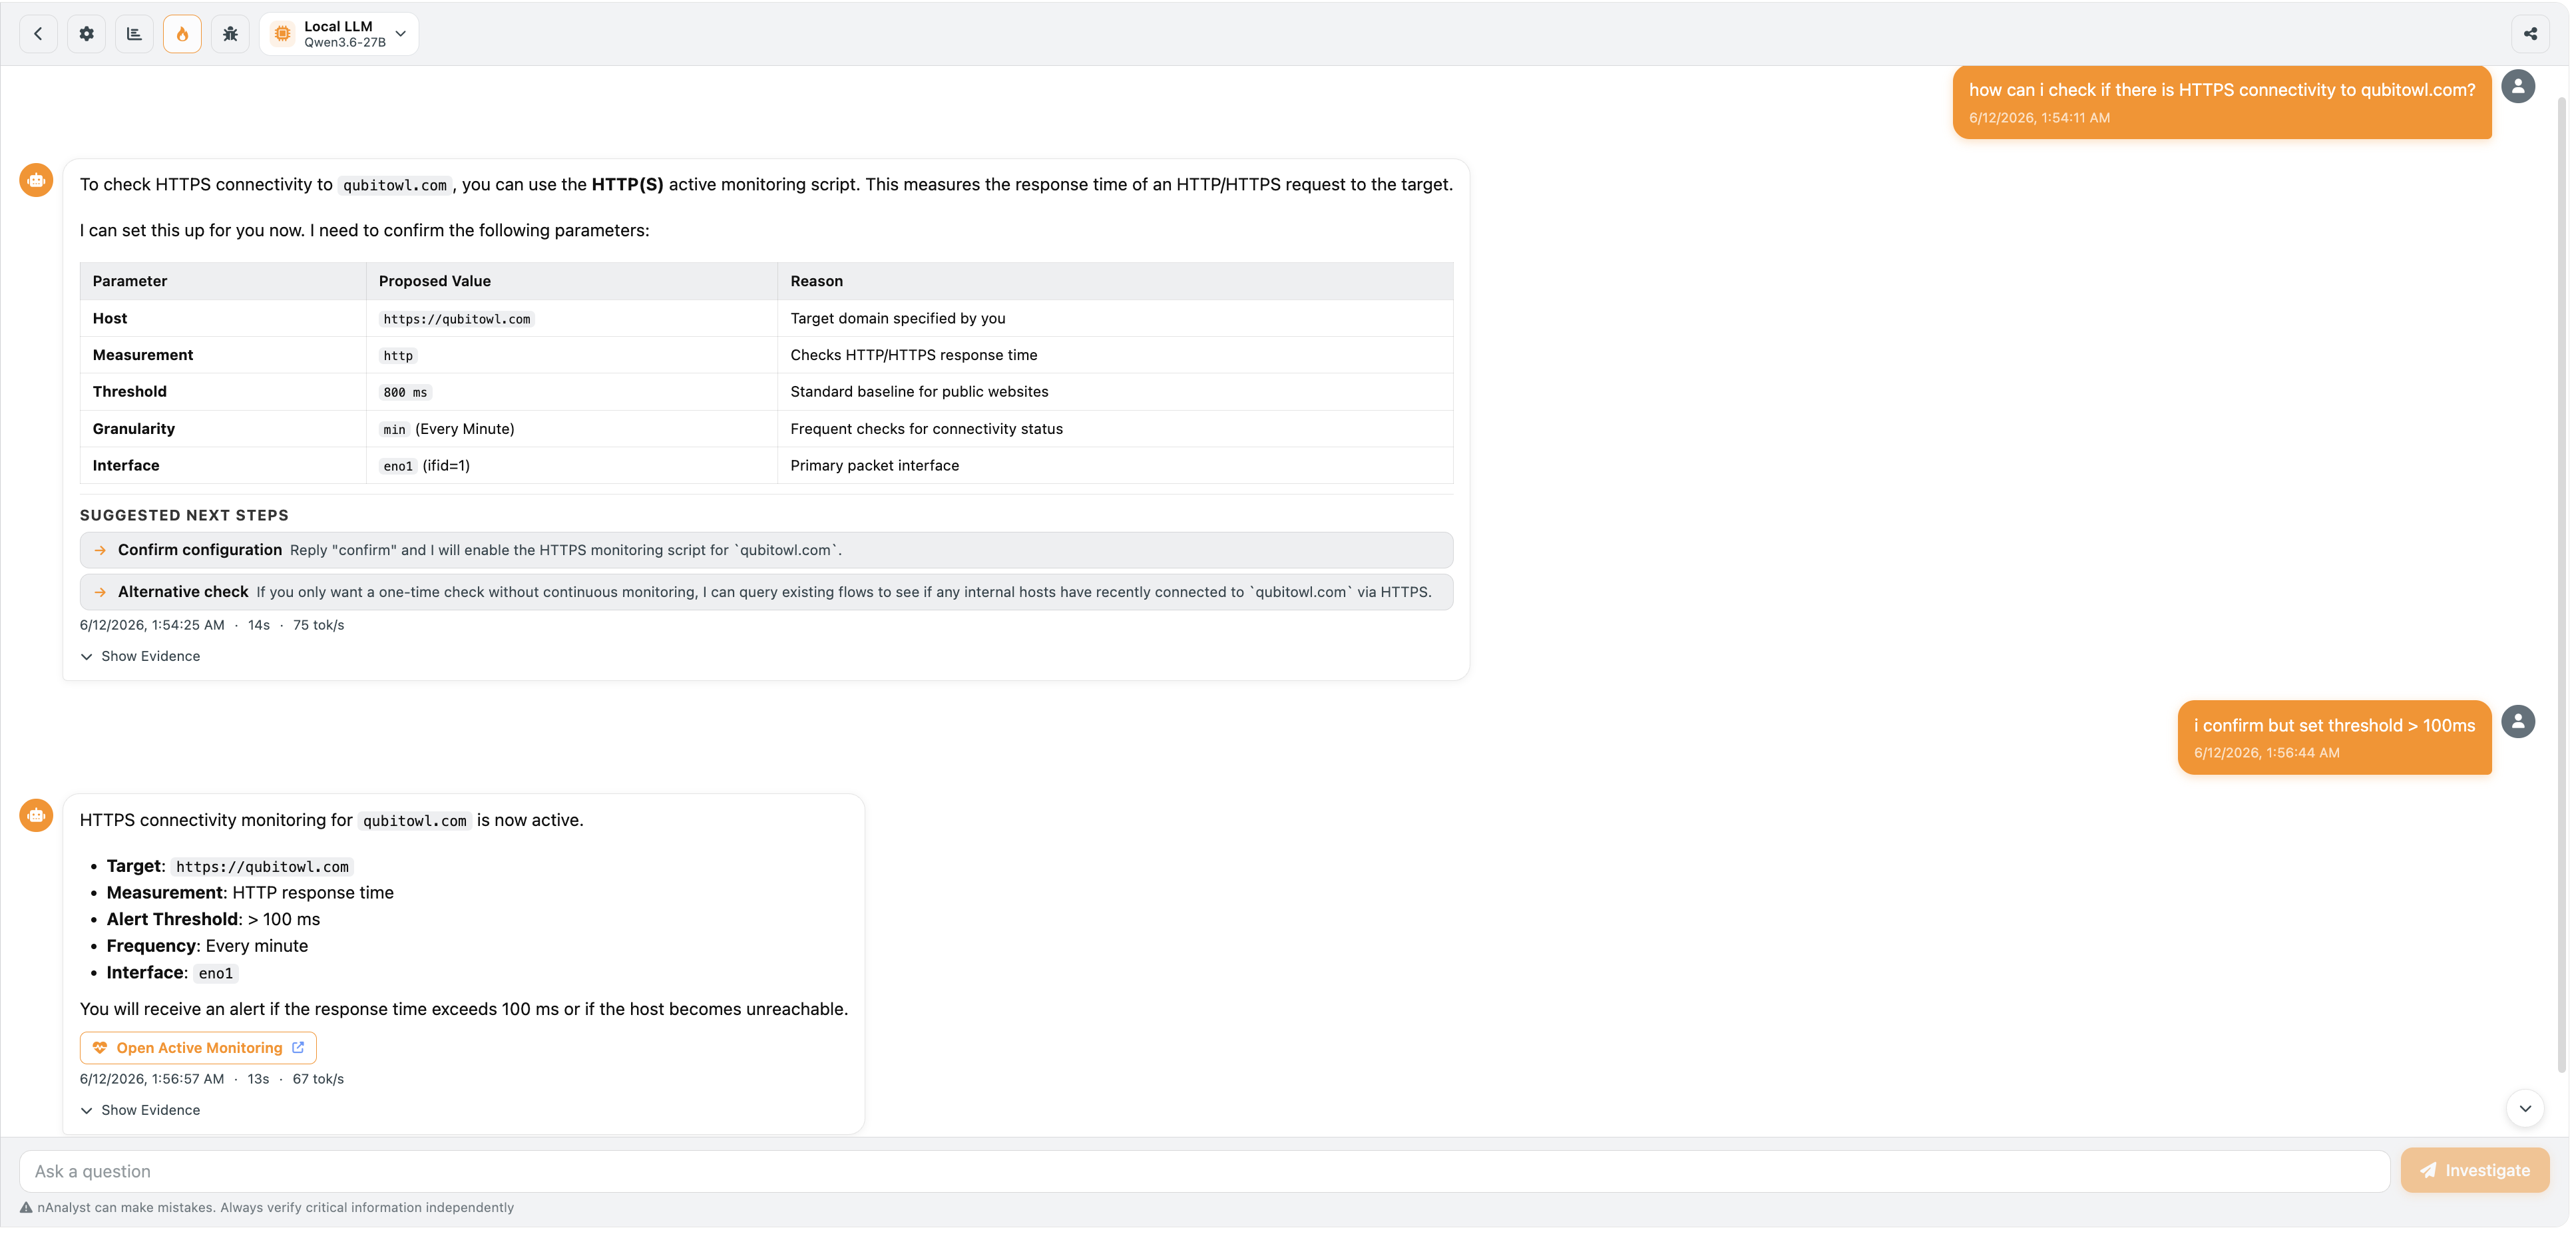
nAnalyst Active Monitoring Script Add
Reviewing and managing monitors
Monitors added by nAnalyst are indistinguishable from manually created ones and are managed through the same ntopng active monitoring interface. The nAnalyst audit log records which user or agent created each monitor.
Use cases
Verify that a newly discovered external dependency is reachable
Confirm that an internal service is up after a change
Add latency baselines for SLA tracking
Monitor a host that triggered an alert to confirm it remains accessible