User's Guide
Developer's Guide
Other Products
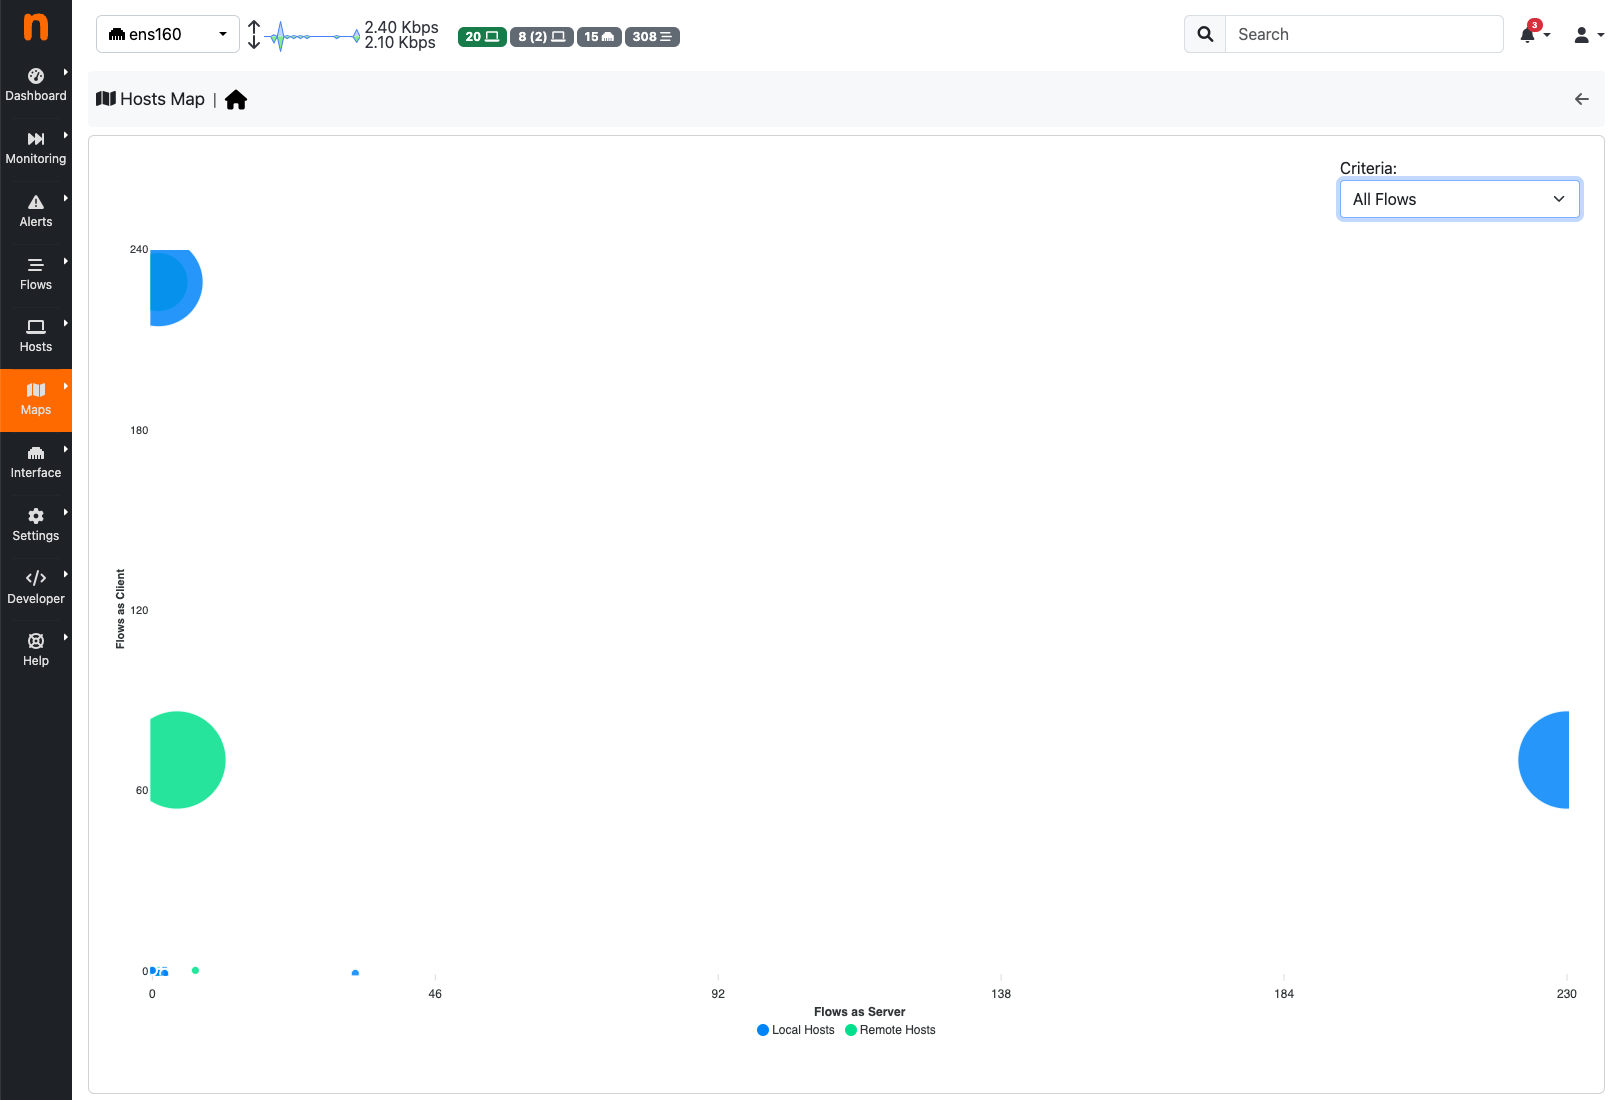
The page shows a bubble chart with visual data clustering, according to a selectable criteria. Anomalies can be easily spotted by looking at the groups which are distant from the others.
The Hosts Map page