After a year, it’s time to release a new stable version of ntop. This version deserves a major number, 5.0, as many things have changed. Beside bug fixes and general improvements, in this release we redesigned the ntop engine, that up to version 4.x was a bit cumbersome. We now have a layer 2 (MAC Address) and layer 3 (IP address) so that the old -o flag is no longer used. Sessions are now enabled by default, as they are used widely in ntop. We update netflow collection supporting new flow templates and circumventing better some implementation flows of probes embedded on hardware devices.
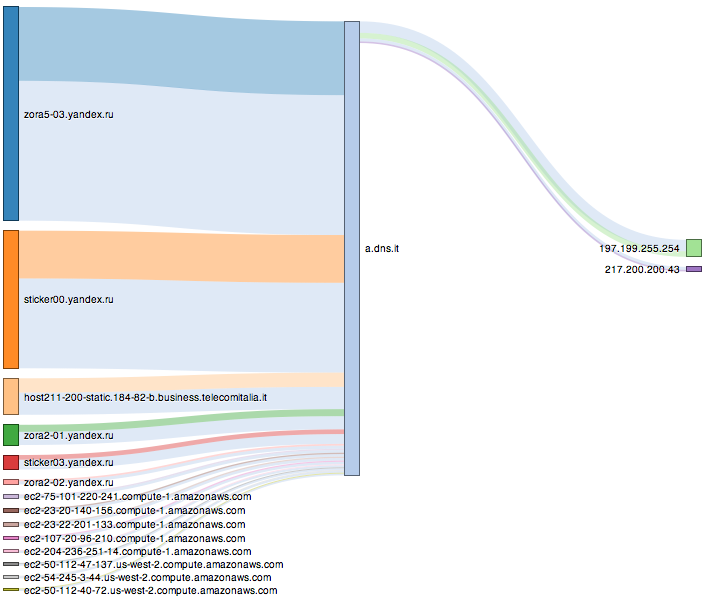
With this release we decided to begin to redesign the GUI, adding new graphs that can better represent facts using a simple and clean design. An example are sankey diagrams that have been used in ntop 5.0 to represent host traffic relationships.
The above diagram shows the connections of host a.dns.it. Each host has a different color, and when a host communicates with another host a new color representation is used. For instance in the above graph sticker00.yandex.ru has exchanged data with a.dns.it. As the color between such hosts is for 1/3 orange (the color of sticker00) and 2/3 violet (the color of a.dns.it) it means that a.dns.it has sent more data to sticker00 than the other way round. Of course you can move chart elements, enable/disable hosts and protocols and thus drill down data.
Another new 5.0 feature, is the support of nDPI that allows ntop to know the real protocol, regardless of the port being used to exchange data. To date more than 140 protocols are supported, and this number will grow in the near future.
We are aware that ntop can be improved, but in order to do that we need your support and feedback. Please share your ideas with us!

