
Every network administrator has, at some point, asked the same question: who is eating my bandwidth? On a typical corporate LAN connected via flat-rate fiber, the answer is mostly a curiosity — useful for capacity planning, less so for the monthly bill. But the moment your network relies on a metered link — a 4G/5G mobile uplink, a VSAT satellite backhaul, an MPLS circuit billed by volume, or a roaming SIM in an IoT fleet — the same question becomes a cost-control problem, and getting the wrong answer can be expensive.
The complication is that “bandwidth used” is not a single number. A host that transfers 10 GB to a colleague’s workstation on the same LAN segment has a very different cost profile than a host that transfers 10 GB to a cloud endpoint over a pay-per-GB satellite link. Traditional top-talkers views lump the two together, which is exactly backwards for anyone trying to control WAN spend: it’s not how much traffic a host generates that matters, it’s how much of that traffic left the building.
Local vs. Non-Local: A Distinction That Matters
To address this, we’ve enhanced ntopng to classify, on a per-host basis, the traffic exchanged over time into two categories:
- Local traffic: traffic exchanged with other hosts belonging to the same local network(s), as defined by ntopng’s local network configuration. This traffic stays on-premises — switched or routed internally — and never touches a WAN uplink.
- Non-local traffic: traffic exchanged with hosts outside the local network(s). This is the traffic that actually crosses the WAN edge: the mobile modem, the satellite terminal, the metered circuit, or any other link where every megabyte has a cost attached.
This is a subtly different question than the usual “internal vs. external IP” split you’d get from a firewall log. ntopng already knows which subnets are “local” from its network configuration (the same concept used throughout the interface to distinguish local from remote hosts), so the classification is consistent with everything else you already see in host details, flows, and alerts. What’s new is that we now track and persist this breakdown over time, per host, rather than only exposing it as an instantaneous flow attribute.
Why This Matters in Practice
Consider a few real-world scenarios where this distinction is the difference between a five-minute investigation and a five-figure invoice surprise:
- Mobile/cellular gateways: An IoT deployment where edge devices talk to each other over a local mesh but occasionally phone home to a cloud dashboard over a metered SIM. Aggregate bandwidth looks fine; non-local bandwidth tells you which device is silently uploading logs it shouldn’t.
- Satellite links (VSAT): Maritime, aviation, or remote-site connectivity where the WAN hop costs orders of magnitude more per byte than the LAN. A single misconfigured backup job or software update pulling updates over satellite instead of caching locally can dominate the monthly bill — and it’s invisible in a generic top-talkers chart.
- Multi-site MPLS/SD-WAN with metered backhaul: Branch offices where intra-site chatter (file shares, local backups, VoIP) is free, but the WAN circuit back to HQ or to the internet is billed by volume.
- Cost attribution and chargeback: When bandwidth costs need to be attributed to specific departments, tenants, or devices, “local” traffic is effectively free and should be excluded from the calculation entirely.
In all of these cases, the actionable metric isn’t total throughput — it’s WAN throughput, per host, sustained over time.
What’s New in ntopng
To make this visible and actionable, we’ve added a dedicated page name Historical that lets you inspect, for any hlocal ost (or across all hosts), how local and non-local traffic volumes have evolved over time.
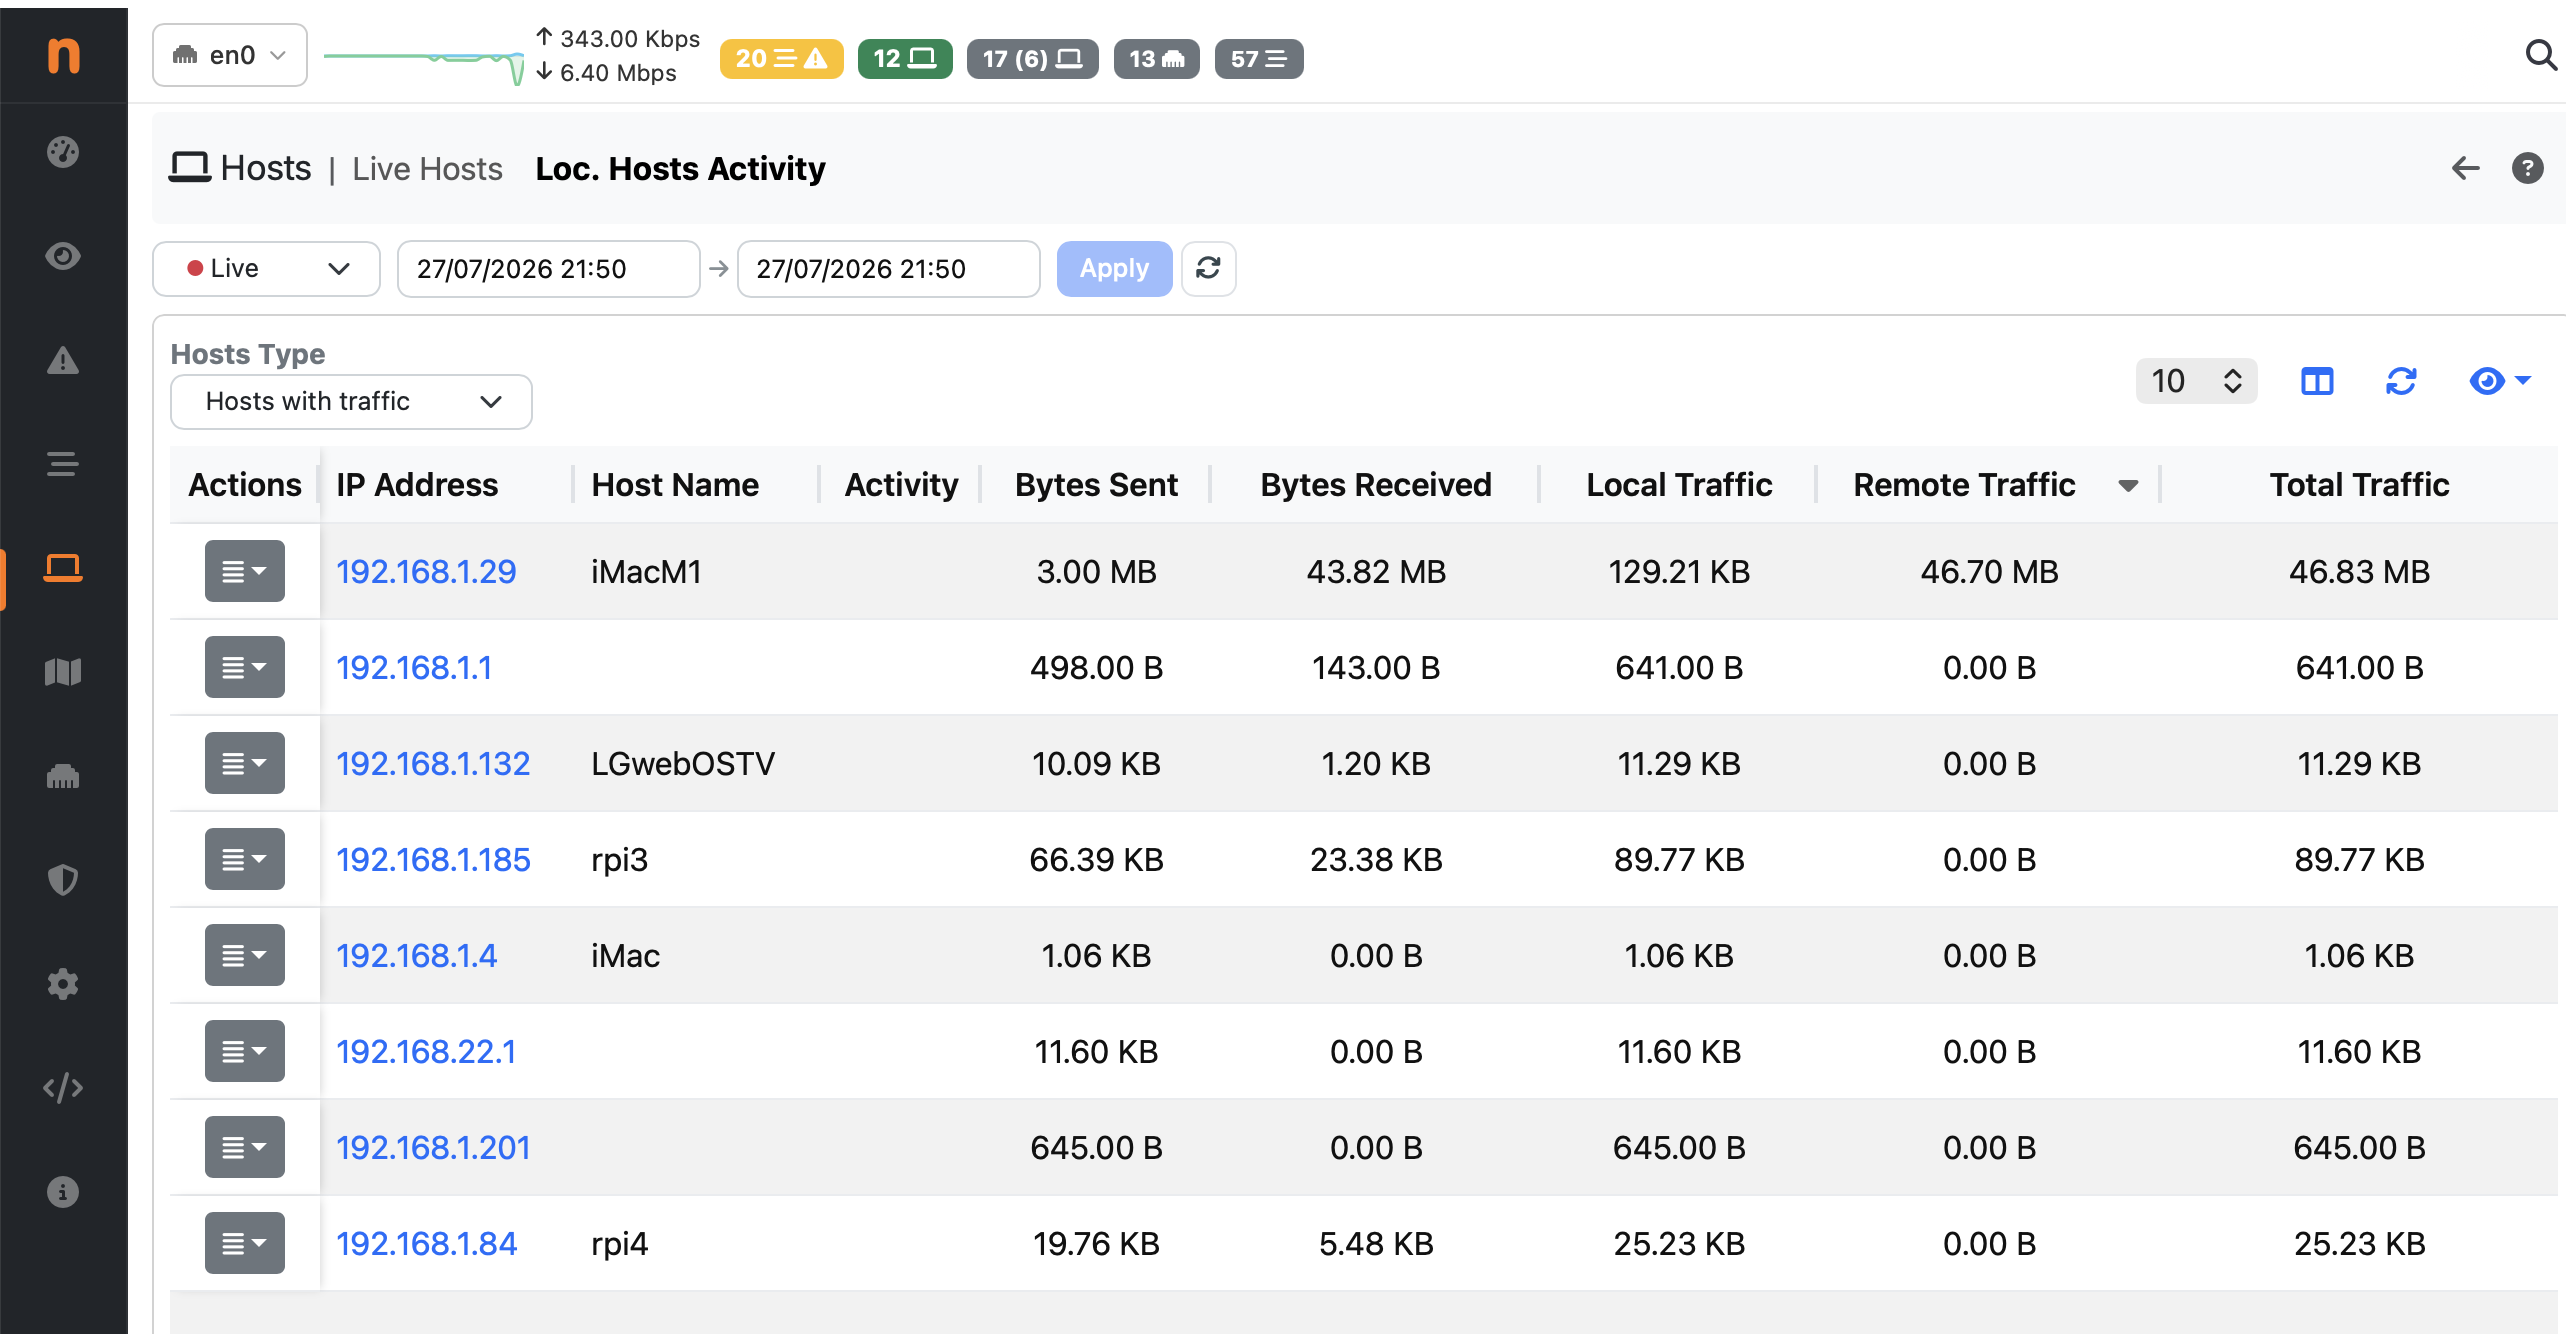
Concretely, the page provides:
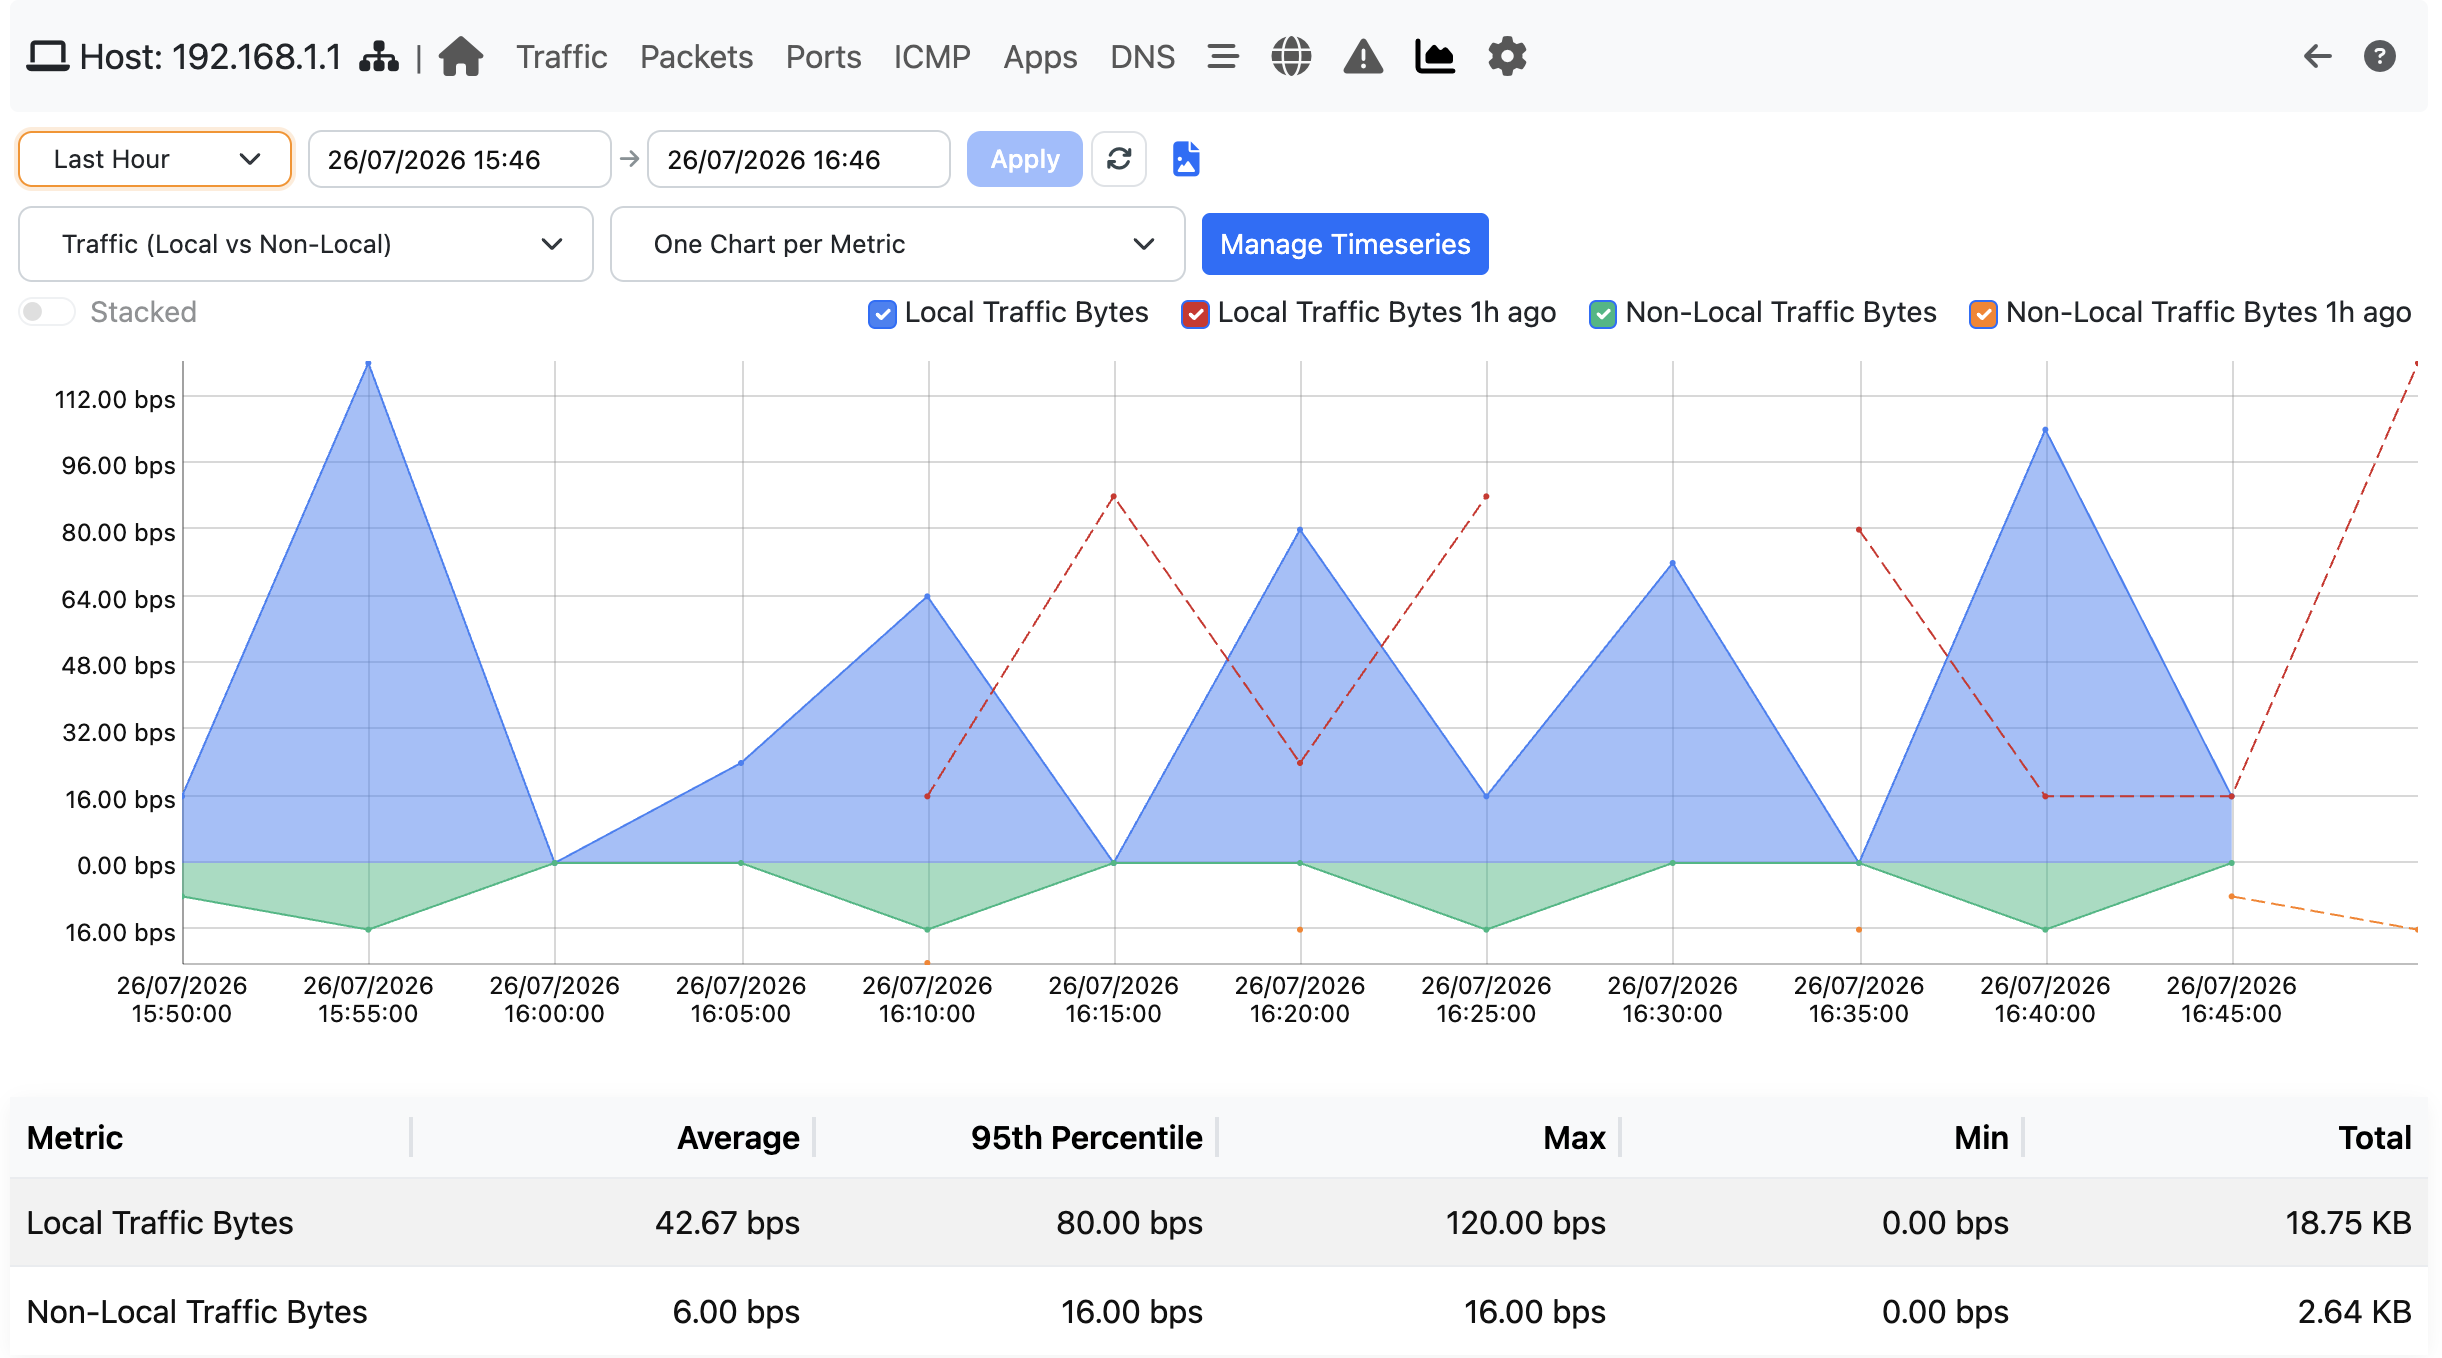
- Time-series breakdown of local vs. non-local bytes (and packets) per host, so you can see not just who used the most WAN bandwidth, but when — a burst at 3 a.m. is a different story from steady daytime usage.
- A ranked “top non-local users” view, which is really the metric that matters when the WAN link is pay-per-use: sorting by total bytes hides the hosts that are cheap-but-chatty locally and expensive-but-quiet on the WAN side.
- Historical persistence, so the data survives beyond the retention window of raw flows, making it usable for monthly billing reconciliation, capacity trending, and anomaly detection rather than just live troubleshooting.
- Per-(local)host drill-down, consistent with the rest of ntopng’s host details pages, so once you’ve identified a heavy non-local consumer you can immediately pivot to its flows, application breakdown (via nDPI), and remote peers to understand why.
Under the hood, the classification leverages the same local-network definition ntopng already uses elsewhere, so no additional configuration is required beyond having your local subnets correctly defined — something most deployments already have in place. The counters are accumulated incrementally as flows are processed, keeping the overhead low even on high-throughput monitoring points.
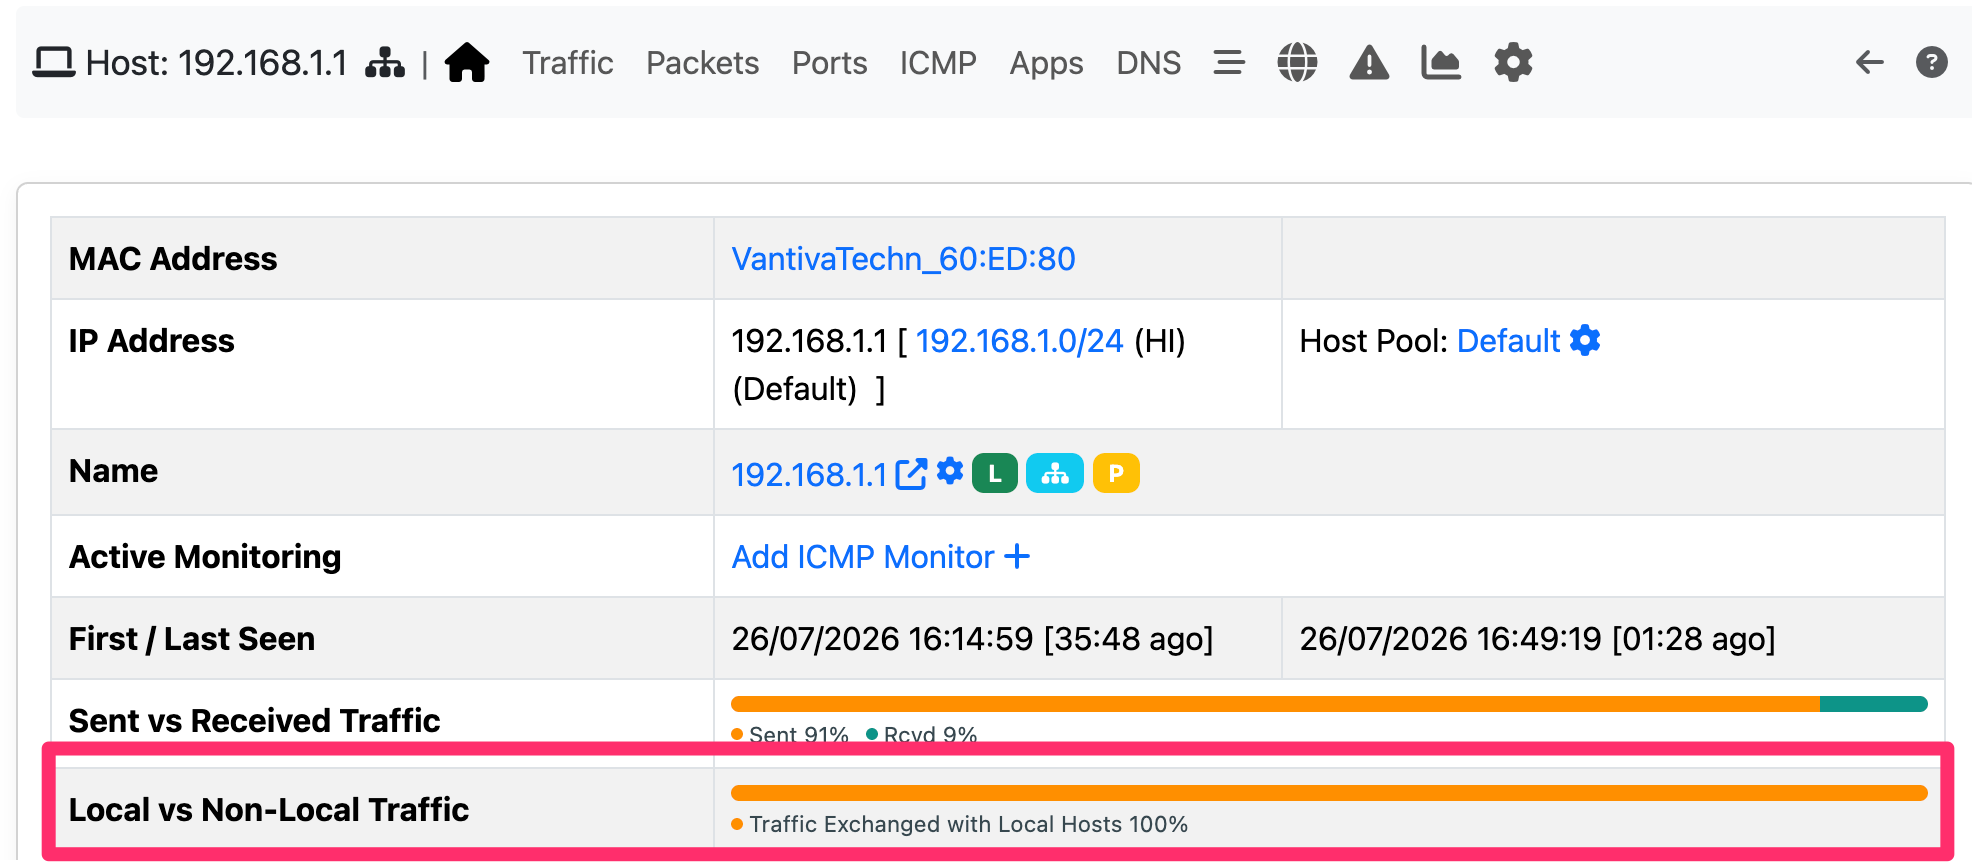
In every host you can see the local non/local traffic breakdown
and you can see how local vs non-local changed over-time for every local host.
Beyond Cost Control
While metered-link cost control is the primary motivation, the local/non-local split has secondary benefits worth calling out:
- Security visibility: a host that suddenly starts generating substantial non-local traffic — especially outbound — can be an early indicator of data exfiltration, a compromised device beaconing out, or unauthorized cloud sync tools bypassing local policy.
- Architecture validation: it’s an easy way to verify that services which are supposed to communicate locally (e.g., a local cache, a local backup target) are actually doing so, rather than silently routing through the WAN due to misconfiguration.
- Capacity planning for WAN upgrades: trending non-local traffic per host or per site over weeks or months gives a much more honest input for WAN sizing decisions than raw total traffic.
Wrapping Up
“Who are the top network users?” is a question every network team needs to answer — but on networks where WAN capacity has a price tag, the more useful question is “who are the top WAN users?” By separating local from non-local traffic at the host level and tracking it over time, ntopng gives you a direct answer, without needing to reverse-engineer it from raw flow exports or NetFlow records after the fact.
We’ll be following up with more detail on the underlying local-network classification logic and on how this integrates with alerting for sudden non-local traffic spikes. In the meantime, if you’re running ntopng on a link where every byte has a cost, this new page is worth a look.
Enjoy !