
In our continuous effort to improve user experience and make network monitoring more intuitive, we have completely redesigned the ntopng Navigation Bar. As our feature set expands—with crucial additions like the nAnalyst automated pipeline, specialized AI Dashboards, and high-resolution Observability analytics—the legacy menu structure needed a logical evolution to reduce deep nesting and facilitate daily operations.
We have completely rearranged the main categories to help you find what you need faster, drawing a clear line between operational network monitoring, analysis tools, and security/alerting policies.
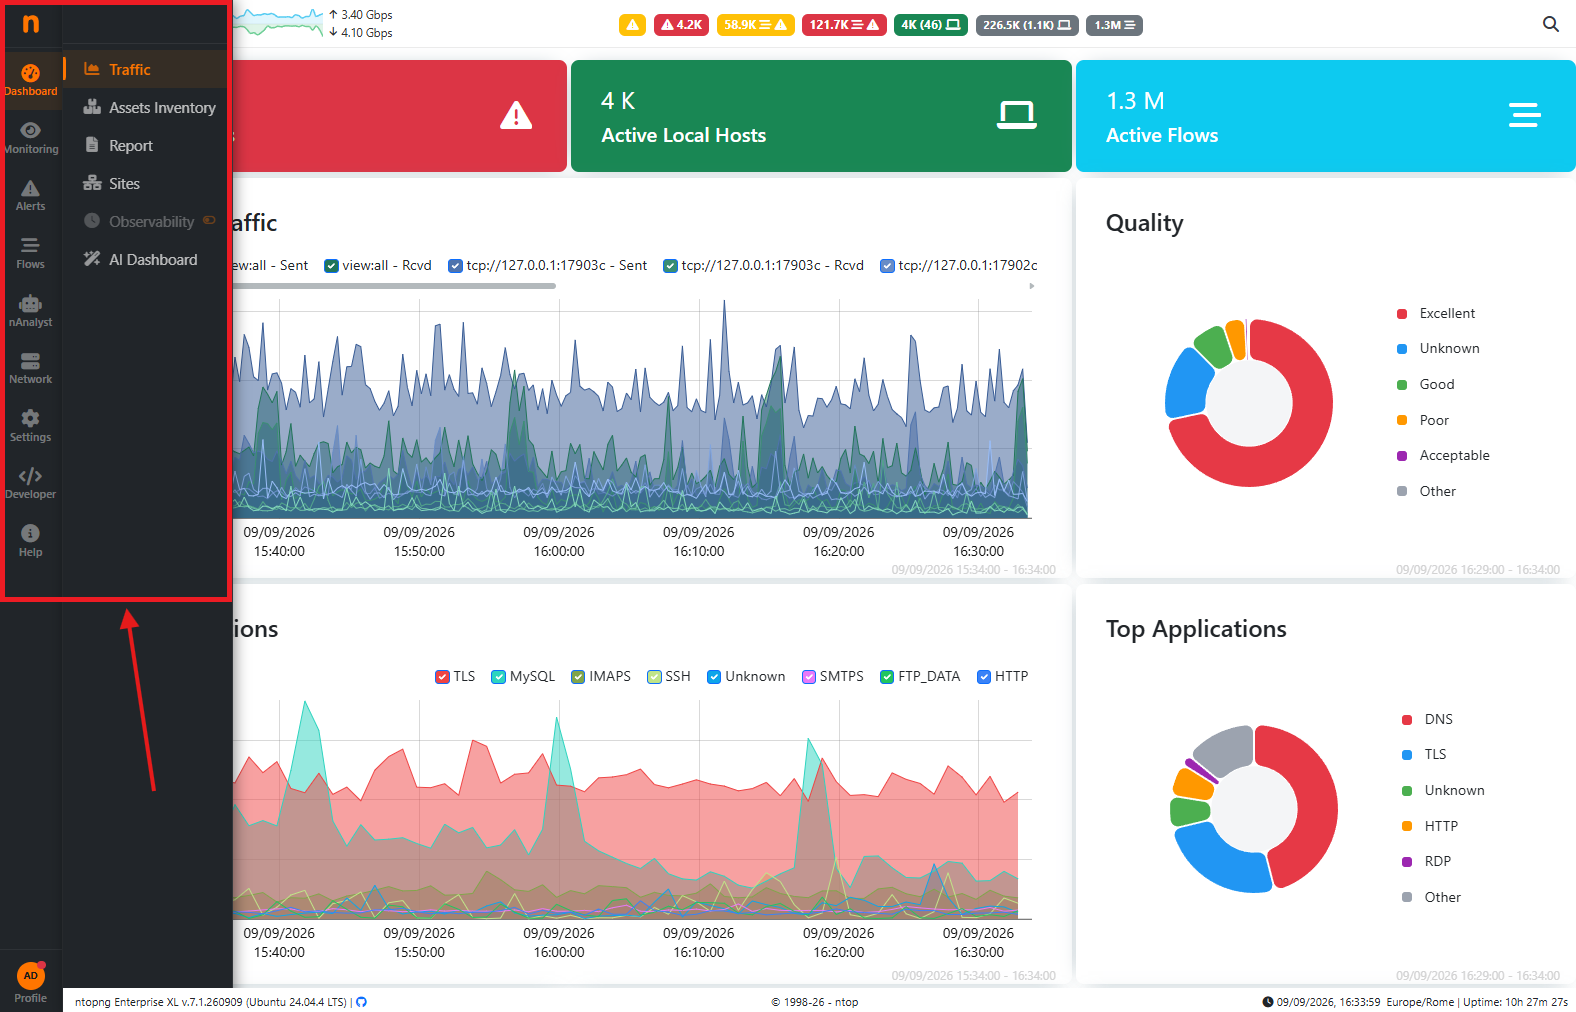
Key Structural Updates
- Dashboard & Advanced Analytics
- AI Dashboard & Observability: Fully integrated as dedicated entries under the core Dashboard section.
- Assets Inventory & Sites: Promoted to the main Dashboard area for quick, high-level business infrastructure overviewing.
- nAnalyst (New Dedicated Section)
- An entirely new root menu entry dedicated to our automated AI workflows, grouping nAnalyst (Brain), AI Policy, Analyst Pipeline, and related usage statistics/auditing tools.
- Network & Interface Unification
- Submenus like Hosts, MAC Addresses, Interface Details, Autonomous Systems, Countries, and VLANs have been consolidated under a much cleaner, unified layout layout split logically across the main navigation paths.
- Custom analysis layouts such as Geo Maps, Service Maps, and Hosts Maps are now directly accessible here.
- Settings vs. Policies Separation
- Settings: Restructured to focus strictly on system configurations, user administration, preferences, tags, and threat intelligence list management.
- Policies (New Category): To isolate the behaviors that trigger alerts, pages like Access Control Lists (ACL), Allowed Applications, Network Configuration, Traffic Rules, Behavioral Checks, and Traffic Profiles have been migrated into this brand-new dedicated space.
- Dashboard & Advanced Analytics
| Section / Page Name | Layout Status | Old Menu Path (menubar.lua) | New Navbar Path (JSON sections) |
|---|---|---|---|
| User Dropdown Menu (Theme, Blog, Updates, Logout) | NEW | Scattered topbar options | User Profile Icon Menu → [Toggle Dark Theme / News from the ntop Blog / Software Updates / Login-Logout] |
| nAnalyst (Brain, Pipeline, AI Policy, Stats) | NEW | Not Present | nAnalyst → [Dedicated Submenus] |
| AI Dashboard | NEW | Not Present | Dashboard → AI Dashboard |
| Collection / Flow Exporters | REMOVED | Collection / Flow Exporters | Consolidated under the new Network menu |
| Maps | REMOVED | Maps | Consolidated under the new Network menu |
| Interface Details | REMOVED | Interface | Consolidated inside the unified Network menu |
| Policies / Rules & Policies | REMOVED | Rules & Policies | Consolidated entirely under Settings with specific dividers |
| Threat Intelligence | RENAMED | Admin → Blacklists | Settings → Threat Intelligence |
| nProbe | RENAMED | Collection → Probe | Network → nProbe |
| Manage Users | MOVED | Admin → Manage Users | Settings → Manage Users (Also accessible directly by clicking on the User Profile / Name) |
| Observation Points | MOVED | Collection → Observation Points | Network → Observation Points |
| sFlow Counter Exporters | MOVED | Collection → sFlow Exporters | Network → sFlow Counter Exporters |
| Geo Map / Service Maps | MOVED | Maps → [Geo Map / Analysis Map] | Network → [Geo Map / Analysis] |
| VLANs / Interface Details / AS / Countries | MOVED | Interface → [VLANs / Interface / AS / Country] | Network → [VLANs / Interface Details / AS / Countries] |
The New User Dropdown Menu & Account Management
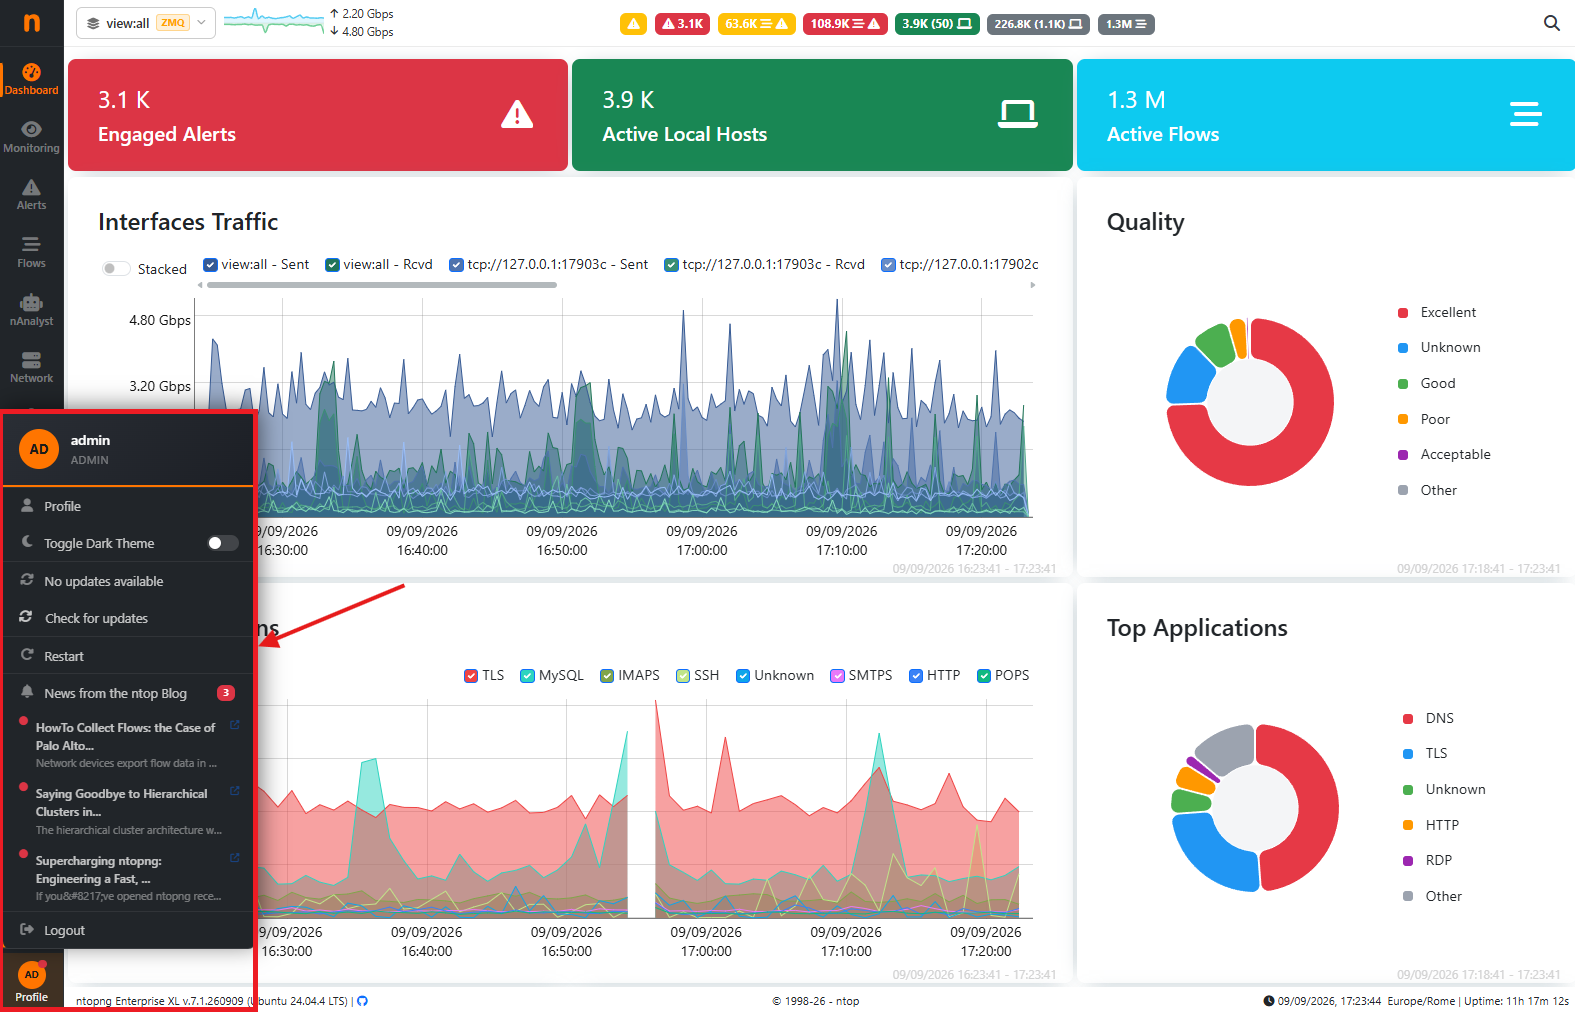
We have completely centralized user preferences, system notifications, diagnostic actions, and authentication controls into a clean, modern User Dropdown Menu. This menu collapses all loose administrative shortcuts into a unified, vertical layout accessible directly by clicking on your profile area:
- Profile Shortcut: Provides immediate access to your personal account settings and user profile details.
- Quick Theme Toggle: A native Toggle Dark Theme switch allows you to seamlessly flip between light and dark modes with a single click.
- Software Updates Center: Integrates live diagnostic status tracking, displaying “No updates available” (or pending update alerts) alongside a quick “Check for updates” trigger button.
- System Restart: Includes a dedicated Restart action right inside the menu, allowing administrators to reboot the ntopng service instantly without leaving the GUI.
- Interactive ntop Blog Feed: Features an embedded “News from the ntop Blog” section with a live notification counter. It lists the latest official articles (such as flow collection guides or architectural changes) complete with unread notification badges so you can stay updated directly from your instance.
- Session Controls: The traditional Logout function is cleanly anchored at the very bottom of the dropdown.
Where is User Management now?
Administrative actions have been made much more accessible. You can now jump into Manage Users in two quick ways:
- By navigating to the new consolidated path: Settings → Manage Users.
- Or simply by clicking directly on your Username or Profile avatar at the corner of the screen, which acts as an instant shortcut to your account configuration.
Wrap Up
These layout updates are part of our ongoing commitment to making ntopng not just more powerful, but faster and more pleasant to use every day. By grouping tools into cleaner logical hubs and centralizing profile management, you can spend less time navigating menus and more time focusing on your network performance and security.
We are excited for you to try out this new interface! As always, we would love to hear your feedback, thoughts, or suggestions. Connect with us on our official Telegram community or file issues and contributions directly on our GitHub repository.