
For most network operators, traffic visibility is not mandated by regulation, so it tends to be reactive rather than continuous: a “manual” investigation happens only after something breaks. Combined with limited time to review telemetry and the cost/data-sovereignty concerns of cloud-based visibility platforms, this leaves a real gap for AS operators and IXP participants who need to understand what is actually happening on their transit and peering links.
ntop’s response is an open-source, on-premise stack (free at the community tier, with a paid enterprise tier funding development ) built specifically to close that gap for networks scaling from single routers to 100+ routers and multi-100 Gbit/s links.
Anatomy of a Flow
The foundation is the classic IPFIX/NetFlow/sFlow flow record: packet/byte counters, timestamps, 5-tuple (source/destination IP, L4 ports), ingress/egress ifIndex, and, critically for AS-level observability, next-hop address, source/destination AS number, and source/destination prefix mask. These routing-and-peering fields are what let the platform reason about where traffic enters and leaves an autonomous system, not just how much of it there is.
Architecture
The pipeline is vendor-neutral and composed of a small number of well-defined stages:
Router/Switch (SNMP, sFlow/NetFlow/IPFIX)
        │
        ▼
     nProbe  ────►
        │
        ▼ (flows + light DPI)
     ntopng ──► Redis (cache) ──► Grafana
              └─► ClickHouse / Elastic (timeseries, flows)
└─► Wazuh (SIEM integration)- PF_RING provides the high-speed packet capture layer (1/10/40/100 Gbit).
- nProbe collects flow data — either generated natively from packets or received as sFlow/NetFlow/IPFIX from routers/switches (Cisco, MikroTik, Huawei, Juniper/HPE, etc., normalized for vendor “dialects”).
- ntopng is the analysis engine, correlating flows with SNMP-derived infrastructure data, storing time series in ClickHouse or Elastic, and exposing dashboards directly or via Grafana.
BGP/BMP Integration: Correlating Flows with Routing State
A key architectural addition is a dedicated bgp_server component that peers with routers via BGP and BMP (BGP Monitoring Protocol):
- Routers send BMP/BGP session data and withdraws to
bgp_server. bgp_serverexchanges RIB state with nProbe over ZMQ and a Redis-like protocol.- ntopng queries
bgp_serverfor RIB lookups and receives push notifications, allowing it to enrich live and historical flow records with BGP peer ID, peer ASN, origin, next hop, AS path, MED, local preference, and communities, turning a flow view into a routing-aware view.
This is what makes it possible to click into a single flow and see not just “who talked to whom” but the actual BGP path, local preference and MED that determined how the traffic was routed including a BGP Looking Glass with RPKI validation for prefix lookups.
Configuring the AS/IXP View
Operators define three ASN sets in the configuration:
- My ASNs — the organization’s own AS numbers.
- Customer ASNs — ASNs of customers interconnected via the operator’s network.
- Relevant Remote ASNs — external ASNs worth tracking for monitoring purposes.
SNMP interfaces are then tagged with a traffic role — Customer, IX (Internet Exchange), Internal LAN, Internet Connectivity (Uplink), Peering, Transit, or Other — which drives automatic breakdowns of traffic into transit vs. peering vs. customer categories, plus interface-level alerting (operational status changes, duplex changes, discard/error counters). With ASN sets and interface roles configured, ntopng exposes several purpose-built views:
- ASN visibility: throughput and traffic breakdown per ASN, filterable by My ASNs, Customer ASNs, Relevant Remote ASNs, or All ASNs, with live and historical time series.
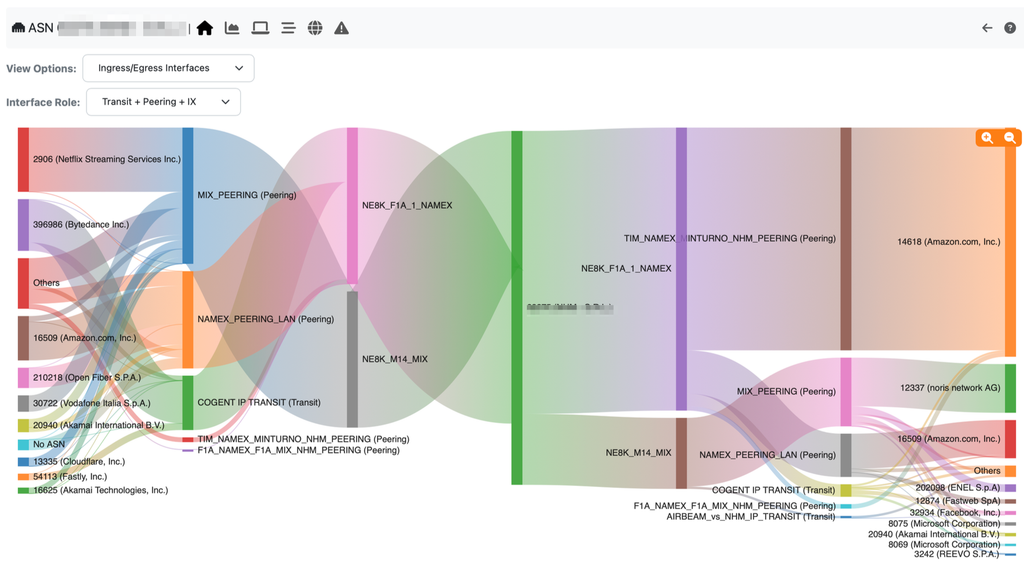
- Router/interface Sankey diagrams: a flow view from ingress interface → router → egress interface → destination ASN, making it immediately visible, for example, which peering or transit sessions are carrying traffic to/from a given ASN (e.g., visualizing how traffic to Netflix, Amazon or Cloudflare is distributed across MIX peering, NAMEX peering and Cogent transit).
- Exporter/interface stats: bytes sent/received per flow exporter and per interface, broken down by role (peering, IX, uplink), for capacity and cost analysis across multiple routers.
- Flow-level BGP detail: for any given flow, the BGP client and server-side prefix, peer ID, peer ASN, AS path, MED, local preference and communities.
Deployed against a real network (ASN 62275), the resulting Sankey visualizations make traffic engineering questions — “how much of our Netflix/Amazon/Bytedance traffic rides on paid transit vs. settlement-free peering?” — directly answerable rather than requiring ad hoc CLI digging across multiple routers.
Capabilities Summary
As of this iteration, the stack delivers:
- Passive BGP/BMP session analysis.
- Live and historical AS-path visualization per flow.
- Automatic transit vs. peering traffic breakdown.
- Network prefix change alerting.
- Correlation of SNMP infrastructure data with NetFlow/IPFIX traffic data.
- Lightweight DPI-based traffic classification.
- Scalability to 100+ routers and 100 Gbit+ links via distributed collection.
The Next Challenge: Too Much Telemetry, Not Enough Time
Even with all this instrumentation, the talk is candid about the residual pain points:
- Gigabytes of metrics generated daily.
- Difficulty setting meaningful alarm thresholds against dynamic, bursty traffic.
- Poorly correlated data sources — BGP state and flow data don’t always line up cleanly in time or granularity.
- Limited operator time to actually review telemetry.
The stated bottom line: network analysis has no value if nobody has time to look at it.
Closing the Loop with AI: nAnalyst
ntop’s answer is to treat ntopng as a telemetry engine and structured data source for LLMs, rather than trying to build alerting heuristics that generalize across every network. Concretely:
- ntopng’s REST API returns structured, AI-friendly JSON suitable for direct LLM consumption.
- Live and historical telemetry is inserted into LLM prompts as context.
- An agent orchestrates the analysis, calling into ntopng’s tool catalog (currently ~52 read/write tools — e.g., Get Live Flows Summary, Get Country Stats, List Active Monitoring Scripts, Add Active Monitoring — each gated by license tier and read-only/write annotations).
Two concrete integration patterns were demonstrated:
1. MCP-based AI assistant (e.g., Claude Code). ntopng exposes an embedded MCP server over its REST API (/lua/rest/v2/exec/llm/mcp.lua), authenticated with a per-user token:
claude mcp add-json myntop '{"type":"http",
  "url":"https://ntopng.example.ch/lua/rest/v2/exec/llm/mcp.lua",
  "headers":{"Authorization":"Token XXXXXXXX"}}' --scope user
An assistant can then ask natural-language questions (“Which hosts queried malicious-domain.com in the last 24 hours?” or “What are the top hosts that triggered alerts on transit interfaces?”) and receive answers derived from live Lua API calls against the flow/alert database — with follow-up reasoning (e.g., investigating why specific hosts were flagged as NTP attackers) handled conversationally.
2. nAnalyst, a built-in analyst chat with a local LLM. Rather than depending on an external assistant, ntopng ships nAnalyst, which runs against a local model (the deck shows Qwen3.8-27B) and exposes:
- A query history panel and investigation evidence panel showing the exact tool-call sequence executed (database access, SQL generation, chart drawing) for auditability.
- Visible internal reasoning — the model’s stated plan for mapping a natural-language question to a SQL query against the flows table, including how it decides to filter by
INTERFACE_ROLE, aggregate by ASN, and pick a chart type. - Multi-language support — the same demo asked “What are the top 10 ASNs in inter-network media traffic in the last hour?” in Greek and received a correctly localized, correctly computed answer.
- Expert-style narrative output, not just numbers: e.g. for a Google (AS15169) throughput chart, nAnalyst reports TX/RX ranges and averages, flags that outbound traffic dominates inbound with an unexplained spike, and proposes concrete next steps (“break down Google TX by application to see which nDPI protocol — TLS, QUIC — is driving the spike”; “identify the top client hosts generating that traffic”).
Use Case: Playbooks for Repeatable Investigations
Beyond ad hoc chat, ntopng lets operators codify recurring investigative logic as playbooks, natural-language descriptions that are compiled by an LLM into a multi-stage SQL pipeline and re-run on demand or on a schedule. Example prompt: “Alert me if TLS traffic on transit interfaces exceeds peering interfaces. If so, tell me which ASNs are responsible for the problem.”
The generated playbook in the demo compiled to three stages:
- Interface Volume Comparison — aggregate TLS (
L7_PROTO=91) byte totals per interface role (transit vs. peering vs. other) over a given time window. - Top Transit Source ASNs — drill into the source ASNs driving the transit volume.
- Top Transit Destination ASNs — same, for destination ASNs.
Each stage is stored as auditable SQL (visible and editable before saving), with configurable parameters (time range, volume threshold in bytes) and can be executed on demand via an “Executor” view that shows per-stage row counts and results — turning what used to be a manual, recurring diagnostic task into a parameterized, repeatable pipeline.
Cost and Usage Accountability
Because every playbook run and chat turn consumes LLM tokens, ntopng includes a dedicated usage tracking view: total LLM calls, total tokens (prompt vs. completion), average response time, and cost broken down by provider, model and user — necessary once AI-assisted analysis becomes part of routine operations rather than an occasional experiment.
Takeaways
- Telemetry alone is necessary but not sufficient. Raw flow/BGP/SNMP data is a precondition for observability, not the end goal.
- Reasoning over the data is where the value is — dashboards and Sankey diagrams are useful, but turning them into decisions still requires either expert time or automated reasoning.
- ntopng’s flow + BGP/BMP + SNMP correlation provides the structured substrate; its REST/MCP APIs and playbook system provide the mechanism for AI agents (local or external) to consume that substrate directly.
- The stated direction is human-AI collaboration in NetOps: experts encode investigative know-how once as a playbook or prompt, and the system executes and interprets it repeatably, surfacing evidence rather than opaque conclusions.
Code repositories referenced in the talk: github.com/ntop, including ntopng and the nProbe BGP module. This work was presented as part of ntop’s 2026 summer tour of network operator groups (NOGs), including ITNOG, Interop Tokyo, GRNOG, NONOG and NOG.HR as described in this blog earlier this year.
Enjoy !