Modern network monitoring is no longer just about collecting data, it’s more about turning large volumes of time-series data into actionable insights. When enabling dump to ClickHouse, both for raw flow data and timeseries, users can build a highly scalable and flexible observability stack that goes far beyond traditional dashboards. In fact, in this post we explore the advantages of using Grafana to create custom dashboards on top of ntopng time-series data stored in ClickHouse.
From ntopng to ClickHouse: A Scalable Time-Series Pipeline
ntopng continuously generates rich time-series metrics, including:
- Interface traffic (bytes, packets, throughput)
- Per-host statistics
- Layer-7 protocol breakdowns
- Flow and application-level insights
- Quality of Experience
When configured with the ClickHouse driver, these metrics are stored in a centralized database designed for high-performance analytics. The ClickHouse integration in ntopng provides:
- High write throughput with batch inserts
- Efficient time-range queries via partitioning and ordering
- Automatic data retention
- Scalability through clustering and distributed deployments
All metrics are stored in a unified Influx-like schema with timestamps, tags, and metrics, making them ideal for flexible querying and aggregation.
Why Grafana on Top of ClickHouse?
Grafana acts as the visualization layer that unlocks the full value of ntopng data. Its architecture is data-source agnostic, meaning it can query ClickHouse directly and combine it with other sources if needed.
Unlike built-in dashboards, Grafana allows users to design tailored views for specific use cases, such as:
- Network operations (NOC) dashboards
- Security monitoring panels
- Capacity planning views
- Application traffic breakdowns
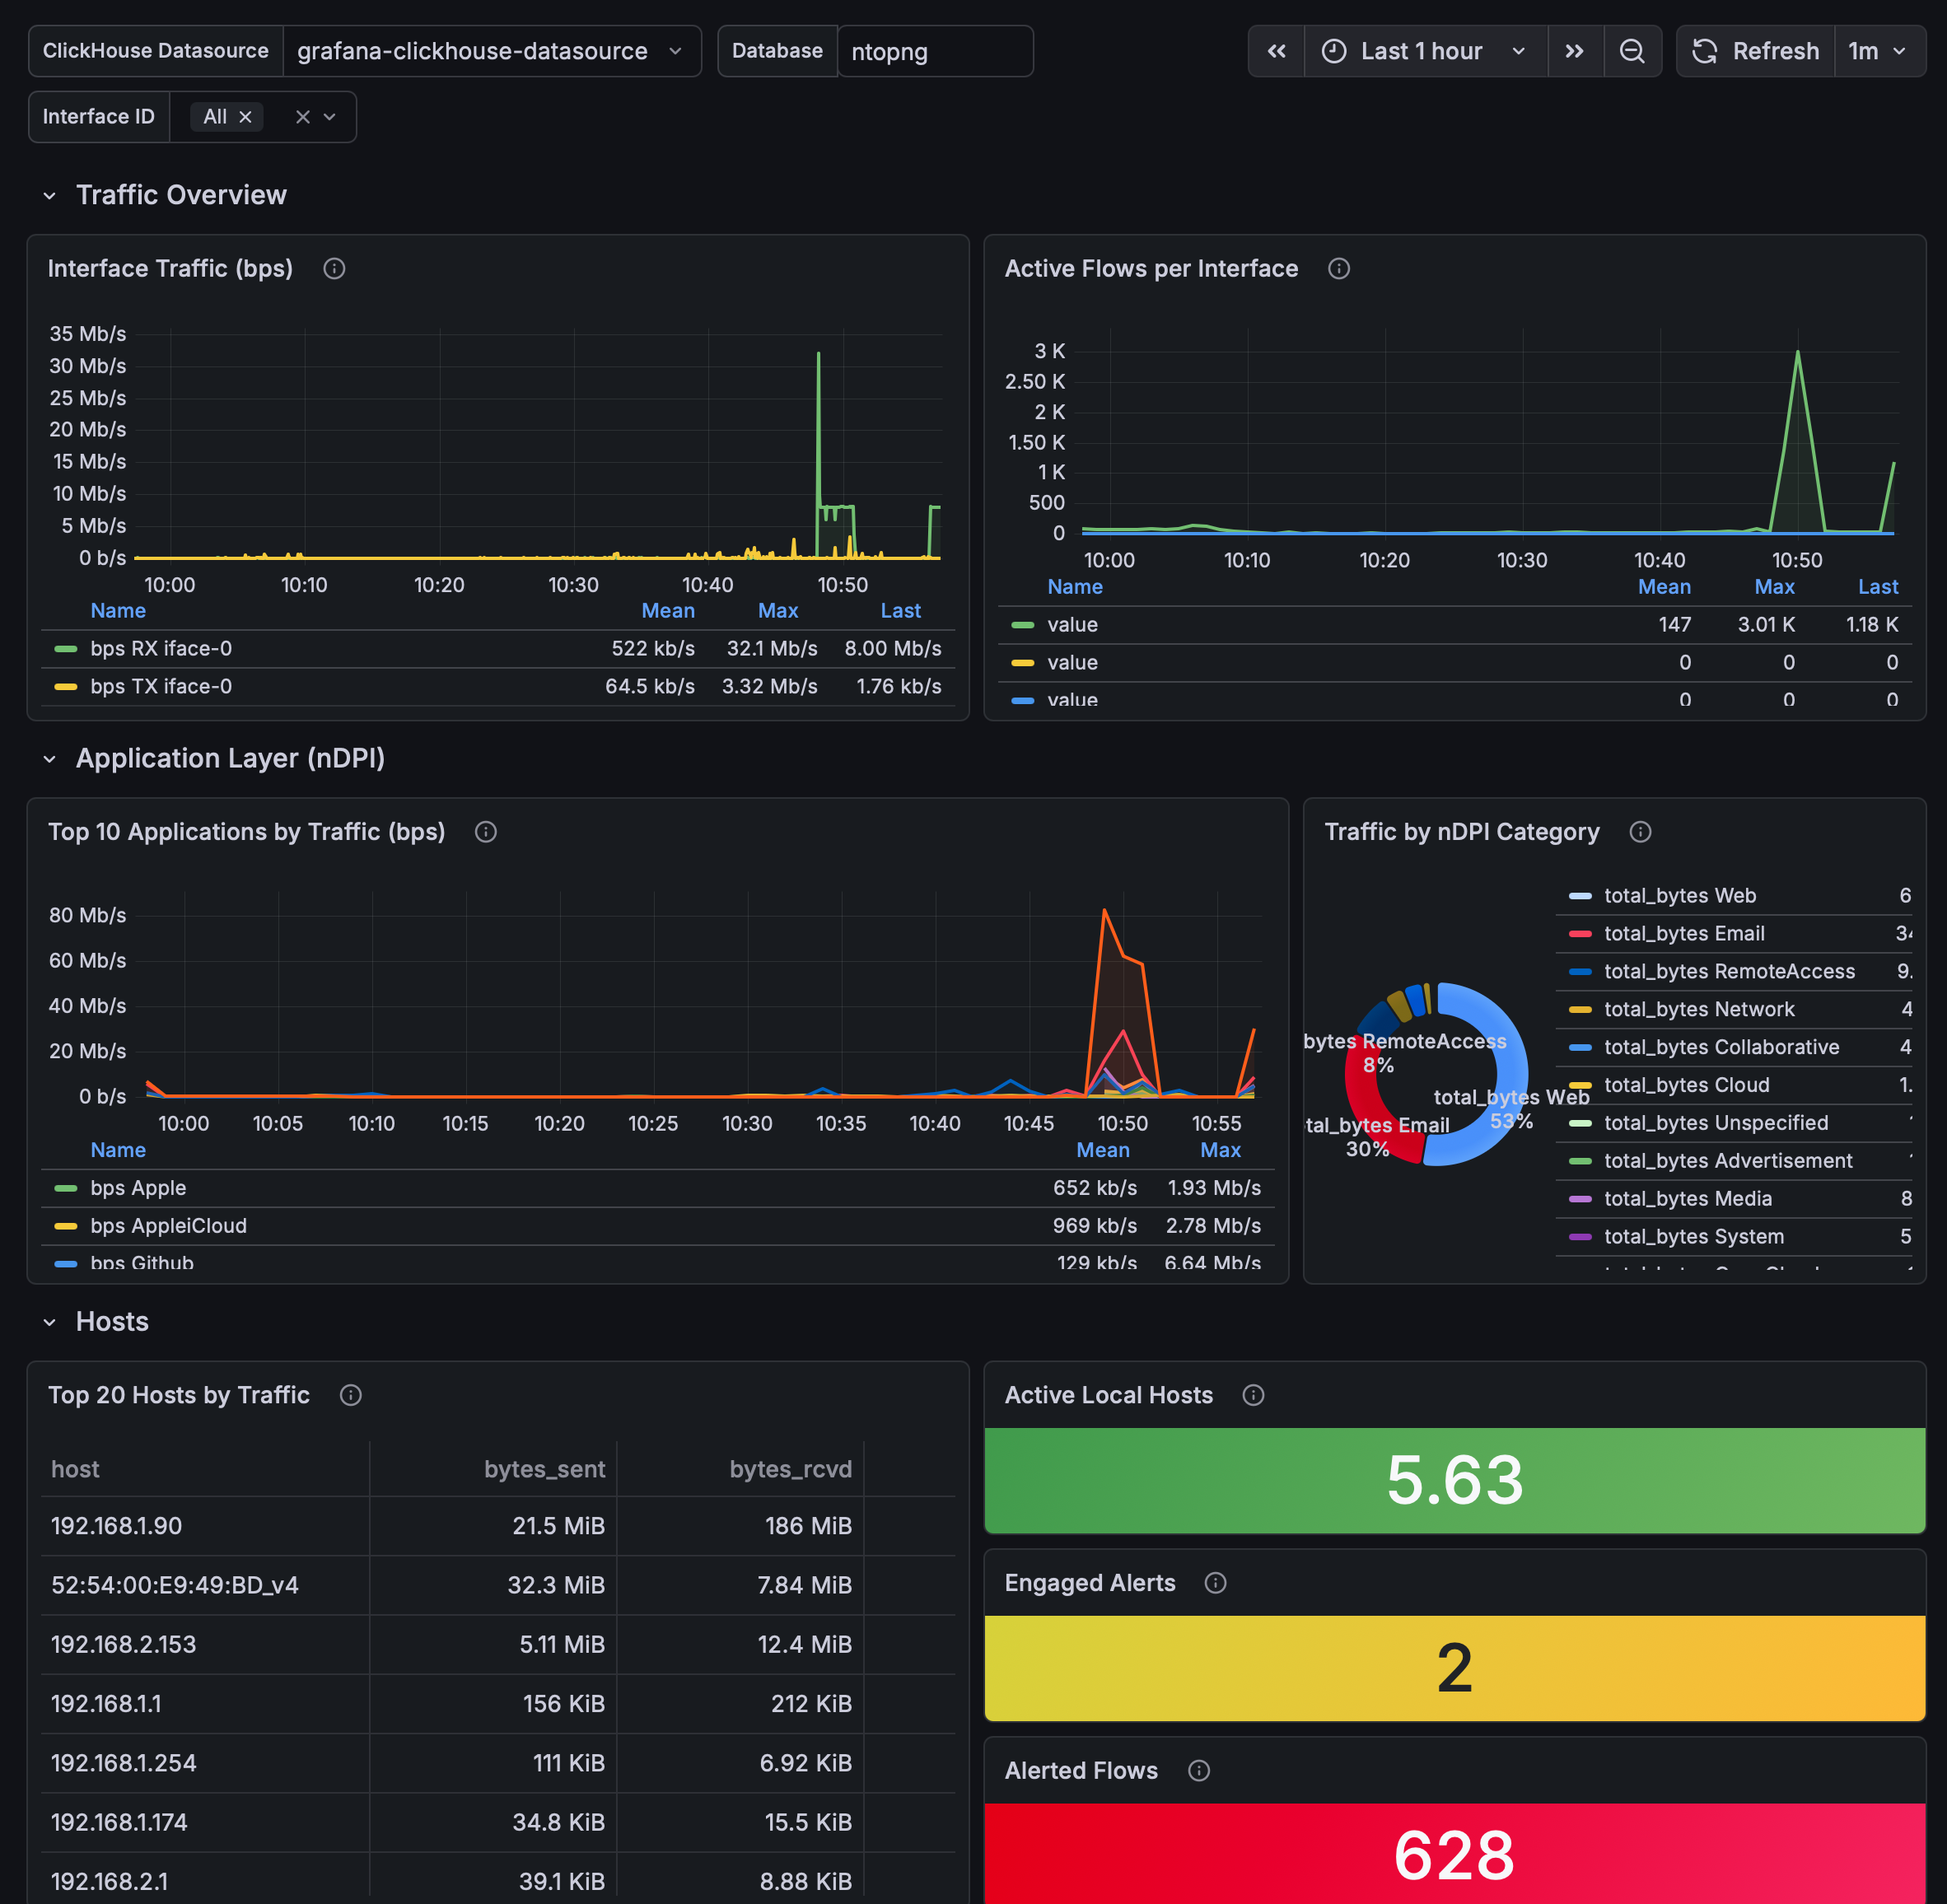
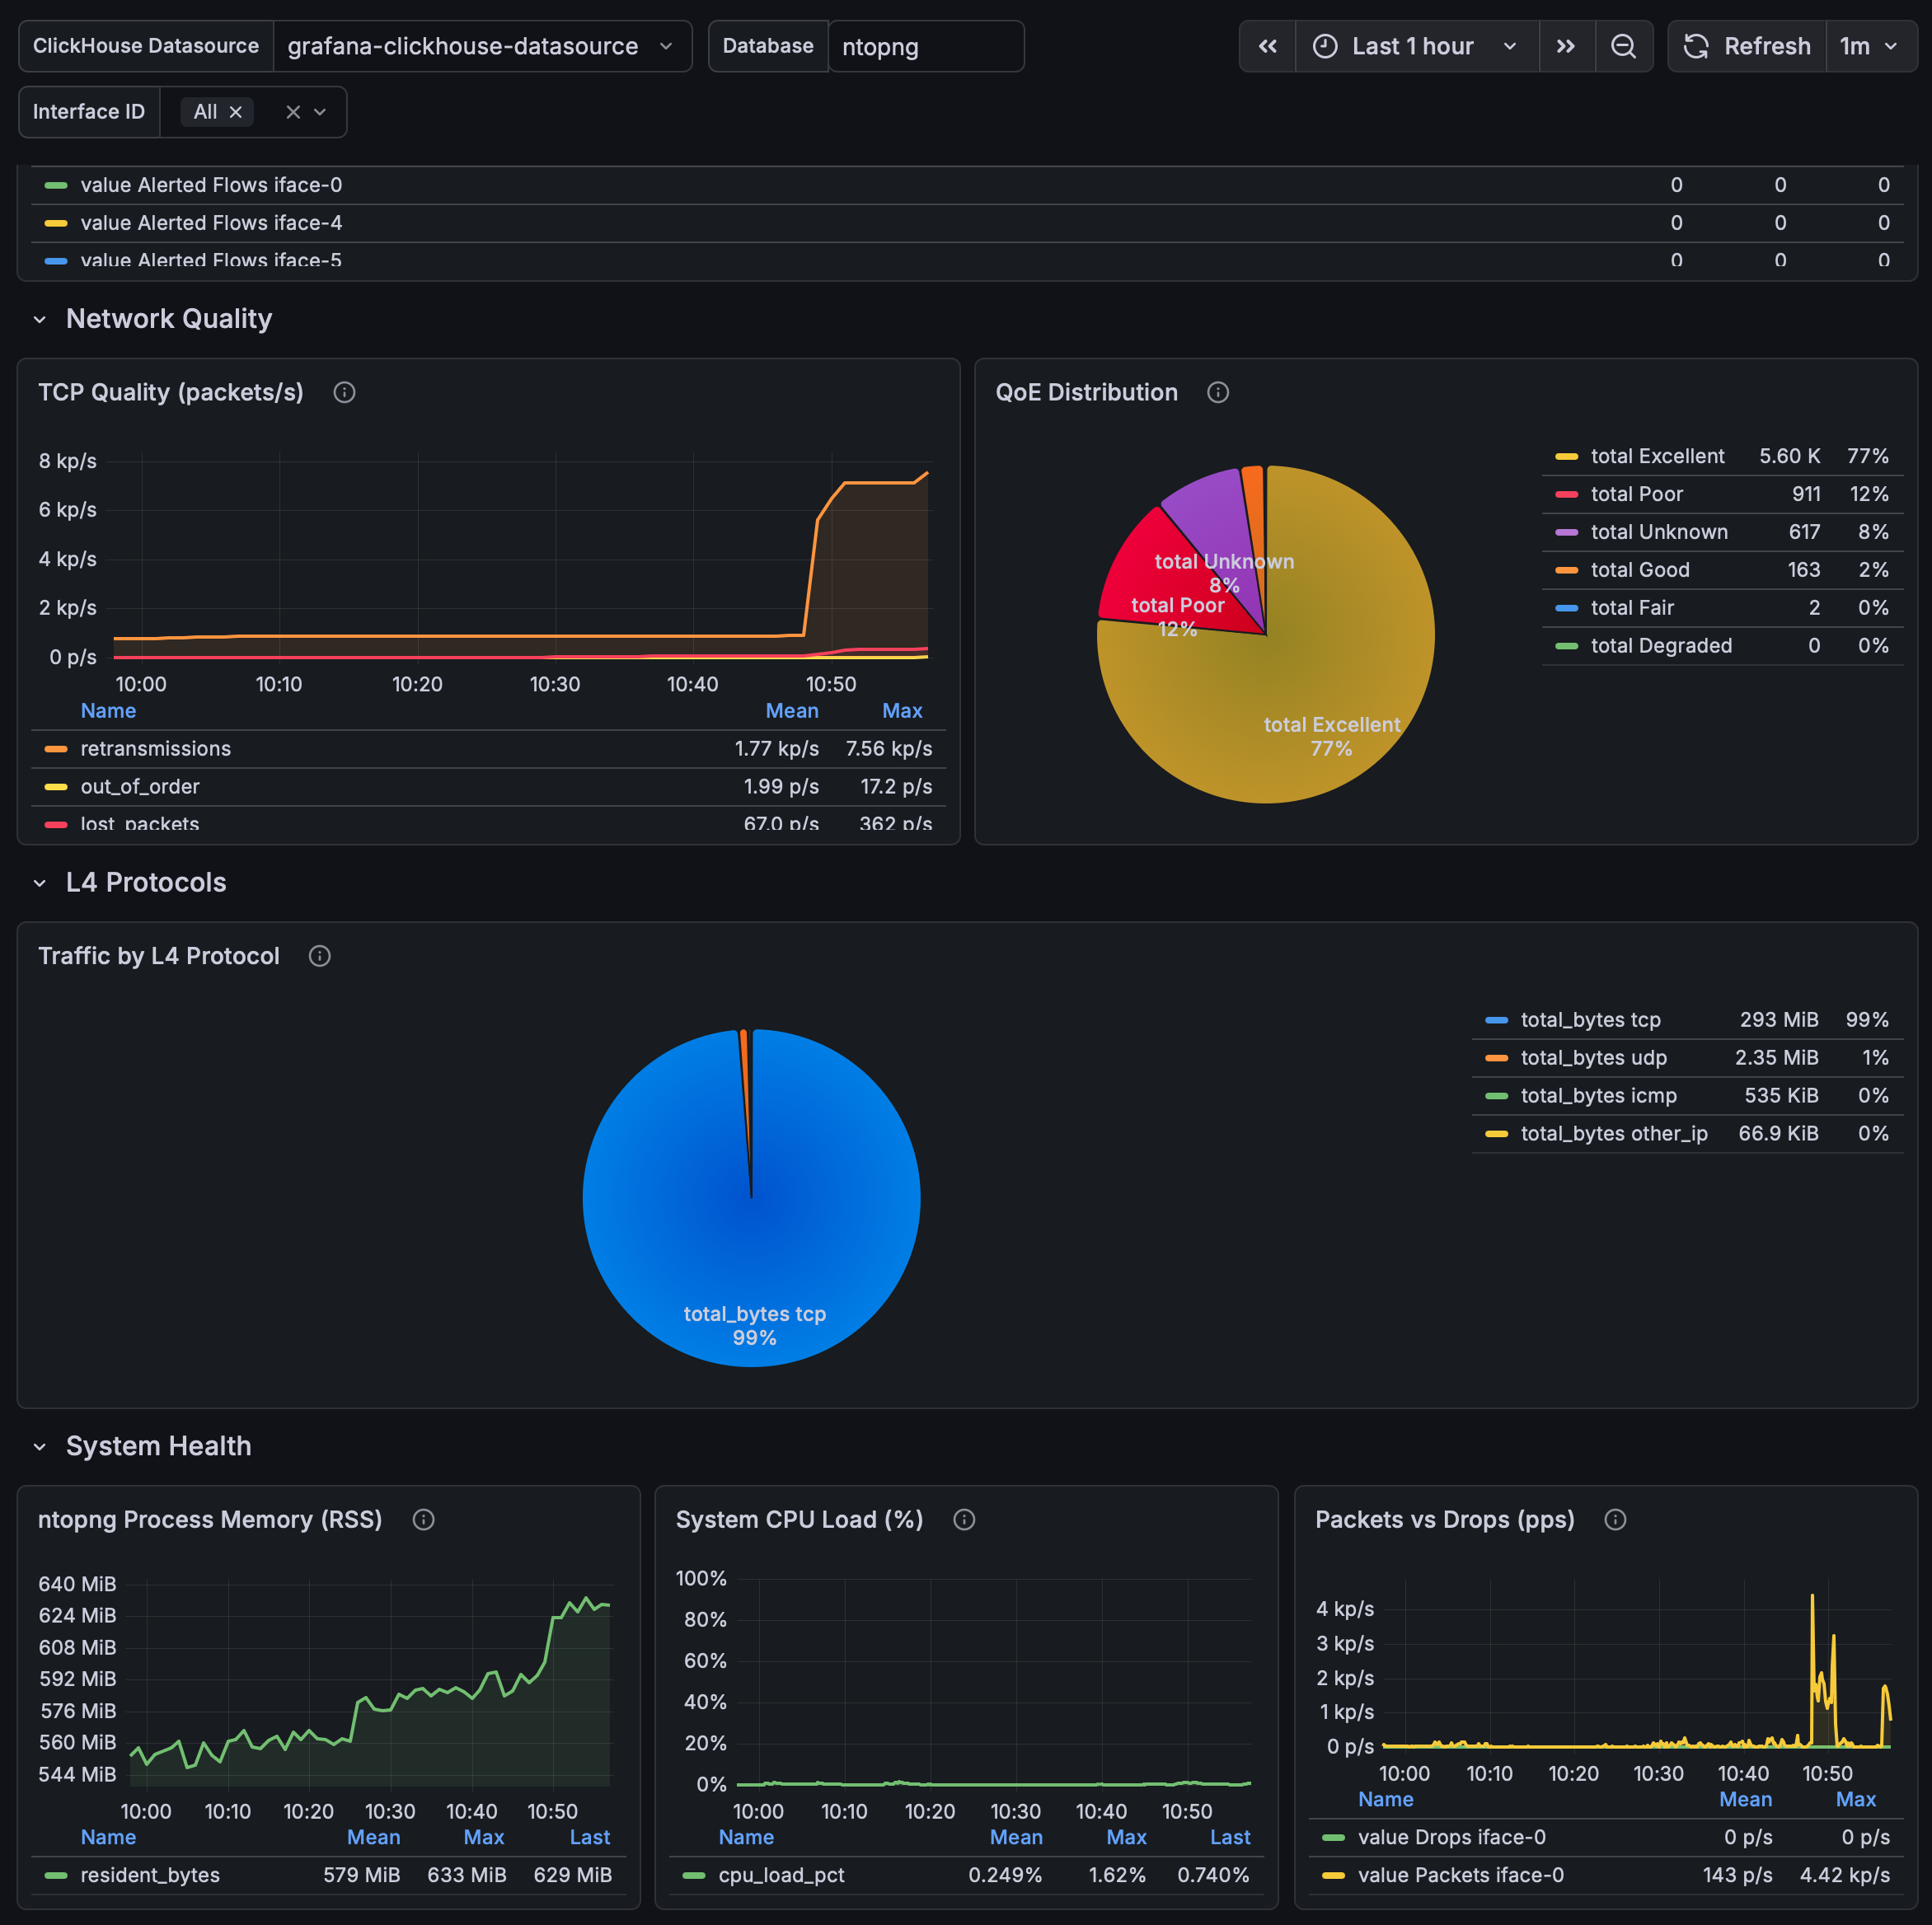
Each panel can visualize a specific time series (e.g., traffic rate, active flows), enabling precise control over how data is presented.
ClickHouse enables powerful SQL-based analytics on ntopng data:
- Aggregate traffic by protocol, host, ASN, interface, etc.
- Compute rates from counters and analyze trends over time
- Perform Top-K queries efficiently at scale
The Grafana query builder makes it easy to construct these queries and transform raw data into meaningful visualizations..
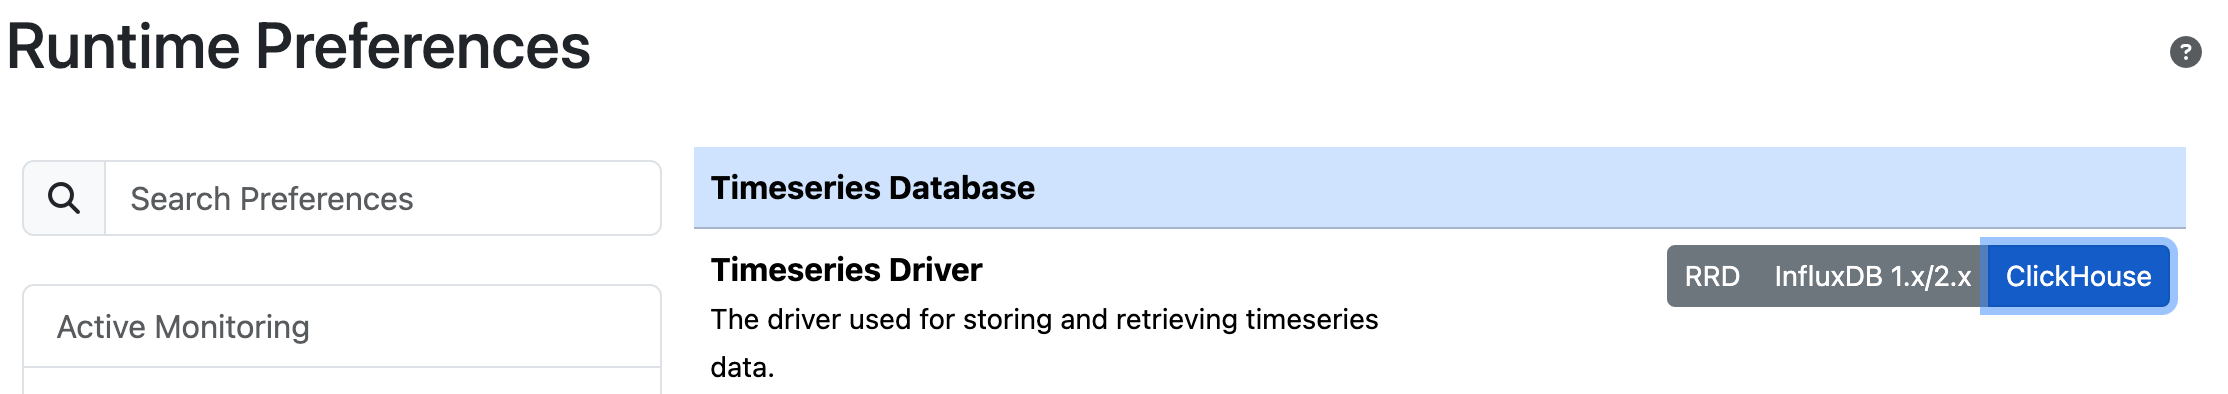
Grafana dashboards can be exported as JSON. ntopng already provides a sample dashboard that can be downloaded from the User Interface, under the Preferences page, and can be used as starting point to build custom dashboards.
In order import the dashboard into Grafana, download the JSON file and use the Grafana Import function (Dashboards → Import → Upload JSON file): this item is visible as soon as you have set the timeseries database preference to ClickHouse. This is a pre-defined dashboard that allows you to immediately use ntopng within Grafana in seconds.
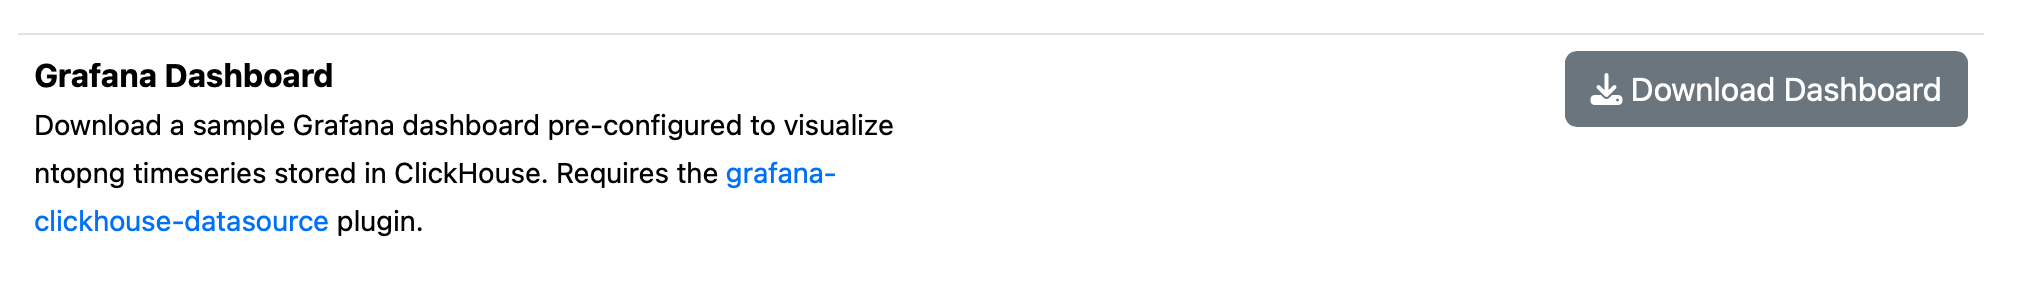
Please note the dashboard requires the grafana-clickhouse-datasource plugin to be installed in Grafana. Once installed, configure a ClickHouse data source in Grafana pointing to the same server and database used by ntopng, then import the downloaded JSON file.
Using Grafana on top of ntopng time-series data stored in ClickHouse provides a powerful, flexible, and scalable monitoring solution.
- ntopng generates rich, high-frequency network metrics
- ClickHouse stores them efficiently and enables fast analytics
- Grafana turns them into custom, interactive, and actionable dashboards
This combination allows organizations to move from simple monitoring to data-driven network intelligence, adapting dashboards to their exact operational and business needs.
Enjoy!