Interface
The Interfaces dropdown menu entry in the top toolbar contains lists all the interfaces that are currently monitored by ntopng. Among all interfaces listed, one has a check mark that indicates the interface is currently selected. A special interface is always present in ntopng, the System Interface. Most of the data and information shown in ntopng web GUI is related to the currently selected interface. Any interface listed can be selected simply by clicking on its name.
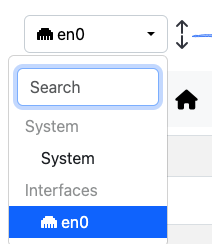
The Interfaces Dropdown Menu
The dropdown menu is only used to switch between selected interfaces, it is also used to actually see interface traffic statistics. Interface traffic statistics can be accessed by clicking on the currently selected interface.
Note
See the available Network Interfaces types here
The Home View of the Interface Details Page
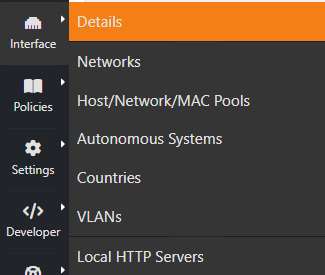
A contextual menu with multiple options and badges appear right below the top toolbar. Menu entries are discussed below.
Home
In the Home page it is possible to view general interface information, such as Id (a unique integer identifier ntopng assigns to each monitored interface), family (e.g., pcap), and the overall traffic counters in bytes. It is possible to customize the interface name just by writing a custom name into the Name textbook and clicking on “Save Name”. Interface monitoring can be temporarily paused from the ‘State’ toggle buttons.
Packets
Packets page shows a pie chart of packets size distribution.
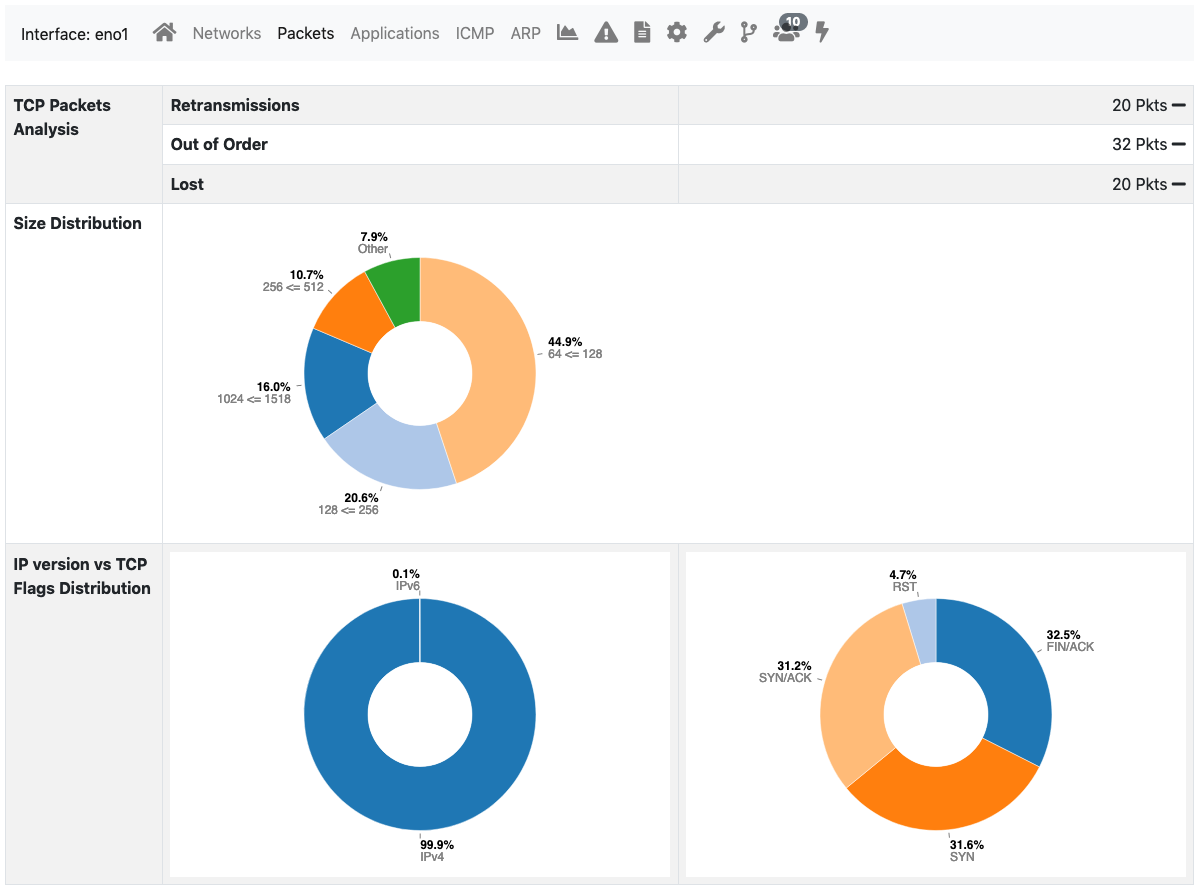
The Packets View of the Interface Details Page
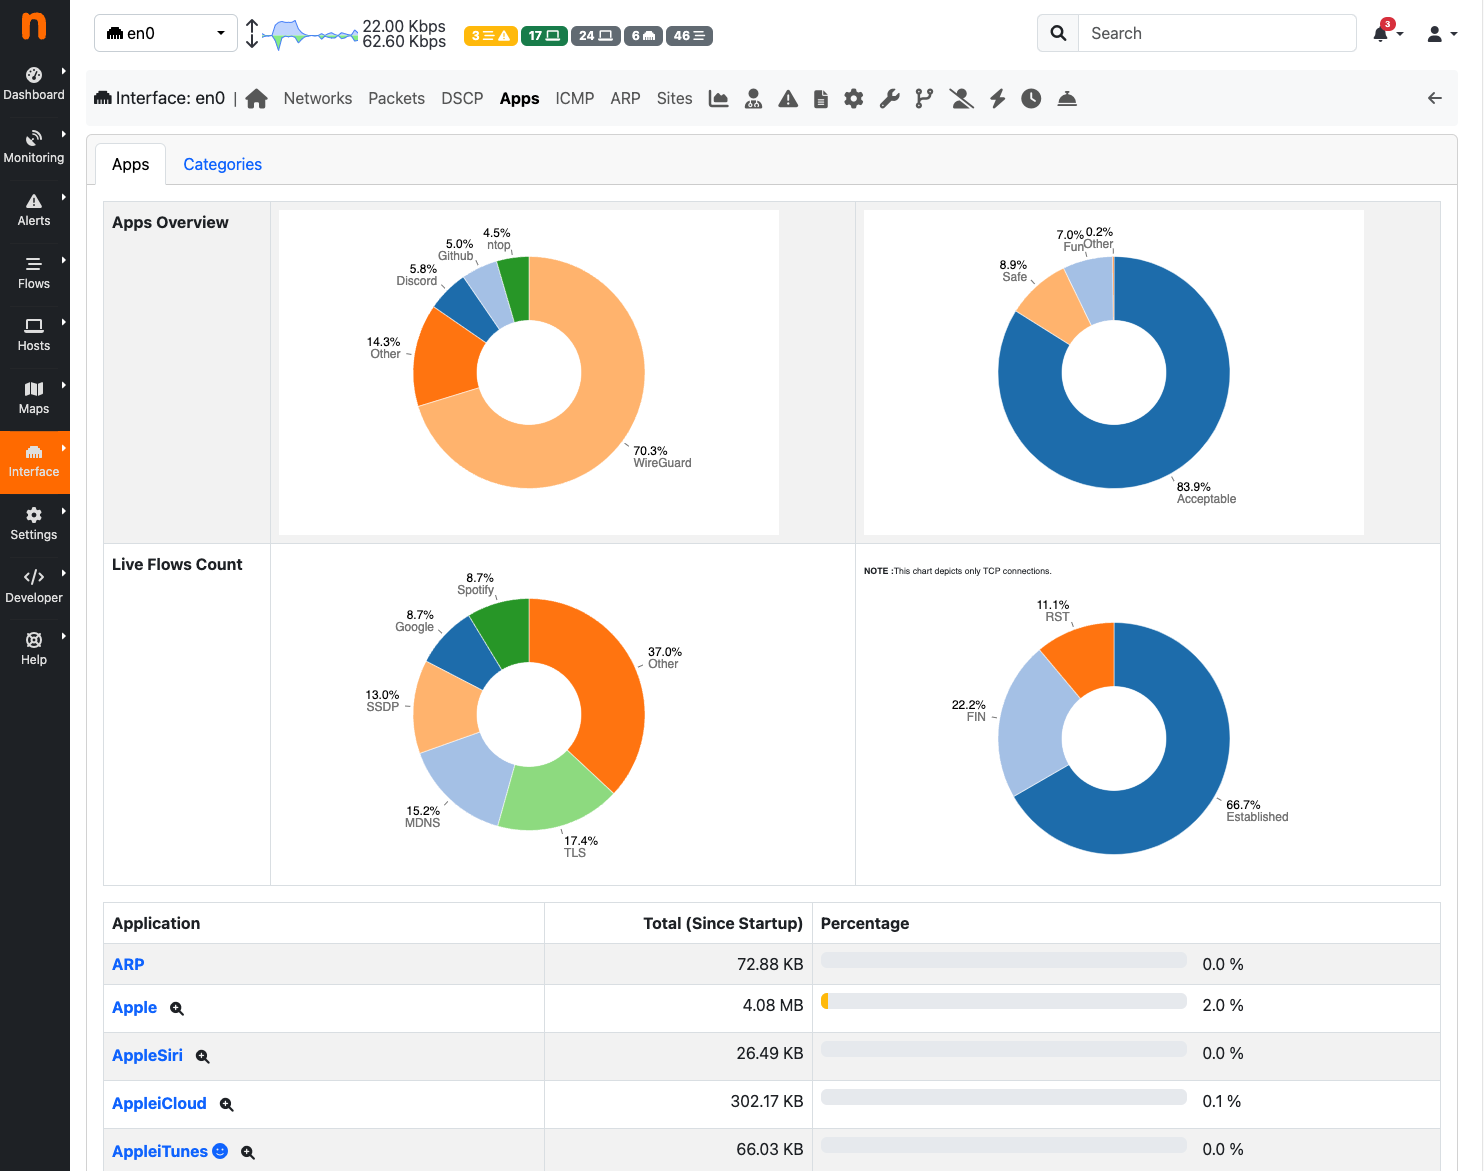
Applications
Applications page provides three pie charts and a specific table with nDPI-detected protocols for the selected interface.
In the two top pie charts ntopng shows the application distribution and its categorization. The bottom pie chart shows nDPI-detected applications for currently active flows. All labels are clickable and point to detailed statistics pages. Belo pie charts there is a list of protocols detected with the corresponding total traffic, both in absolute terms and as a percentage of the total traffic. By selecting any Application Protocol, it is possible to display a statistics page with temporal charts for that protocol. Similarly, by clicking on the magnifying lens icon, it is possible to display all active flows for that protocol.
The Protocols View of the Interface Details Page
ICMP
ICMP page shows overall interface ICMP statistics.
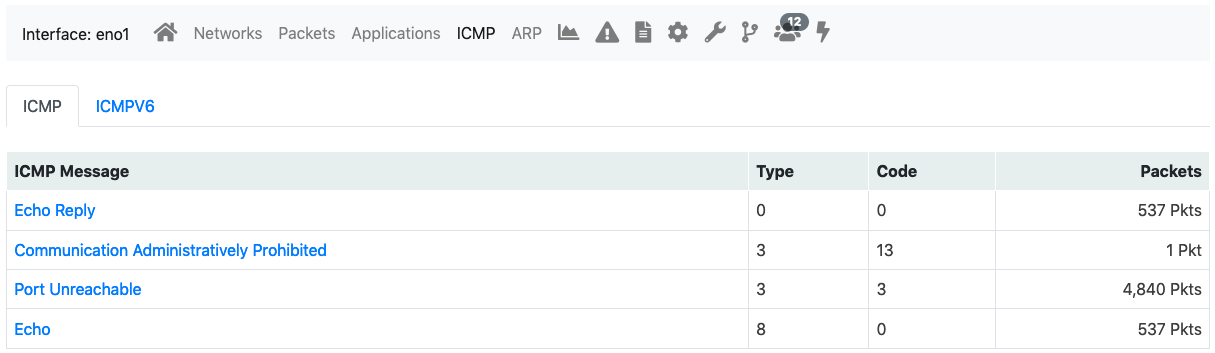
The ICMP View of the Interface Details Page
ARP
The Address Resolution Protocol (ARP) page highlights the number of ARP requests and replies seen.
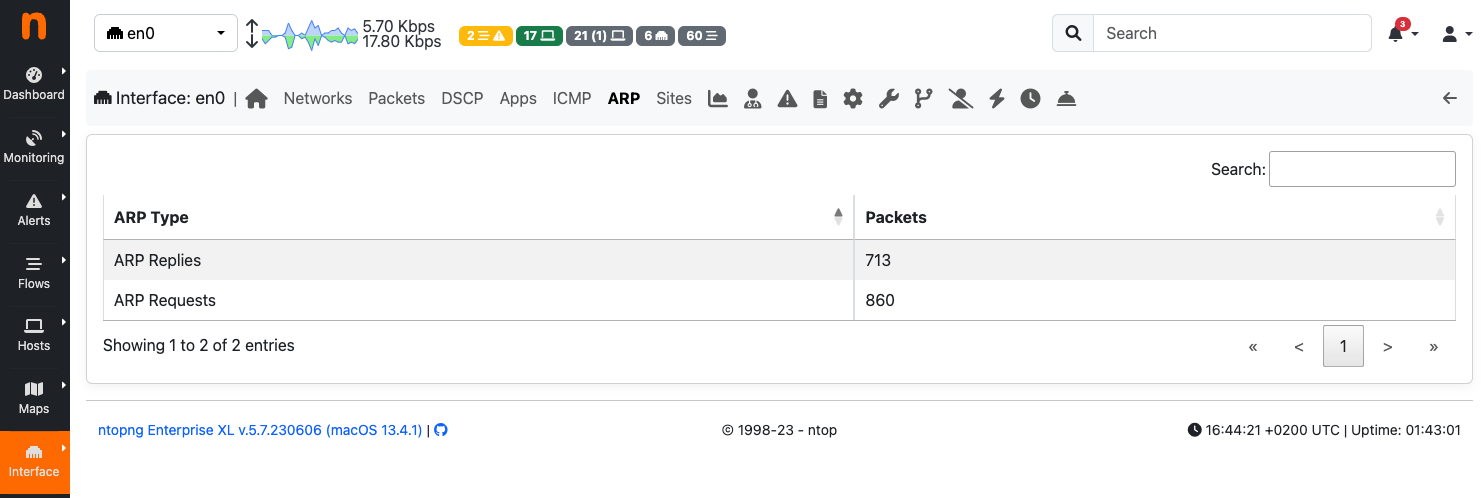
The ARP View of the Interface Details Page
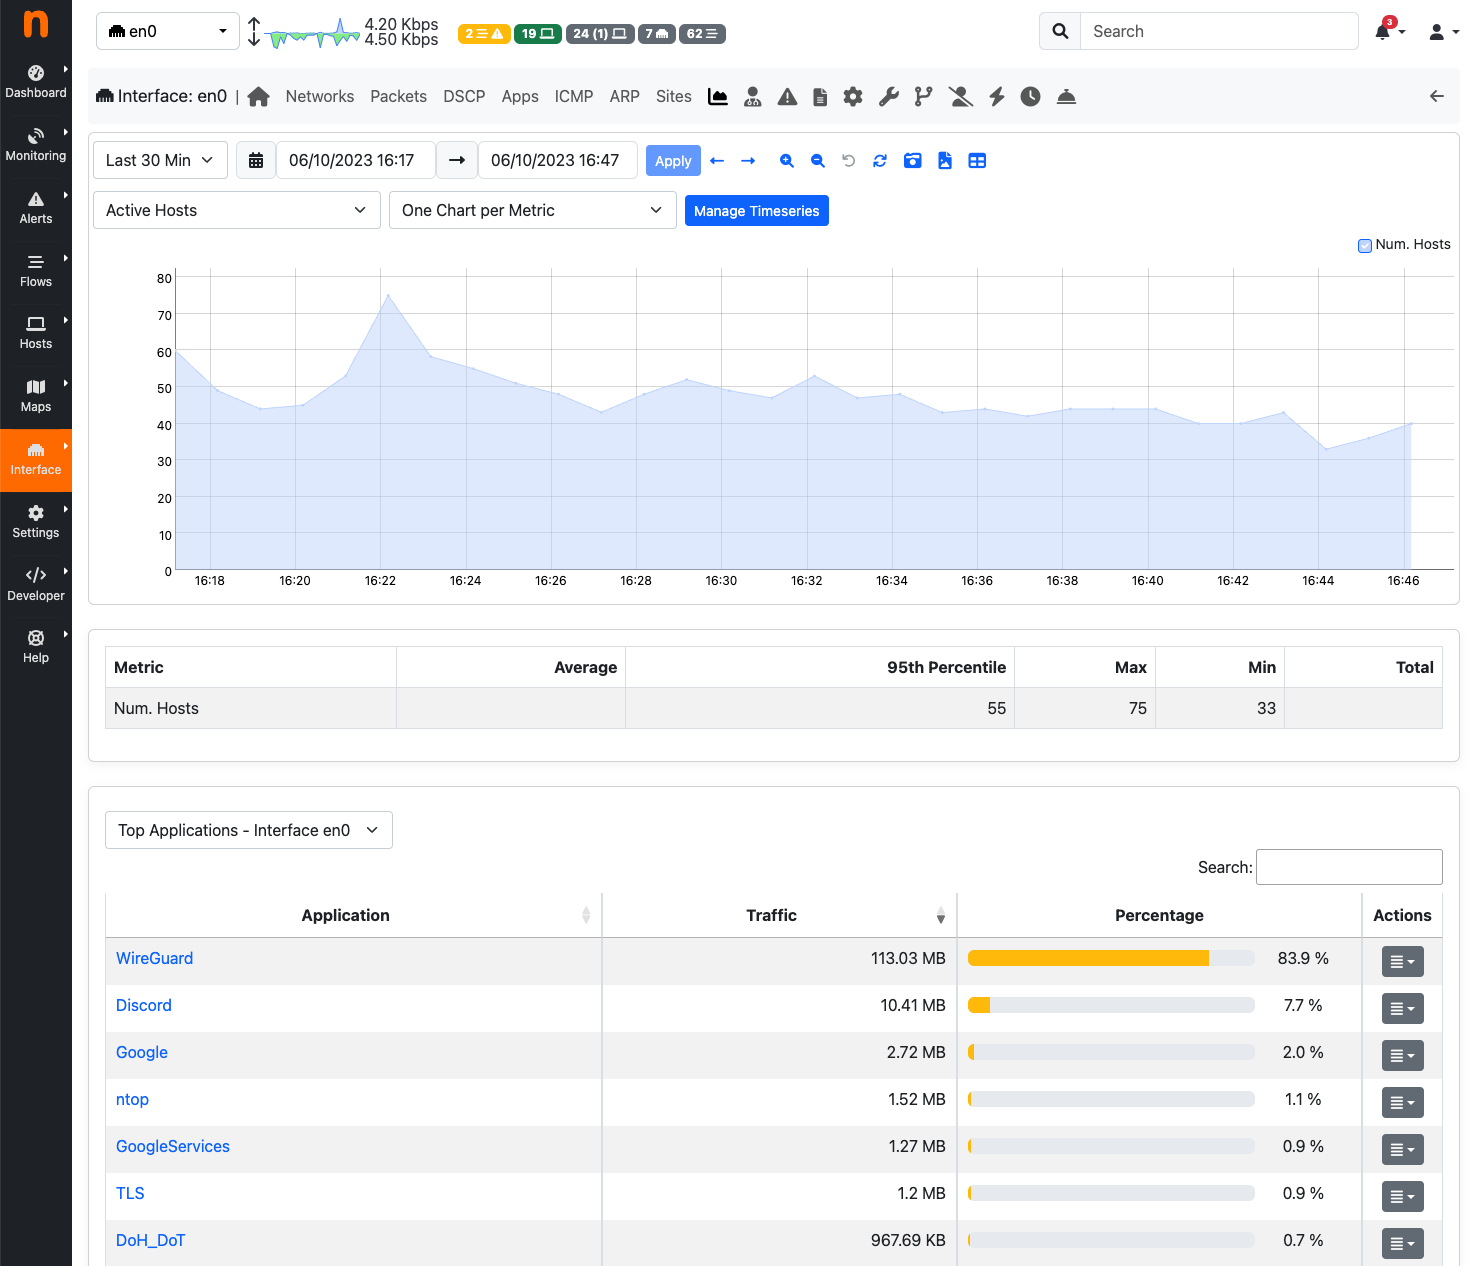
Statistics
Statistics page provides historical traffic statistics for the selected interface. The user can choose to filter statistics on a protocol basis and display data in several formats (e.g., bytes, packets, flows, and so on). In the Professional Version of ntopng, traffic for interface views in shown as stacked per physical interface. Physical interface visualization can be toggled by clicking on the coloured dot just left of interface name.
The time series span can be adjusted by selecting values from 5 minutes up to 1 year. Moreover, drill- down is possible by clicking on the time series itself. Every click zooms the chart in, centering the time series around the clicked point.
In addition, time series shown can be chosen via the dropdown menu labelled ‘Time series’. For example, it is possible to visualize all or just one protocol, traffic, packets, active hosts and flows, and so on. Ntopng is VLAN aware, hence if several VLANs are detected, traffic is accounted also on a VLAN basis.
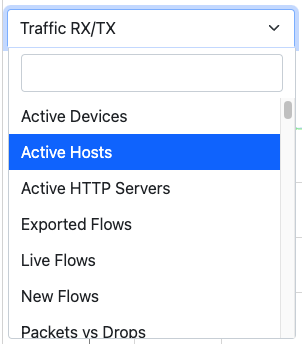
The Dropdown Time Series Menu in the Statistics View of the Interface Details Page
The Statistics View of the Interface Details Page (Professional Version)
Historical interface minute top talkers are shown on the right of the page, and get refreshed automatically when the mouse moves over the chart.
An historical “Flows” tab is present next to the “Chart” when ntopng is started with the -F switch to export flows to MySQL. This historical table shows flows data that have been recorded and dumped during the selected observation period. The Professional/Enterprise version of ntopng also feature two extra tabs, namely, “Talkers” and “Protocols” to drill down historical data by talkers and application protocols.
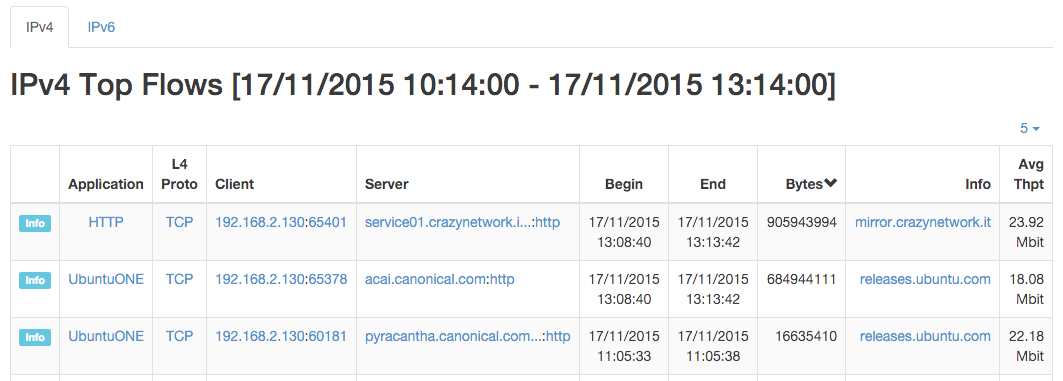
The Historical Flows Table of the Interface Details Page Statistics View
Traffic Profiles (Professional Version)
See later in this manual for more information.
Settings
The settings page allow the configuration of several interface properties.
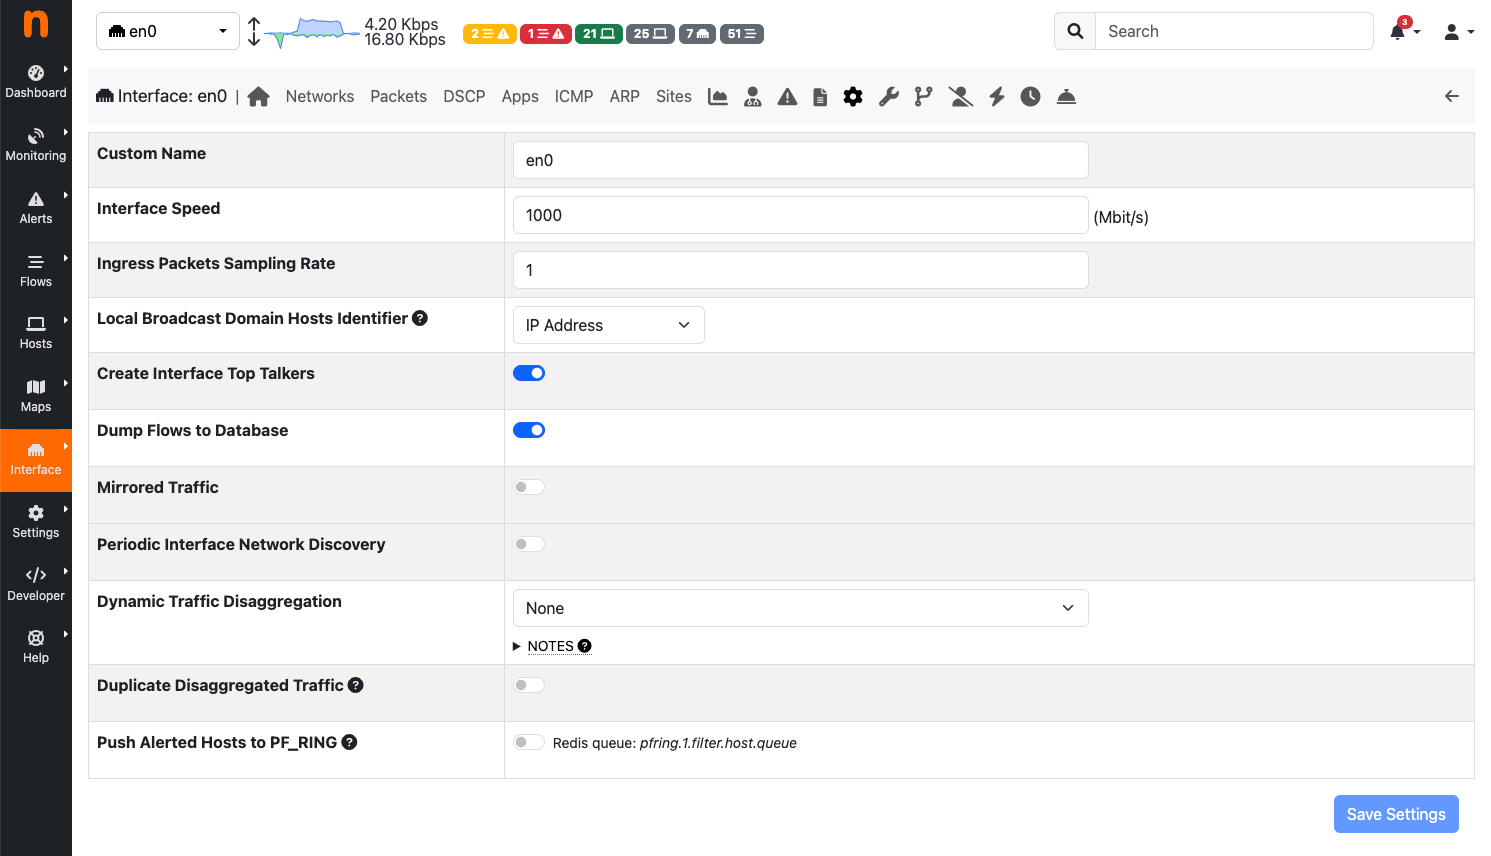
The Settings View of the Interface Details Page
Custom Name: Is a label used to identify the interface.
Interface Speed: The speed of the interface expressed in Mbps. Typically, ntopng is able to properly determine this speed automatically.
Realtime Stats Refresh Rate: Amount of time between two consecutive refreshes of dashboard and footer charts. Useful for example when using ntopng in combination with nProbe to collect remote NetFlow of sFlow.
Ingress Packets Sampling Rate: Packets arriving on the interface could have been sampled upstream, for example by a packet broker or another device. This setting allows to specify the sampling rate to enable ntopng to perform proper upscaling.
Local Broadcast Domain Hosts Identifier: Determines if Local Broadcast Domain hosts whose IP address is inside a configured DHCP range are serialized by their MAC address or IP address. This setting also applies to the timeseries of the host. In a DHCP network, the IP address of a host usually changes so the host it’s better identified by its MAC address in this case.
Create Interface Timeseries: This setting toggles the generation of timeseries for the selected interface. No timeseries will be generated when this setting is unchecked, including timeseries associated with local hosts and networks.
Create One-Way Traffic Timeseries: This setting toggles the generation of timeseries for one way traffic, which are otherwise ignored. Can be disabled to save disk space.
Create Interface Top Talkers: This setting toggles the creation of top talkers hosts, which are then shown into the ntopng report.
Dump Flows to Database: This setting specifies on which interfaces the flows dump (-F startup option) is enabled. Disabling the flow dump on some interfaces can reduce the disk load.
Mirrored Traffic: Tick this setting when the interface is receiving traffic from a mirror/SPAN port. Typically, such interfaces does not have any IP address associated. ntopng uses this information to skip certain kind of activities that cannot be performed on mirrored interfaces, including network device discovery and eBPF events processing.
Flows-only Interface: This setting provides a performance boost by disabling the hosts allocation on the interface. However this means that the per-host traffic will not be accounted.
Periodic Interface Network Discovery: This setting toggles ntopng periodic network discovery. Network discovery frequency can be controlled from the preferences and it defaults to 15 minutes.
Dynamic Traffic Disaggregation: Controls the interface disaggregation as explained in the Interfaces Disaggregation section.
Duplicate Disaggregated Traffic: When the Dynamic Traffic Disaggregation option is set, normally ntopng will only report the traffic on the disaggregated interfaces, hence the main interface will have no traffic. By enabling this option it’s possible to also report the traffic on the main interface.
DHCP Range
When a DHCP server is active in the network monitored by a network interface, it’s advisable to configure in ntopng the ranges of IP addresses which such server can assign.
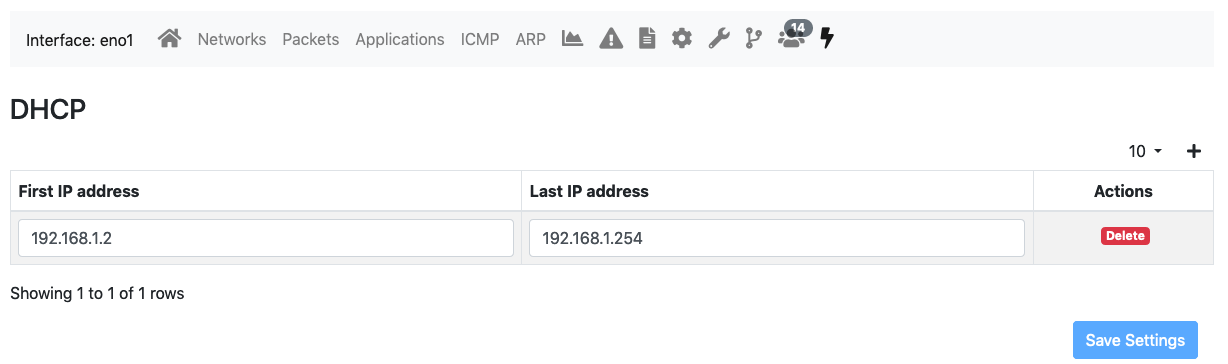
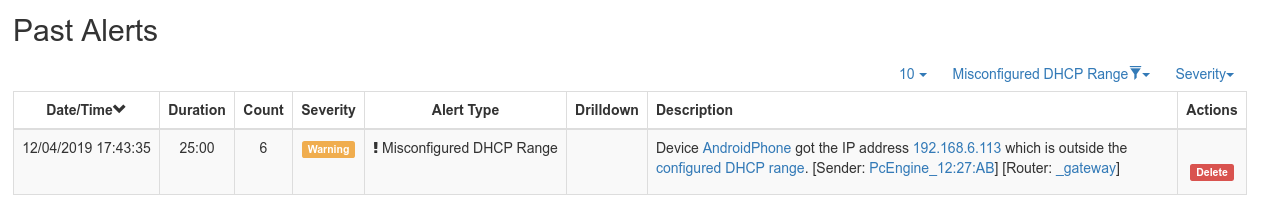
When a DHCP range is configured, ntopng will monitor the DHCP traffic on the interface and report anomalous behavior. For example, it detects if IP addresses are assigned outside the configured range and generate an alert. This can happen, for example, if a new misconfigured network device is attached to the network.
Since DHCP responses are usually directed to a specific host, this setting is most effective when the interface monitors mirrored traffic.
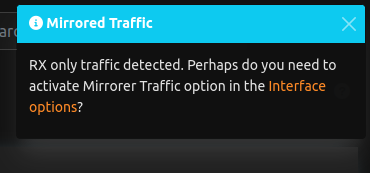
Mirrored Traffic
The Alert notifies the user to enable mirroring when the system detects RX only. The toast is going to show only if the user has RX-only traffic (TX traffic is 0 and RX is greater then 0). It’s still a dismissable toast (if you click dismiss, it’s not going to pop-up again) and you can jump to the interface configuration by clicking the link in the toast.
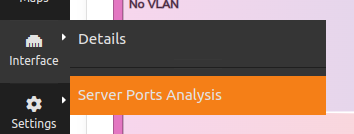
Server Ports Analysis
By jumping to the Server Ports Analysis entry, available in the Interface entry, it’s possible to jump to this page.
Note
Server Ports Analysis is available only with Enterprise license
This page is used to understand which server ports are currently in use in the current Interface.
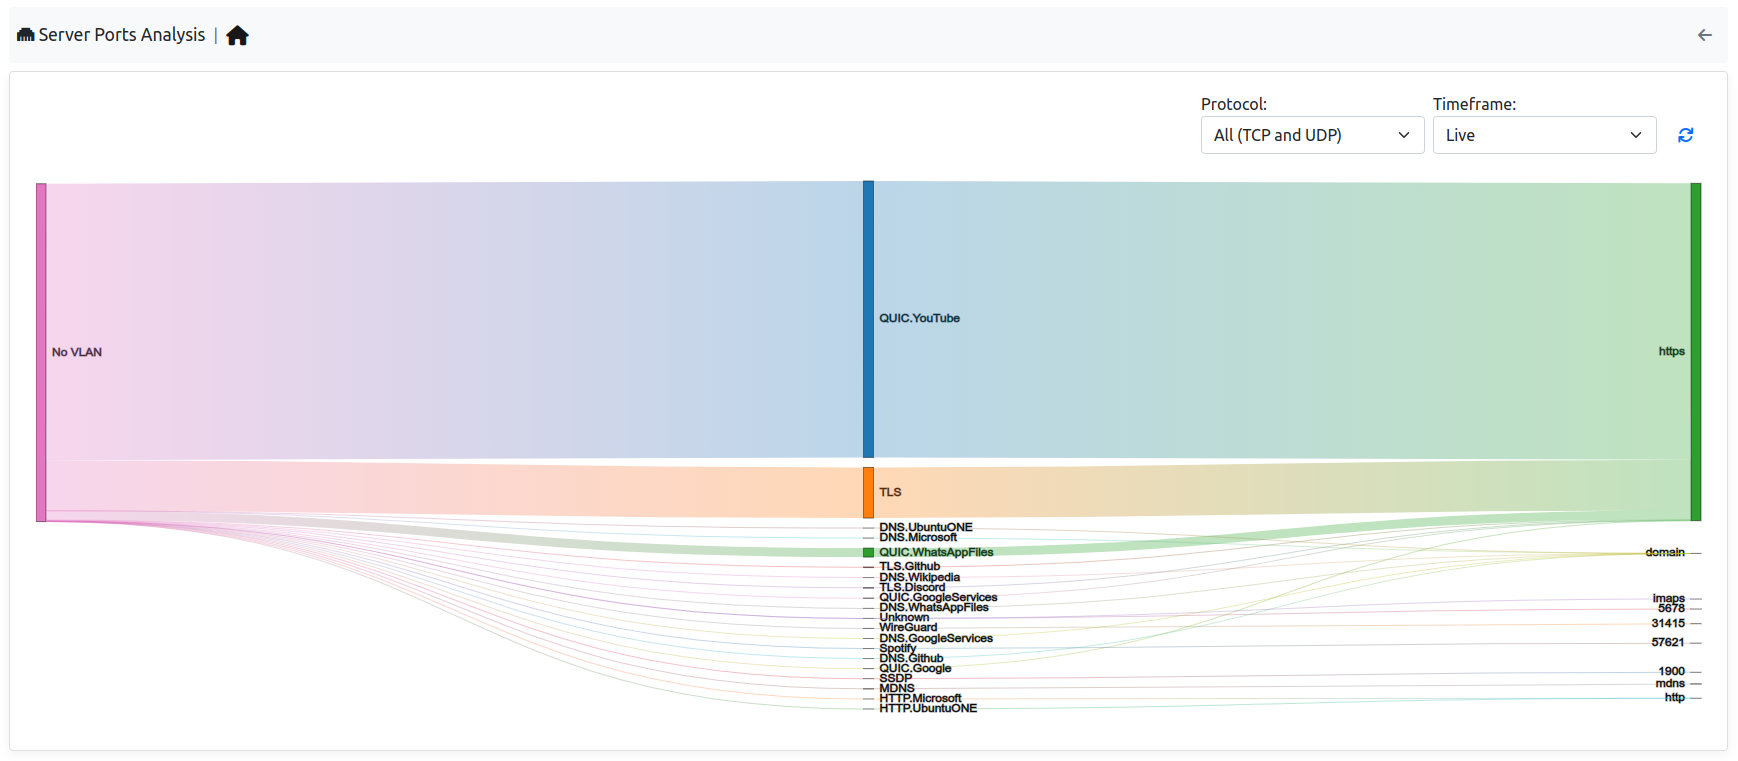
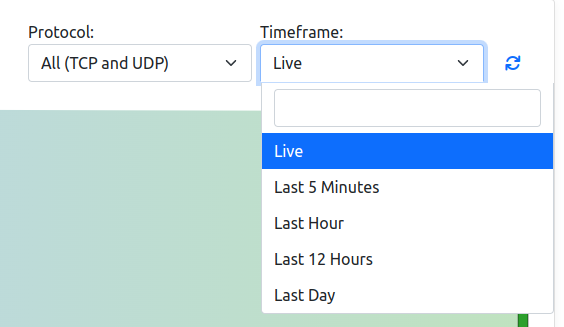
On the left side of the map, there are the VLANs that currently have traffic on some server ports, in the center instead the protocol can be found and on the right, the server port used. It’s possible add some filters by selecting the entries available in the right upper part of the table. Moreover if ClickHouse is enabled, it’s possible to change the timeframe and not only take a look at the live traffic but even at the historical traffic.
When clicking on the port, protocol or VLAN names available in the map, the user is going to be redirected to the requested flow page with the requested filter.
(e.g. The user click on the QUIC.Youtube protocol, the user is going to be redirected to the live traffic with QUIC.Youtube traffic; if the user was instead taking a look at historical data, the user was going to be redirected to the historical page with the selected timeframe and protocol).