SNMP is the de-facto protocol for monitoring network devices. Using it, it is possible to monitor “how much” a link is used. What is missing is “how” a link is used. Namely if my Internet link is full, what is the device, protocol, application that is using it? ntopng was created to answer this question and see in realtime what happens on a network interface.
In this blog post we will show you how to combine network interface usage monitoring with traffic analysis. Flow-based protocols such as sFlow and NetFlow/IPFIX allow network traffic to be measured while providing contextual information about the SNMP interface Id on which such traffic was observed. ntopng can SNMP poll network devices and ready interface counters as well speed. Interface usage is a simple proportion between between the traffic metered via sFlow/NetFlow/IPFIX and the interface speed. In this case the interface speed is read by default from SNMP (if configured in ntopng for this flow exported device) and it can be customized by the use by setting a custom speed, as sometime the physical and actual interface speed are different. For instance you are connected to the Internet with a 1 Gbit ethernet link (SNMP) but your contract has a cap of 100 Mbit (speed to be used when computing interface usage.
The rest of this post shows you how we have enhanced ntopng to compute interface usage. Now it’s possible for each Flow Exporter (probe) interface, to specify the uplink and downlink speed by overriding (if necessary) the interface speed as read by SNMP. In addition ntopng automatically creates containing the Interface Usage using on the traffic received/sent via NetFlow/IPFIX and the specified interface speed.
You can configure the uplink and downlink interface speed, by jumping to the Flow Exporters page and selecting the flow exporter we want to configure. Inside the exporter for the interfaces you can specify a custom speed.
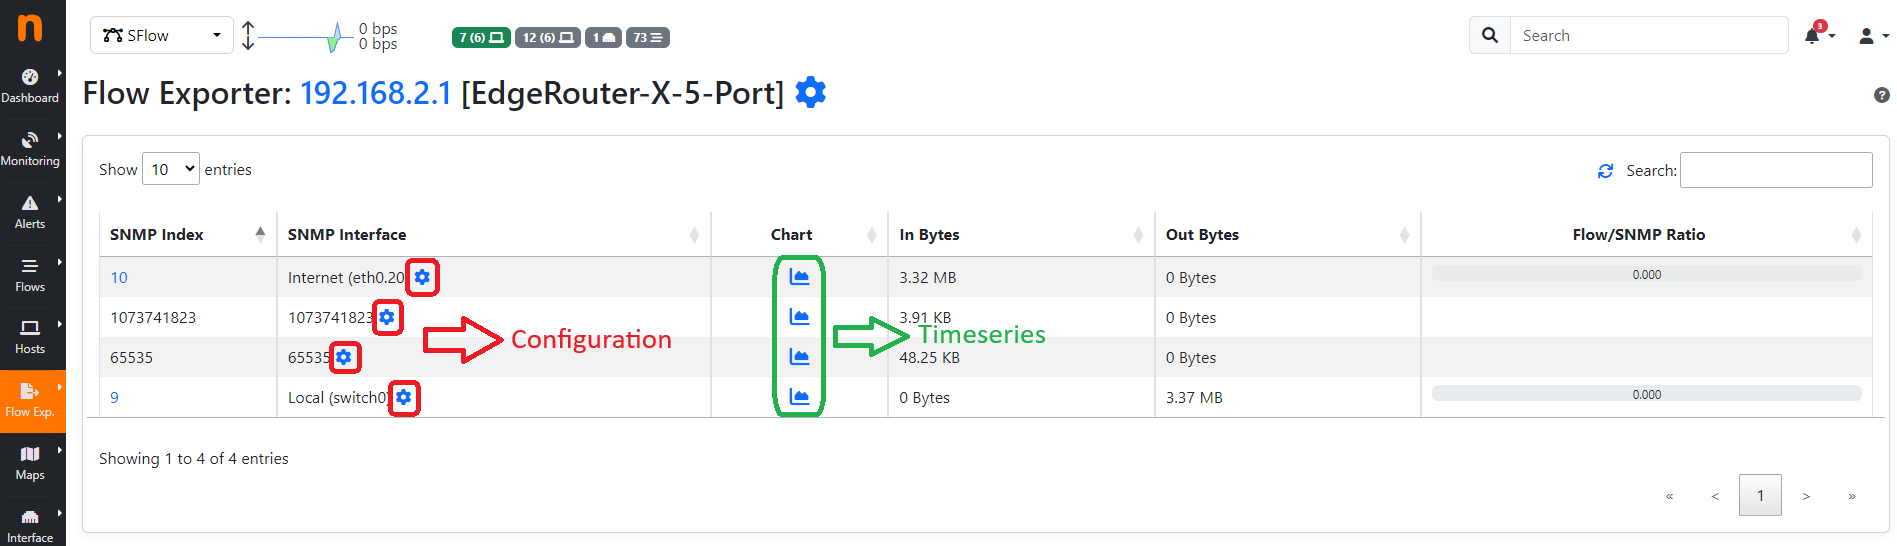
Next to the interface Id, there is a cog icon (wheel), click there to jump to the Interface configuration page, where we can configure a custom speed.
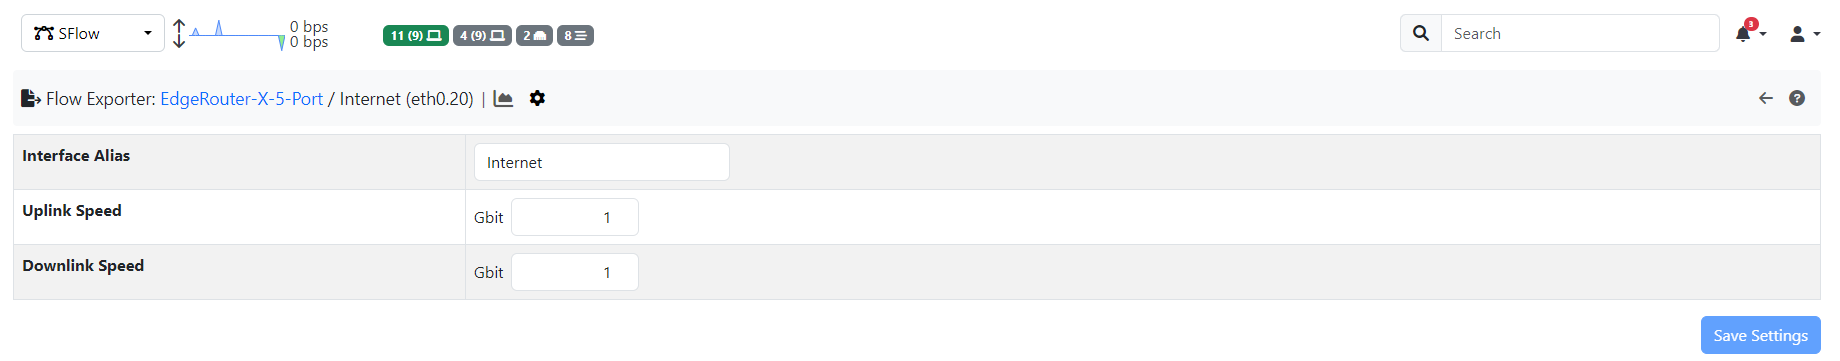
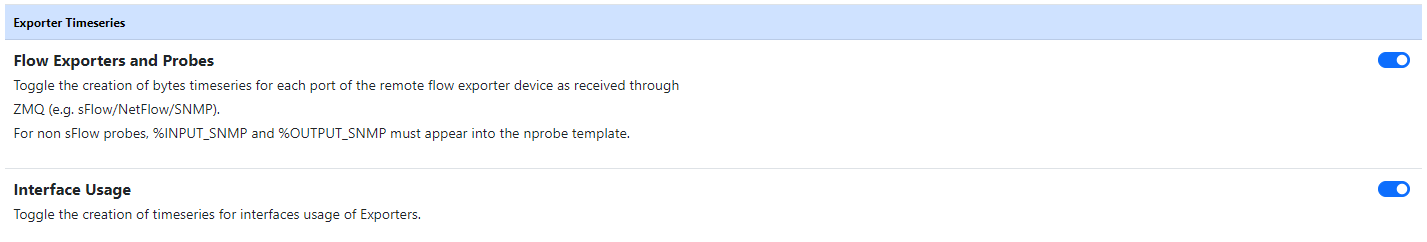
After setting the interface speeds, save the settings and jump to the Preferences (in the Settings menu), in the Timeseries section. Here there should be a section named “Exporter Timeseries”, be sure to have the “Interface Usage” preference toggled.
And that’s it! Simple isn’t it?
From now on, a new timeseries is going to be available in the Flow Exporter Timeseries section (accessible from the chart icon, highlighted in green above) with the interface usage, in percentage.
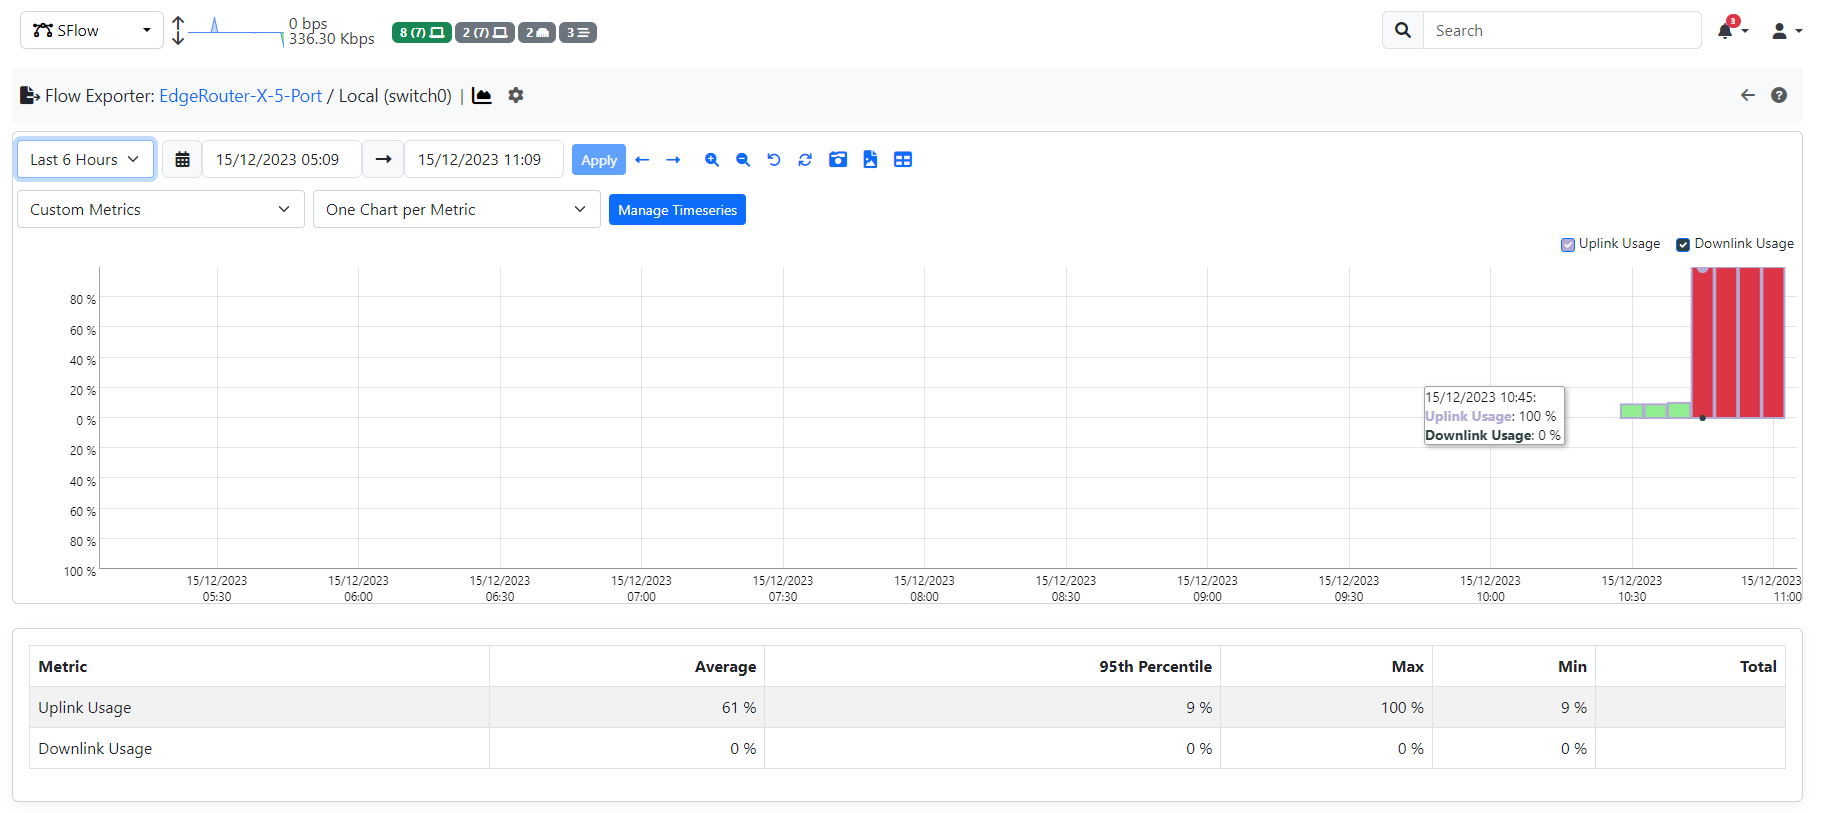
When the usage is <= 25% the bar is light green, from 25 <= 50% is dark green, from 50 <= 75% is yellow, and above is red.
Soon, the possibility to trigger alerts when the interface usage exceeds certain thresholds, will be available, stay tuned for more info.
Enjoy this new feature, and send us your feedback