Sometimes it happens that your router is congested, and you ask yourself “How is it possible?” or “Who is responsible for congesting the network?” or “Which router/port is congested?”.
You could simply answer the last question by using the SNMP/Flow Exporters Usage: HowTo Monitor SNMP Interfaces Utilisation and Congestion Rate; but what about the other two?
Let’s start by looking at SNMP. As explained in the previous post, if SNMP is enabled on the routers/switches, using ntopng it is possible to figure out if an interface is congested. On the other hand, by using NetFlow/IPFix/sFlow we could understand who is responsible for producing/receiving the traffic. and eventually what activity that host/s is/are currently doing. So by combining these two pieces of information, we can achieve our monitoring goal.
First, let’s start ntopng with ClickHouse enabled (-F option).
Then enable SNMP on all the Routers/Switches we want to monitor and poll those devices by adding them in ntopng.
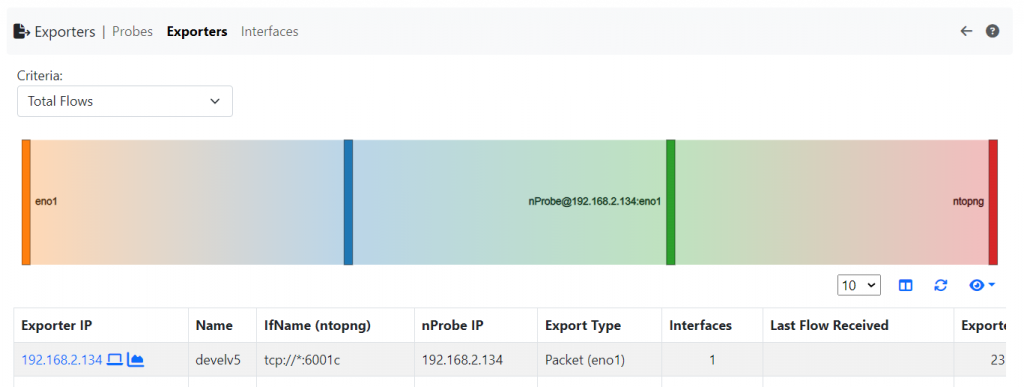
Then export the flows from that device towards an nProbe, connected to ntopng (See Using ntopng with nProbe).
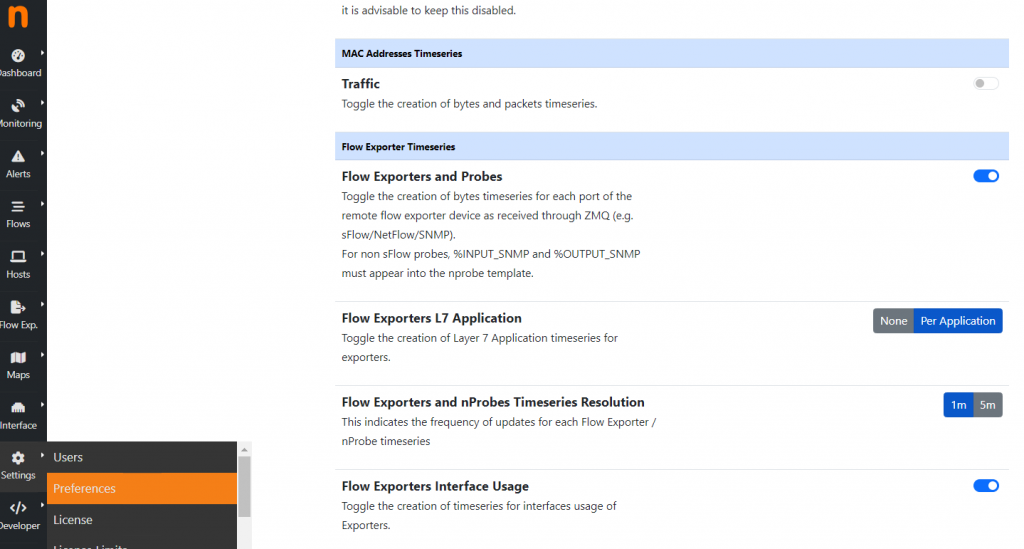
In order to have detailed SNMP measurements, we can increase standard 5 min polling to 1 min polling via Settings -> Preferences -> Timeseries, scroll down up to the Flow Exporter Timeseries and switch the “Flow Exporters and nProbes Timeseries Resolution” to 1m.
Now is to disable usage calculation all the noise i.e. thos devices we are not interested in.
Suppose that we are interested just in the 192.168.2.134 device (our router/switch); jump to SNMP and remove from the Usage page, every device other then the above switch. In order to achieve that, for all device we want to skip, go to the Configuration page (in green) and set the “Exclude From Usage” preference (see below).
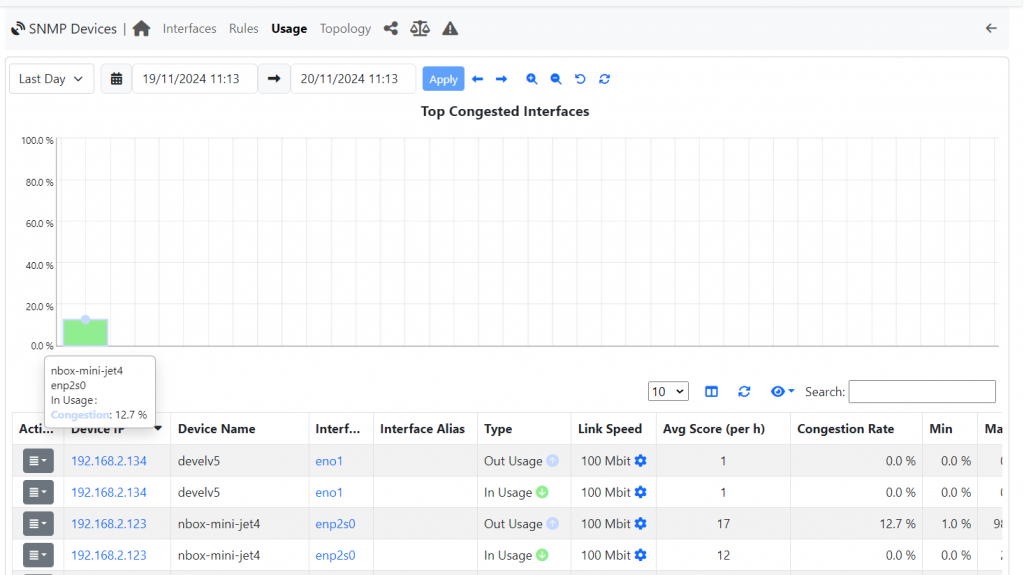
Now everything is set up and you can analyse your network: go to SNMP Devices -> Usage page; where you should be able to see each monitored device/interface.
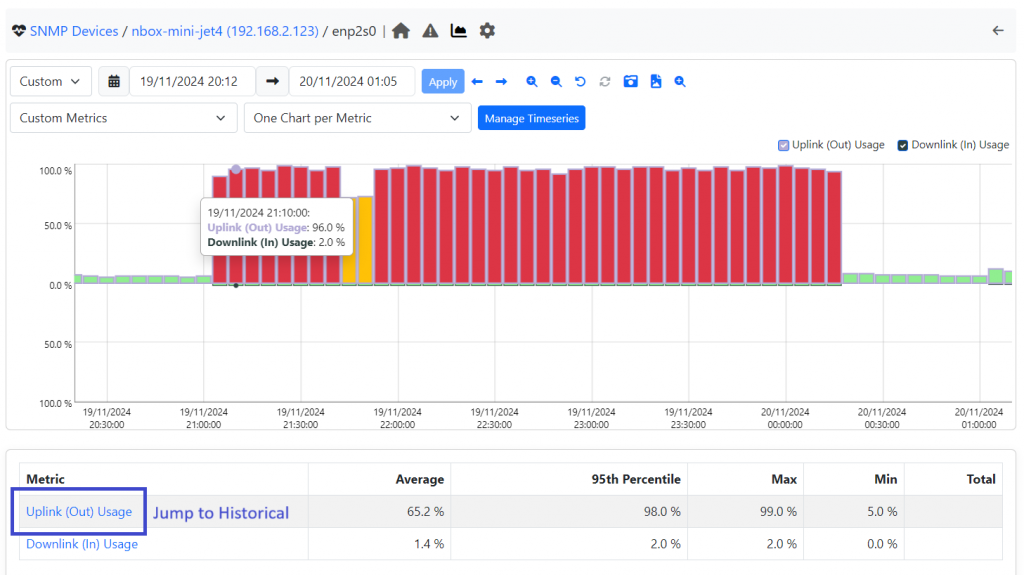
From this page you can click on the congested Interface and jump to the details of the interface. Then zoom in the period of time of the congestion.
On this page you can see that the congestion happened in the Uplink (out) direction. Here you can click on the Uplink (Out) Usage link (blue rectangle in the above picture) for correlating this information with Historical flows and figure out what was the root cause.
If you have read until here, you have learnt how to to monitor your Routers/Switches, check if a traffic congestion happened and understand what has beenthe root cause.
Enjoy!


