Quality of Experience (QoE) measures how satisfied users are with a network service based on their subjective perception. Unlike Quality of Service (QoS), which focuses on technical metrics (e.g., latency, jitter, packet loss), QoE evaluates the actual end-user experience—such as video streaming smoothness, call clarity, or web browsing responsiveness. QoE is important from various points of view including:
- User Satisfaction: Even if network metrics appear good, poor QoE leads to frustration (e.g., buffering videos or choppy VoIP calls).
- Business Impact: Bad QoE can result in lost customers, reduced productivity, or negative reviews.
- Proactive Troubleshooting: Identifying QoE issues early helps prevent major service disruptions.
For this reason, we have decided to complement all our tools (nDPI, ntopng, nProbe/nProbe Cento) with QoE measurement for both TCP and UDP (yes, QUIC is supported) protocols. Our approach is based on nDPI that can detect the application protocol being used by a flow, and compute QoE based on such protocol. In particular we have identified in nDPI some categories for which we have defined some boundaries for metrics such as RTT and jitter that will be used in QoE computation:
- VoIP Calls
- Video Conferencing (Zoom, WebRTC, Skype)
- Cloud Gaming (GeForce NOW, Stadia, xCloud)
- Web Browsing (HTTP, HTTPS)
- DNS Queries (UDP/53)
- Live Streaming (Twitch, YouTube Live, etc.)
- Buffered Streaming (Netflix, YouTube, etc.)
- Remote Desktop (RDP, VNC, AnyDesk)
- High-Frequency Trading (HFT, Stock Trading)
- IoT Smart Home (Zigbee, Z-Wave, MQTT)
Based on this we have implemented QoE measurement in the current dev branch (Enterprise edition) as follows.
nDPI
In nDPI, protocols are classified and divided in QoE categories for easing QoE computation by application sitting on top of nDPI.
nProbe/nProbe Cento
Two new information elements have been defined: %QOE_SRC_TO_DST and %QOE_DST_TO_SRC. They have a range of values from 0 to 100 (the higher the better) that is used to report to collector applications (including ntopng) the measured QoE divided per direction (client-to-server and server-to-client).
ntopng
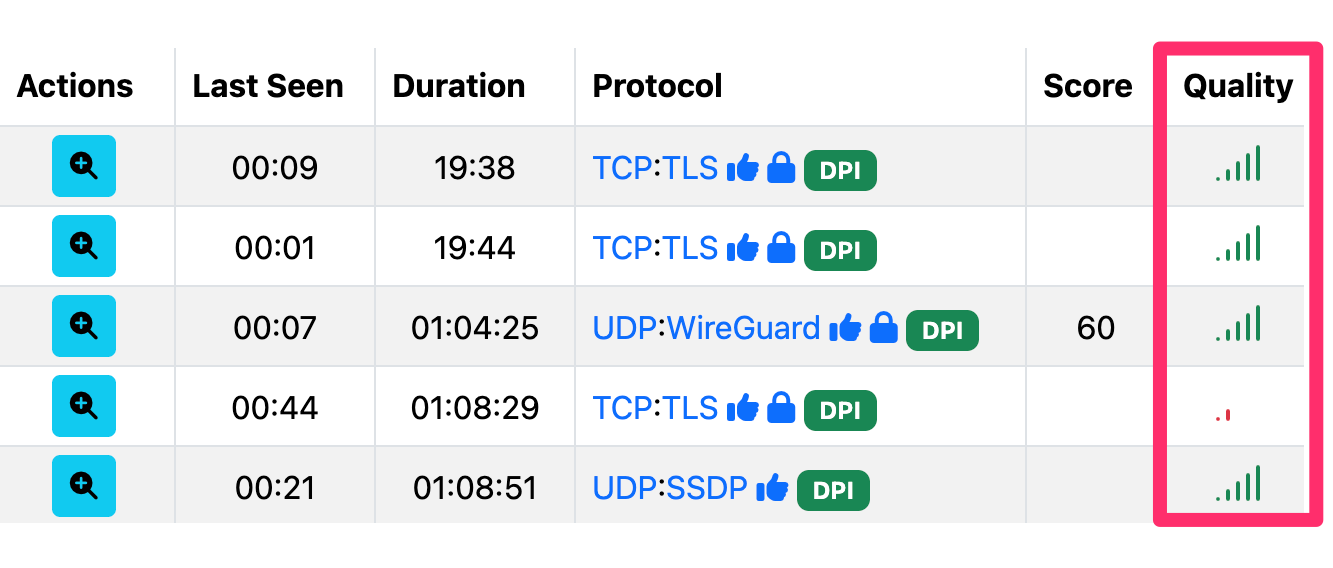
In ntopng, QoE is still measured in the 0..100 range but it is depicted with a simple “signal strength-like icon” for immediately evaluating the flow QoE.
When clocking on a flow details, ntopng reports not only the flow quality but also the reason why a given score has been assigned to a flow.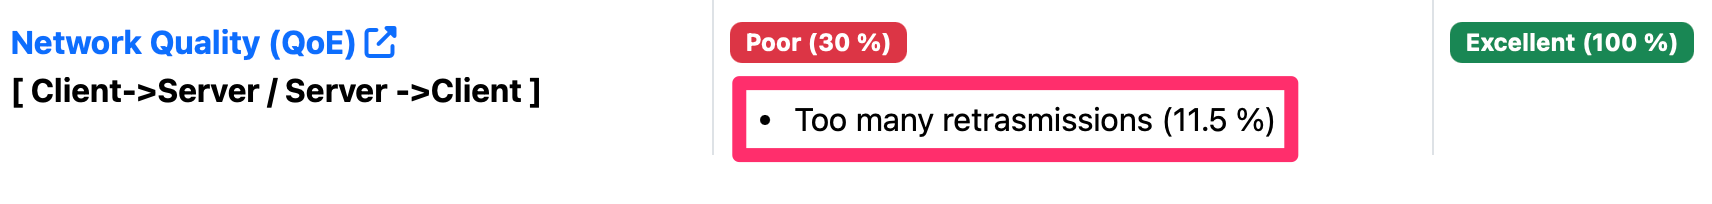
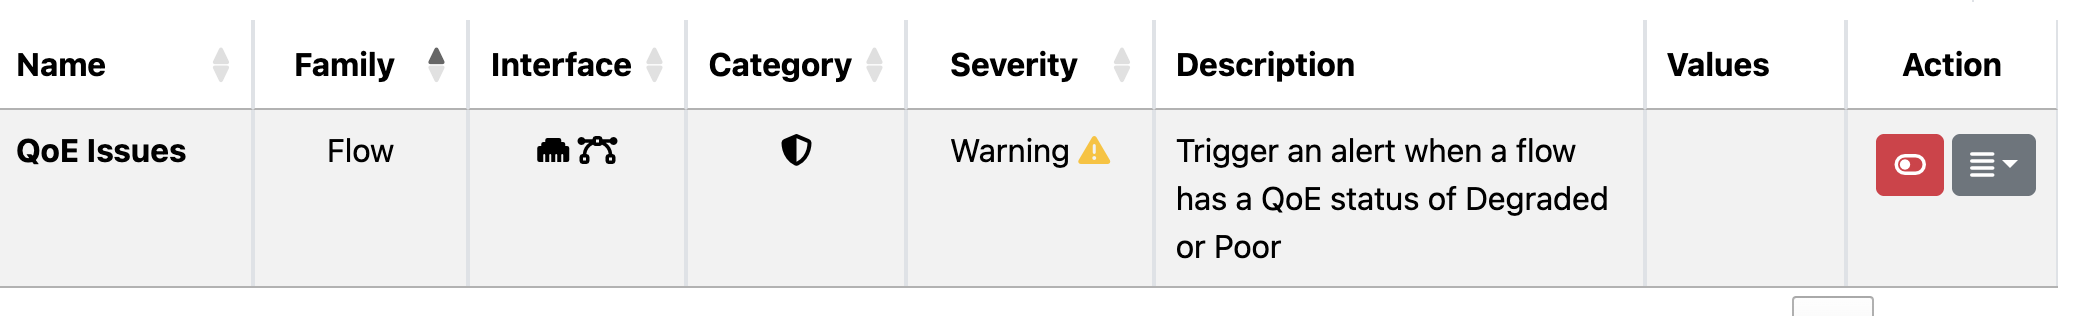
It is possible to trigger alerts based on QoE by enabling the QoE check.
QoE measurements are also:
- Saved on historical flows for creating reports and explore quality issues.
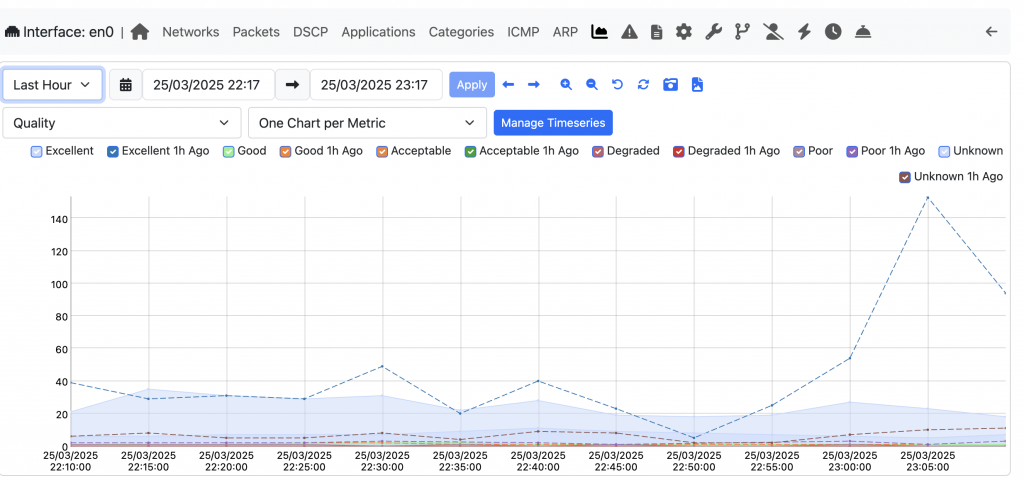
- Consolidated in timeseries for host/interface/ASN for evaluating them overtime.
Measuring QoE, required all ntop components to be enhanced. We hope that this big development effort will be appreciated by our community and used to complement cybersecurity and volumetric measurements.
Enjoy !