SecurityOnion (SO) is a popular Linux distribution for threat hunting and security. It included ElasticSearch as backend for storing alerts as well as Kibana-based web interface. SO includes out of the box a few sensors such as Suricata that is a signature-based IDS used for flow analysis. To date SO does not include a tool that is able to merge network and security analysis or that can collect input from sensors and provide a high-level consolidated alert (e.g. a DoS vs individual alerts generated by Suricata). As most of our users know, ntopng already integrated Suricata and in this blog post we explain you how to export this information into SO, for the best of both worlds including DPI visibility.
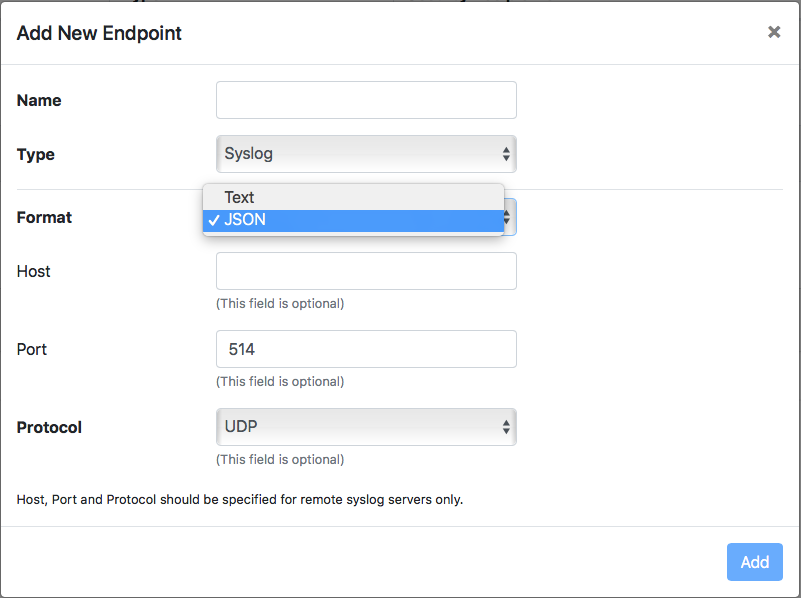
In order to use ntopng with SO, you need to use the latest 4.3 ntopng dev build. You can export directly to SO via the ElasticSearch ntopng endpoint (you need ntopng Enterprise for that) or export via the syslog endpoint (all versions from the community edition up will work) to SO and then import data into ElasticSearch via LogStash. In this blog post we’ll cover the first option but if you want to use the syslog way make sure you use export your data in JSON format.
As SO is basically a CentOS 7 distribution, you can install ntopng directly on your SO box (just follow the instructions at https://packages.ntop.org for installing ntop packages via yum) or on an external box that sends alerts to ElasticSearch running on SO’s box. If you follow this path make sure you configure the firewall on SO so allow data to be sent from an external box to SO. You can do this as follows (in our case the SO box is active at IP 192.168.2.163 and our local network is 192.168.0.0/16)
[root@securityonion yum.repos.d]# so-allow
This program allows you to add a firewall rule to allow connections from a new IP address.

Choose the role for the IP or Range you would like to add

[a] - Analyst - ports 80/tcp and 443/tcp
[b] - Logstash Beat - port 5044/tcp
[e] - Elasticsearch REST API - port 9200/tcp
[f] - Strelka frontend - port 57314/tcp
[o] - Osquery endpoint - port 8090/tcp
[s] - Syslog device - 514/tcp/udp
[w] - Wazuh agent - port 1514/tcp/udp
[p] - Wazuh API - port 55000/tcp
[r] - Wazuh registration service - 1515/tcp

Please enter your selection:
e
Enter a single ip address or range to allow (example: 10.10.10.10 or 10.10.0.0/16):
192.168.0.0/16
Adding 192.168.0.0/16 to the elasticsearch_rest role. This can take a few seconds
You now need to go inside ntopng, change the interface to System, in the sidebar choose Notifications and define a new Endpoint as follows

You can now define a recipient associated to this endpoint (still from the Notifications sidebar menu) as follows

Make sure you click on the Check button before creating it, this to make sure that everything is working from the connectivity standpoint. At this point you need to bind this recipient to the pools for which you want to export data to SO.
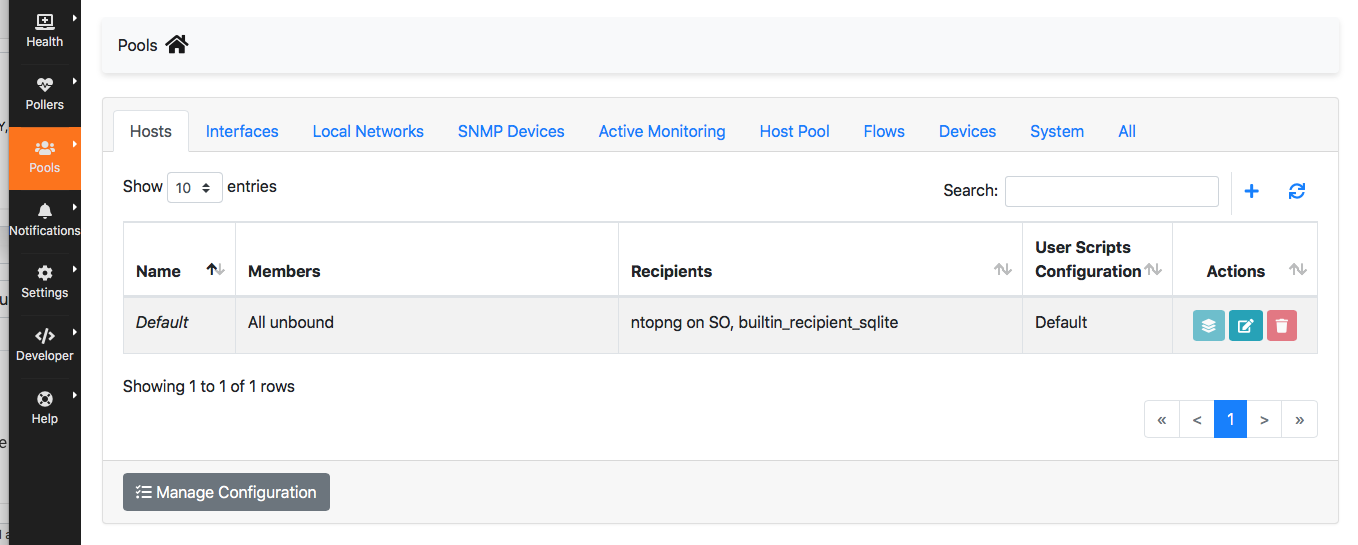
In essence this mechanism allows you to specify what alerts you want to send SO, their severity, only for specific host or interfaces etc. This is to avoid flooding SO with too many alerts and exporting only those you care about.
Done this you’re basically ready: go to the SO web console and explore the data sent by ntopng.

Below you can see the network dashboard with nDPI-generated information in the top-right tile.
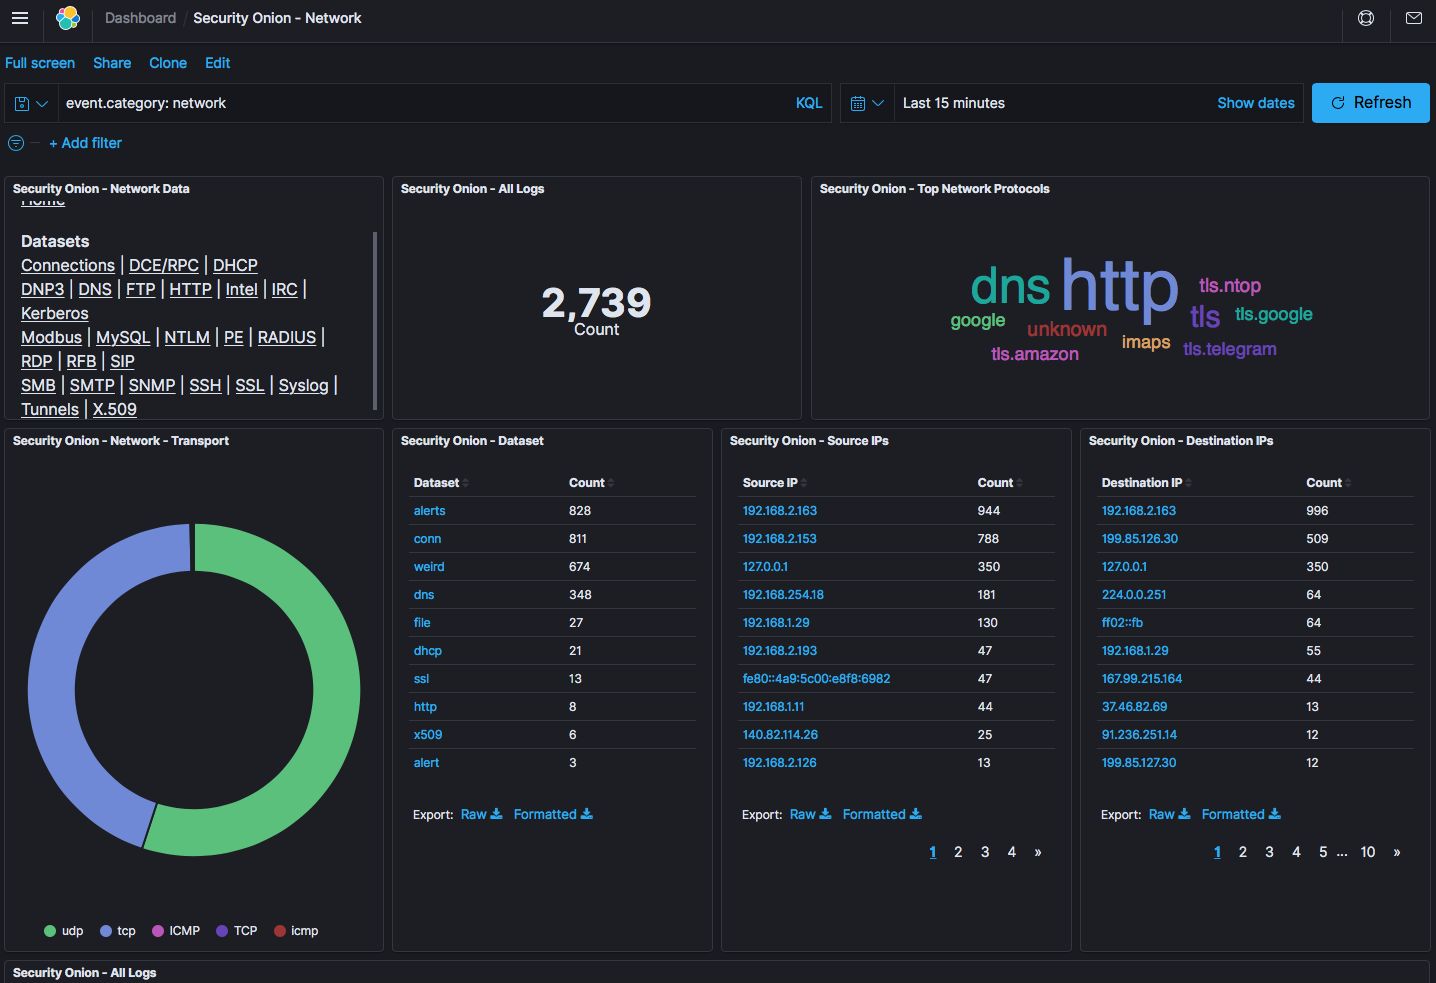
You can click on the nDPI protocol to drill down and see what hosts are doing Telegram for instance.

Of course you can drill down at any time and explore raw alerts. Below you can see an example of a ntopng-generated alert

and in JSON format according to the latest Elastic Common Schema (ECS)
{
  "_index": "securityonion:so-ntopng-2020.11.23",
  "_type": "_doc",
  "_id": "6G-l9HUBxzCea2aR50WS",
  "_version": 1,
  "_score": null,
  "_source": {
    "ecs": {
      "version": "1.6.0"
    },
    "rule": {
      "name": "Low Goodput Ratio"
    },
    "organization": {
      "name": "ntop"
    },
    "network": {
      "protocol": "tls.amazon",
      "community_id": "1:lVT6PgEISWUJa00vjxX2fPcNKZo=",
      "transport": "tcp"
    },
    "message": "{\"srv_continent_name\":\"NA\",\"alert_type\":72,\"srv_addr\":\"52.0.218.127\",\"cli2srv_bytes\":204,\"first_seen\":1606127296,\"pool_id\":0,\"srv_localhost\":false,\"cli_city_name\":\"\",\"srv_asn\":14618,\"ifid\":2,\"cli_country_name\":\"\",\"cli_port\":35314,\"srv_location_lon\":-77,\"cli_asn\":0,\"cli_addr\":\"192.168.1.11\",\"cli_localhost\":true,\"cli_blacklisted\":false,\"srv_port\":443,\"srv_city_name\":\"\",\"alert_json\":\"{\"info\":\"\",\"status_info\":\"{\"hash_entry_id\":303,\"alert_generation\":{\"confset_id\":0,\"script_key\":\"low_goodput\",\"subdir\":\"flow\"},\"ntopng.key\":4104816922,\"goodput_ratio\":45.753425598145}\"}\",\"l7_proto\":178,\"community_id\":\"1:lVT6PgEISWUJa00vjxX2fPcNKZo=\",\"srv_country_name\":\"US\",\"l7_master_proto\":91,\"srv2cli_packets\":1,\"srv2cli_bytes\":161,\"srv_os\":\"\",\"flow_status\":12,\"proto.ndpi\":\"TLS.Amazon\",\"is_flow_alert\":true,\"alert_tstamp\":1606127313,\"cli_continent_name\":\"\",\"action\":\"store\",\"score\":10,\"alert_entity_val\":\"flow\",\"alert_entity\":4,\"srv_blacklisted\":false,\"proto\":6,\"alert_severity\":3,\"cli_os\":\"\",\"vlan_id\":0,\"srv_location_lat\":39,\"cli2srv_packets\":2}",
    "source": {
      "port": 35314,
      "ip": "192.168.1.11"
    },
    "destination": {
      "geo": {
        "location": {
          "lon": -77,
          "lat": 39
        },
        "country_iso_code": "US",
        "continent_name": "NA"
      },
      "as": {
        "number": 14618
      },
      "port": 443,
      "ip": "52.0.218.127"
    },
    "event": {
      "risk_score": 10,
      "created": "2020-11-23T10:28:33.0Z",
      "severity_label": "low",
      "kind": "alert",
      "category": "network",
      "module": "ntopng",
      "dataset": "alerts",
      "severity": 3
    },
    "@timestamp": "2020-11-23T10:28:33.0Z"
  },
  "fields": {
    "@timestamp": [
      "2020-11-23T10:28:33.000Z"
    ],
    "Push to TheHive": [
      "https://192.168.2.163/soctopus/thehive/case/6G-l9HUBxzCea2aR50WS"
    ]
  },
  "sort": [
    1606127313000
  ]
}
Of course if you want, you can create new Kibana dashboards for ntopng alerts, and extend the SO visualisation system with a few clicks.
You can learn more about ntopng endpoints and
Enjoy !