In the original ntopng it was possible to navigate historical information using a so called “Historical Interface”. Such interface was a logical network interface able to read flow data from a SQLite archive and present them on the web interface. This approach had various limitations when it was used to navigate data on a long term window, as all flows had to be restored on memory before visualising them, process that can take a lot of memory and time when data cardinality increases.
In the ntopng 2.1 development version, we have completely rewritten the code for historical data exploration. Currently the supported database backends include MySQL and ElasticSearch, so using the -F flag, you can dump flow information on one of these two backends. For instance if you want to use MySQL you just need to do
ntopng -i eth0 -F "mysql;localhost;ntopng;flows;root;"
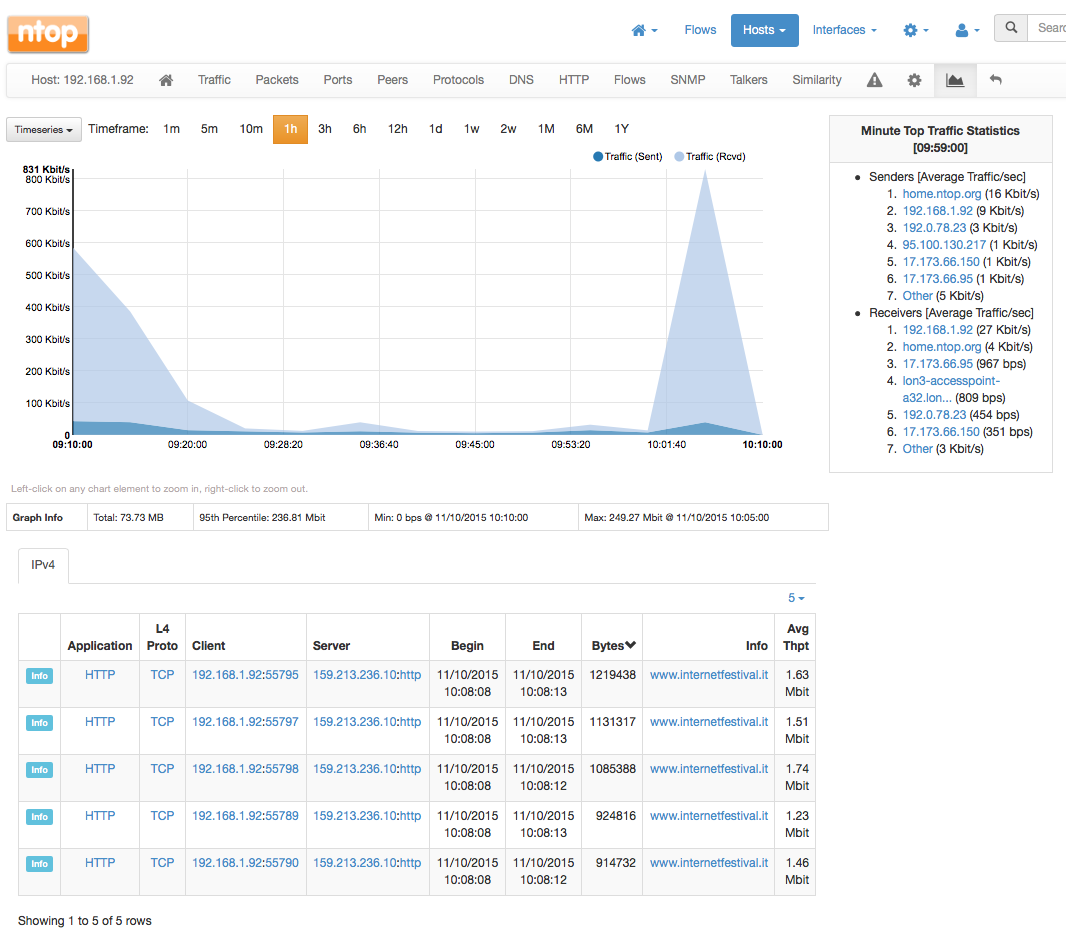
and ntopng will save flow information in the database. Doing that, ntopng will also display you an extended web interface for navigating though flow information. You can select flows according to various criteria, by selecting the graph icon inside ntopng (local) host and interface pages.
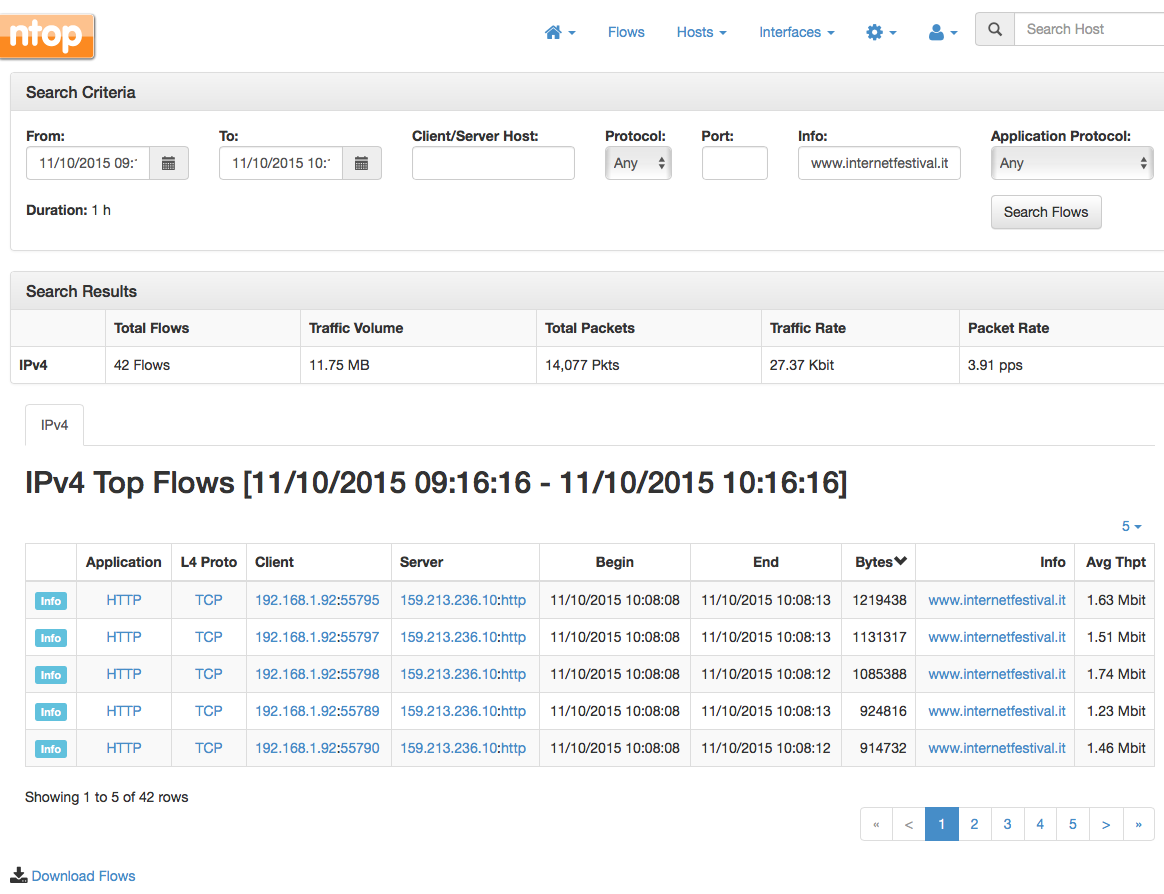
As you can see at the bottom of the graph you will find a small table containing the top flows of selected time period you selected. This table is interactive as all ntopng tables so you can click on column names to sort data, or click on the Info button to visualise the flow information. All activities on this table are not performed on in-memory data but rather on historical data present on the database. For instance if you click on the www.internetfestival.it link under the Info column, you will select all flows which contain such string (e.g. DNS queries or HTTP requests from/to such host) as depicted below.
You can click on the search criteria to change the type of information you want to retrieve, and you will see the results in the table below. The middle table named “Search Results” contains a summary of the retrieved information so that you can narrow your search if necessary. In case you are interested in downloading all flows matching your queries, you can click on the bottom download icon to download all of them. On the current implementation you can easily drill down to flow level and see exactly what flow has created the suspicious traffic peak that you have seen in ntopng traffic graphs.
In order to avoid filling up your MySQL database, under the ntopng preferences menu, you can specify how long you want to keep flows into MySQL so that ntopng can delete for you old flows and thus you can save space. Note that this setting applies only to MySQL as RRD-based graphs are not affected but this setting. This means that you can use MySQL to store short-term flows, while using RRD-based graphs for more long-term analysis.
This implementation is just the beginning of what you will see after ntopng 2.2 release. In fact we plan to add data analytics that go beyond simple data search/retrieval, periodic reports and much more. If you want to contribute, please send us patches and code enhancements and we’ll integrate them.


