In ntopng we have implemented various techniques for analysing historical traffic. This post shows you the options available:
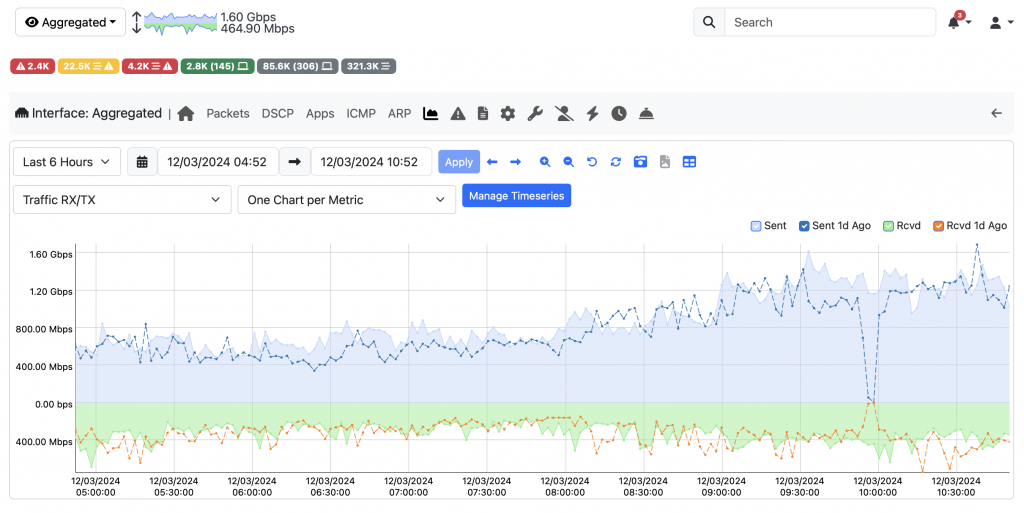
- In timeseries you can see the current traffic rate (line) or the traffic rate of the previous period of time (dotted). This allows you to visually analyse when traffic deviates from previous period of time (see for instance in the chart below the traffic drop happened at 10 AM).
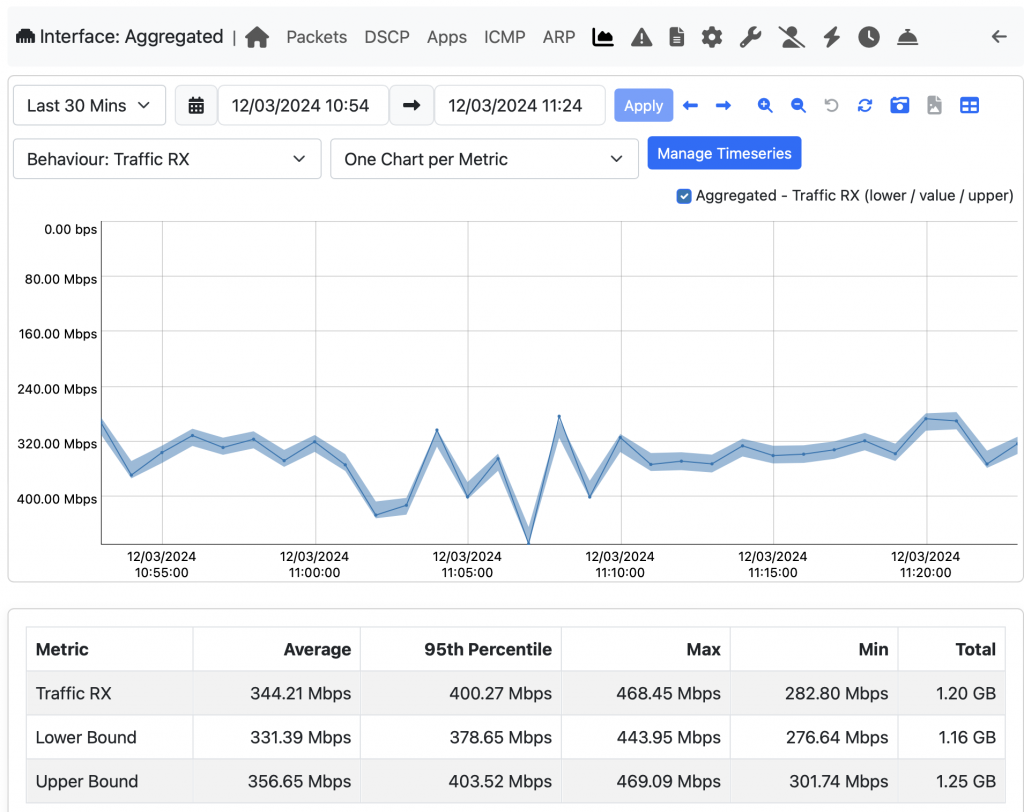
2. You can trigger interface alerts based on statistical traffic analysis (exponential smoothing) when traffic exceeds (up/down) its baseline.
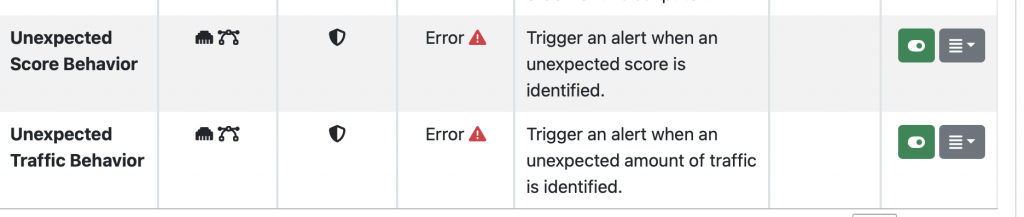
Note that when this happens you can trigger an alert by enabling the two behavioural checks below (see Settings -> Behavioural Checks)
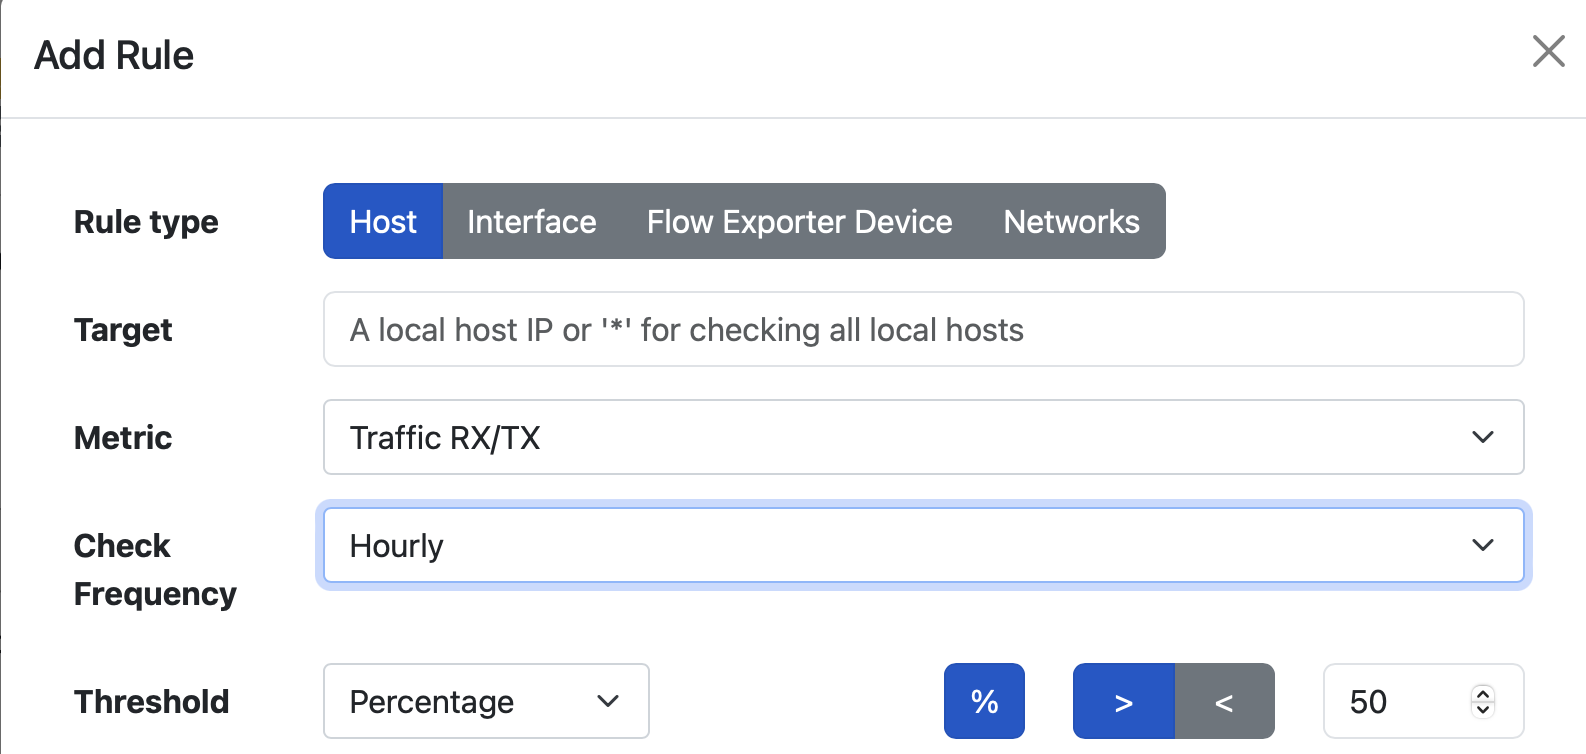
3. You can set Local Traffic Rules (under the Hosts menu) to trigger an alert when traffic exceeds (up/down) a given threshold or % (in the example below when the current host traffic is less than 50% of the traffic of the previous hour).
In summary we have implemented both static and behavioural thresholds (you need both of them) to allow you to continuously detect hidden traffic issues.
Enjoy !