Despite ntop has implemented rich network metrics over the years, the two most important metrics that people keep asking us are volume (how much) and time (how long).
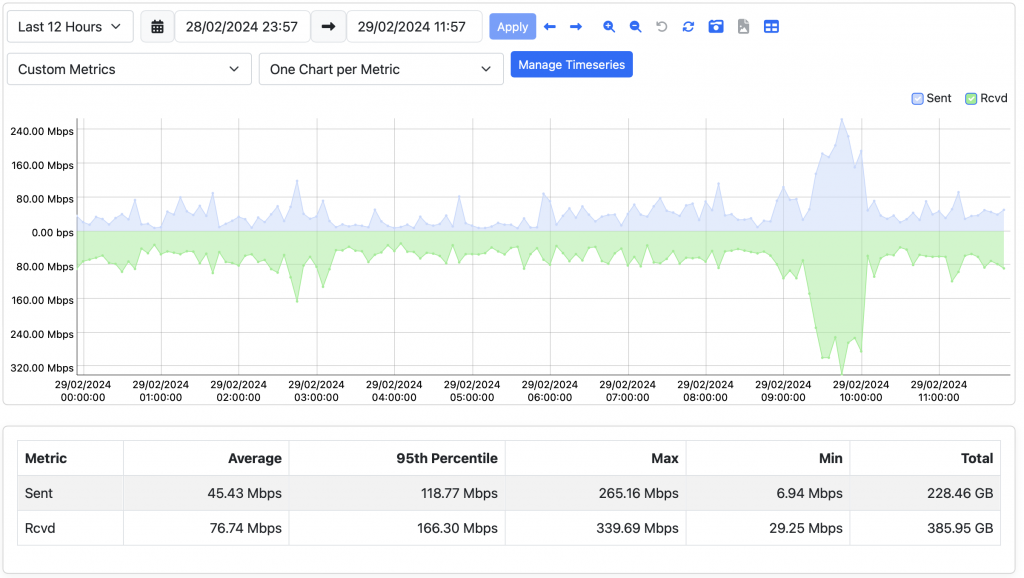
Timeseries offer a quick view of the traffic and allow people to immediately spot traffic peaks or absence of transmissions. They are good for traffic analysis but are too complex for producing accounting data and comparing usage overtime. For this reason ntopng provides for each local host an additional feature that allows you to see immediately the amount and time that a host has passed online.
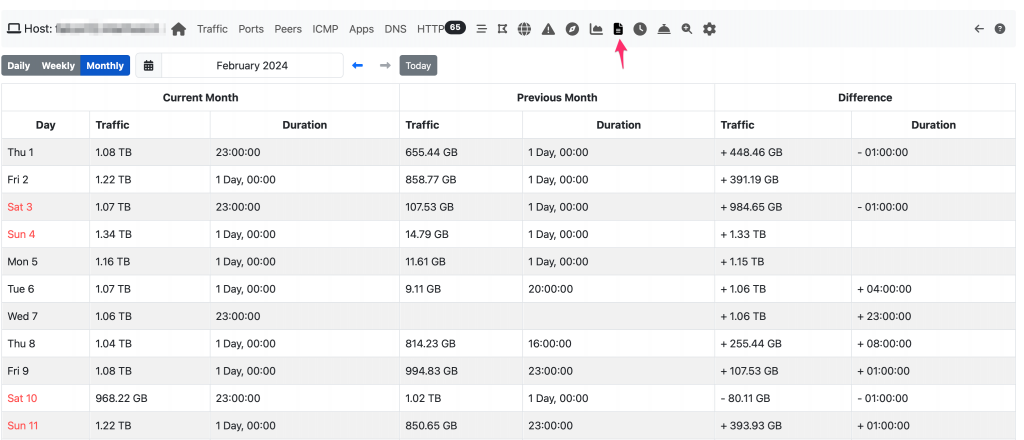
As shown on the above picture under the host submenu there is an icon (indicated by the arrow) that allows you to access daily/weekly/monthly traffic reports and see the difference with respect to the previous period. Example in the above picture it is shown the amount of traffic of a host for the current month (February), compared day-by-day, with respect to the previous month (January). Similar reports can be shown when showing the daily and weekly reports.
Enjoy !