Last year you have read how we have integrated Suricata support into ntopng. While an IDS is a good source of data, it is just a sensor, how has no knowledge of the big network picture including the network overview, past host/flow history and device type. In essence an IDS is a nice to have but it’s not enough. What it is necessary is the ability to analyse traffic, learn what is wrong, compare current behaviour with the past, and draw some conclusions (i.e. read them as emit alerts) that could be used by network analysis to understand what’s wrong in the network. This is in essence what we have implemented in the upcoming ntopng.
All is driven by user scripts that can be accessed from the setting menu.
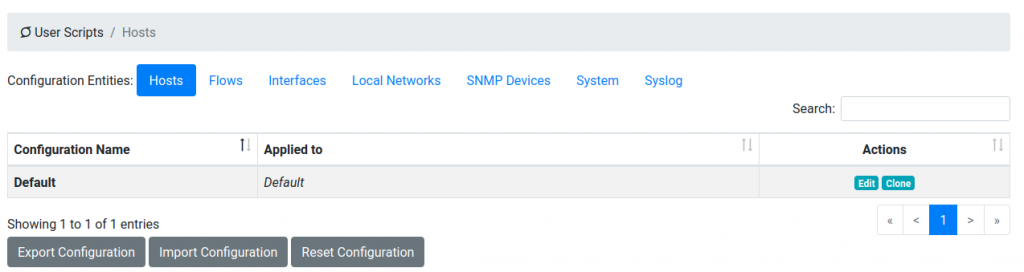
Scripts are executed periodically (e.g. every minute) or at events (i.e. when a flow protocol is detected). Here you can see the entities on which scripts are applied.
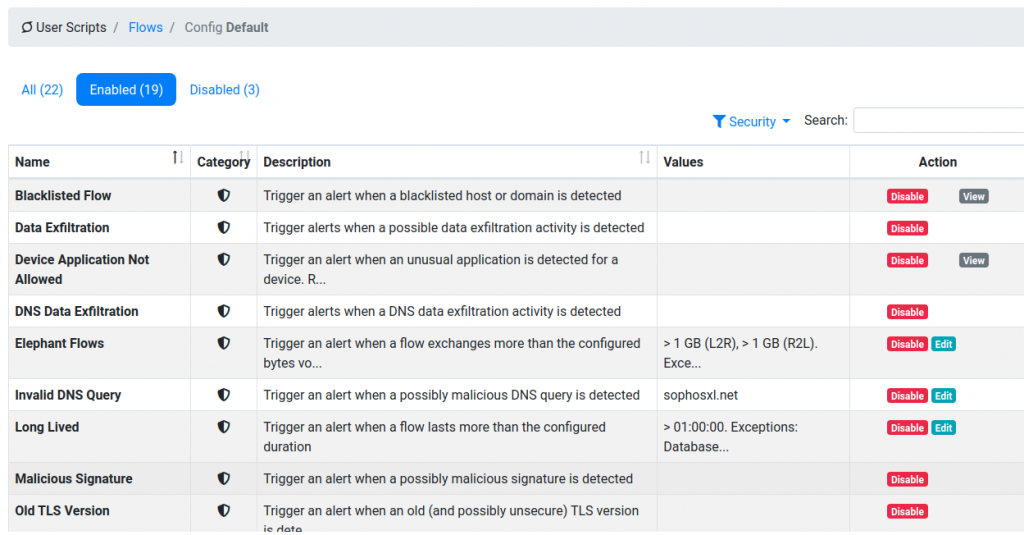
Below you can see flow scripts
and host scripts

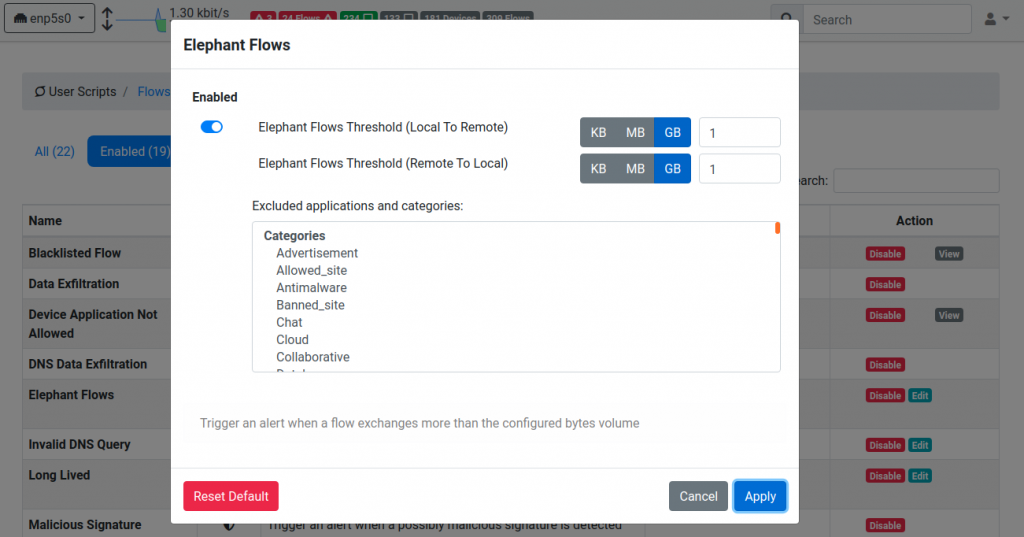
You can modify the script thresholds by clicking on the edit button where you can specify parameters that drive the alert generation.
Scripts are used to generate alerts that are then consolidated per entity (hosts, autonomous systems, networks…) with a numerical value called score that is computed every minute based on the alerts generated by the scripts.
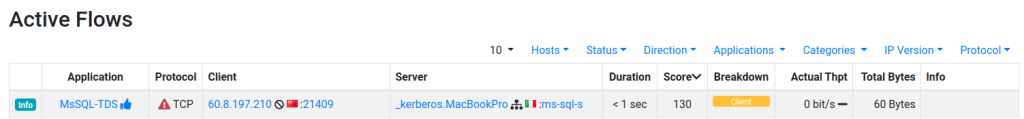
Under the flow/hosts page you can sort items according to the score to immediately see the consolidated view of where the problems are. Just sort according to the score to let ntopng drive you where problems are.
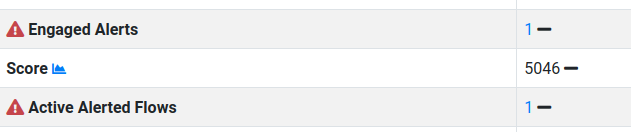
If you click on a host you can see the current number of issues reported, and the active alerts number.
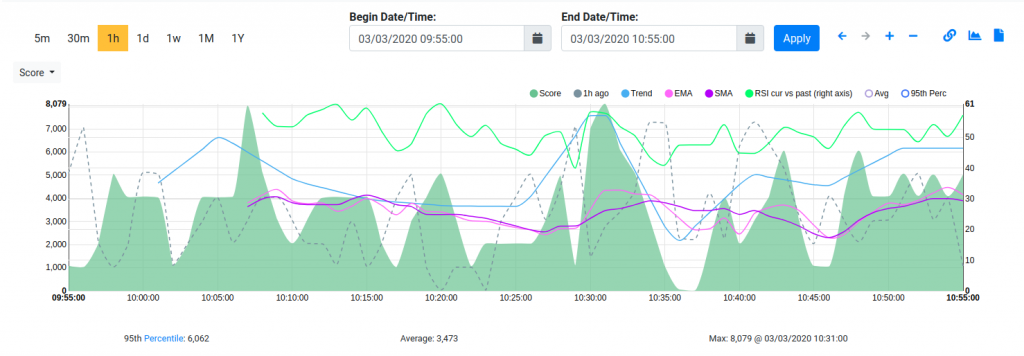
Clicking on the chart next to the score field, you can see how the host score changed overtime.
Of course you can use the alert and flow explorer to drill-down as see the exact nature of the network issues.
All this is part will be part of the upcoming ntopng v4. Enjoy with the dev build now, and soon with v4.