ntopng can export both flows and alerts in Elastic according to the Elastic Common Schema (ECS) format. You can dump flows (not alerts) in Elastic starting ntopng with -F “es;<mapping type>;<idx name>;<es URL>;<http auth>”. For instance you can do
ntopng -F "es;ntopng;ntopng-%%Y.%%m.%%d;http://localhost:9200/_bulk;"
We do not advise to use Elastic as flow collector, as when the record cardinality increases the database slows down and you are forced to use an Elastic cluster even on mid-size networks. We definitively advise you to enable -F clickhouse instead that is able to handle billion of records on a single node.
On a healthy network the cardinality of alerts should be a few of orders of magnitude less than the flows, hence using Elastic as alert collector is a good idea. Contrary to flow alerts that are enabled with -F, you need to enable alert exports from within ntopng as follows:
- On the left sidebar select Shortcuts -> Notifications
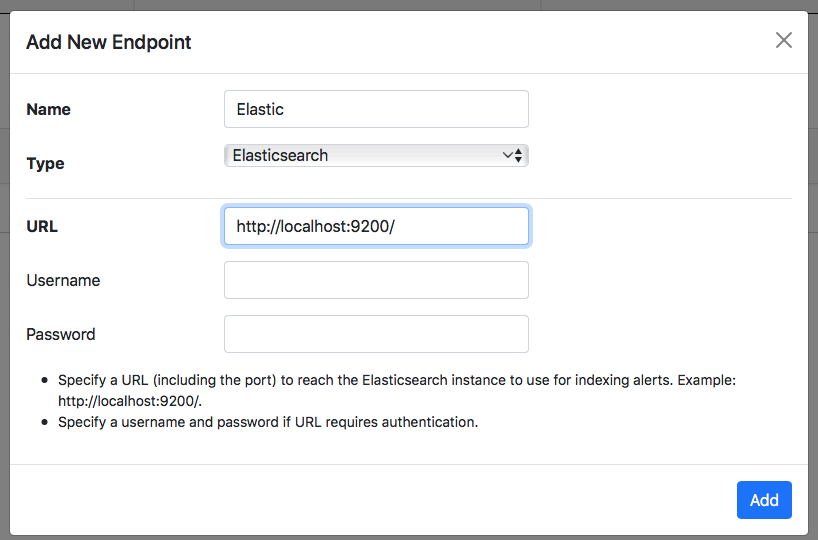
- Add a new endpoint as follows
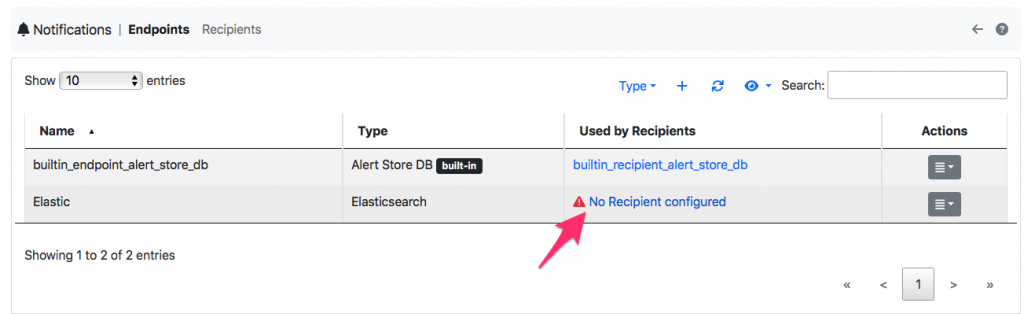
- The click on the link below in order to create a recipient
- This is a recipient example:
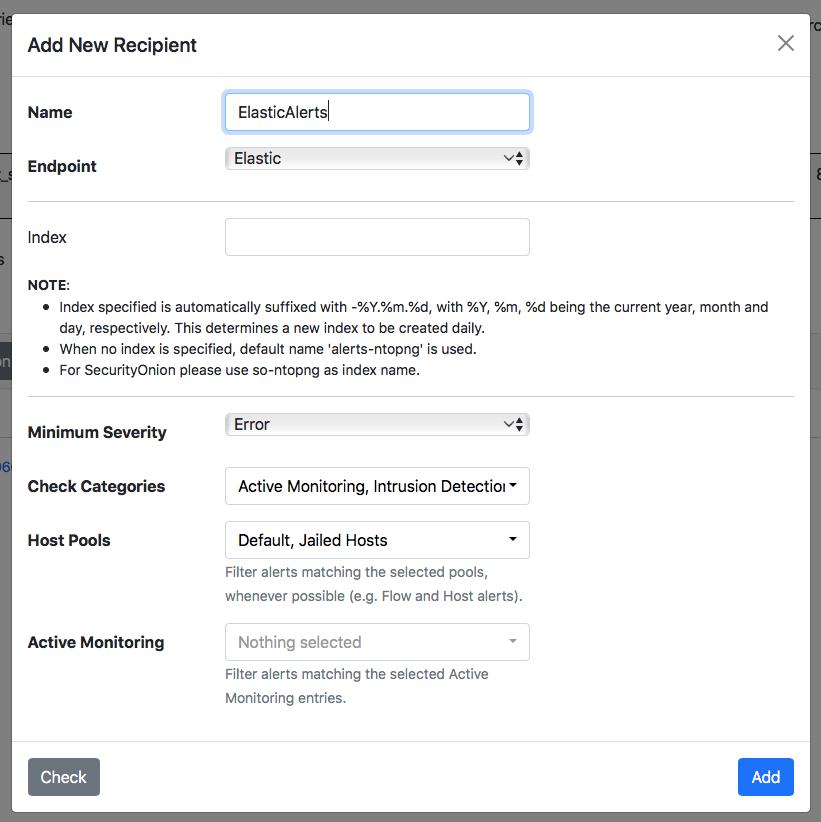
Done that, alerts will be exported in Elastic according to the above configuration (note that you can change the severity, and what alert categories to export), and you can now forget ntopng as it will silently feed Elastic as new alert are produced. Now all you need to do is to create a Kibana dashboard. You can create your dashboard from scratch or use the one we have created and shared on github.
Below we have created a video that shows you how to use Kibana to visualise ntopng alerts.
Enjoy !