In incident analysis it is important to provide evidence of the problem at various level of details:
- Alerts
Alerts are the result of traffic analysis (in ntopng based on checks) that have detected specific indicators in traffic that triggered the alert. For instance a host whose behavioural score has exceeded a given threshold or a flow that has is exfiltrating data. - Flows
Are the result of aggregation of packets belonging to the same connection and are used to compute alerts. - Packets
This is the most granular data that contains evidence of the traffic that is aggregated in flows.
In terms of cardinality, a flow contains several packets, and an alert is the result of computation of several flows. Alerts are important as they allow network operators to focus on a reduced set of information that is pre-computed by ntopng: this is nice as the cardinality of the information is reduced and also because ntopng has already discarded non-relevant information instead focusing on more relevant data.
As described here, in ntopng it is possible to enable packet dump and extract pcaps containing packets matching several criteria such as all the packets of a flow, or a given host. In this post we’ll now show how you can move one step further and correlate alerts with flows so that you have a complete pipeline: Alerts -> Flows -> Packets.
In order to enable correlation, you need to enable flow and alert persistency in ClickHouse that is implemented by starting ntopng as follows (you can read more information in the user’s guide):
- ntopng -i ethX -F clickhouse
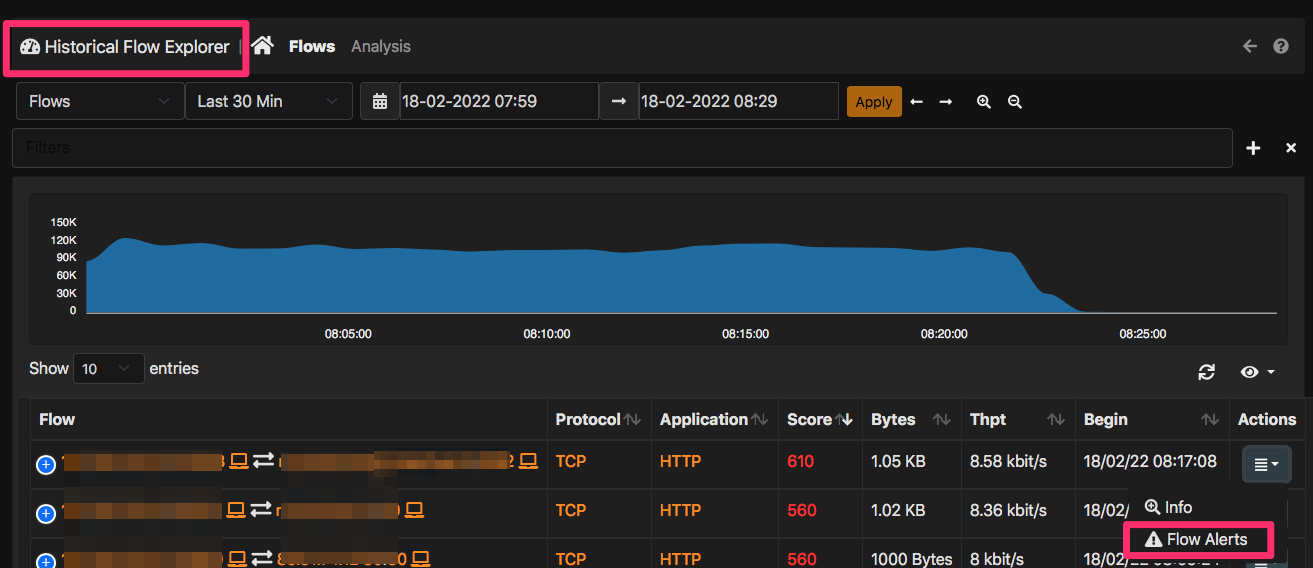
Done that ntopng will persistently write flows and alerts into ClickHouse. You can decide to start your incident analysis from flows (flows -> alerts) or the other way round (alerts -> flows). In both cases the ntopng user interface allows you to do that without using complex filtering rules. In fact for every flow that carries a potential alert (i.e. a non zero flow score), inside the flow explorer you can click on the dropdown menu under the Actions column and select the item “Flow Alerts” to jump to the alert that has been produced by such flow as depicted below.
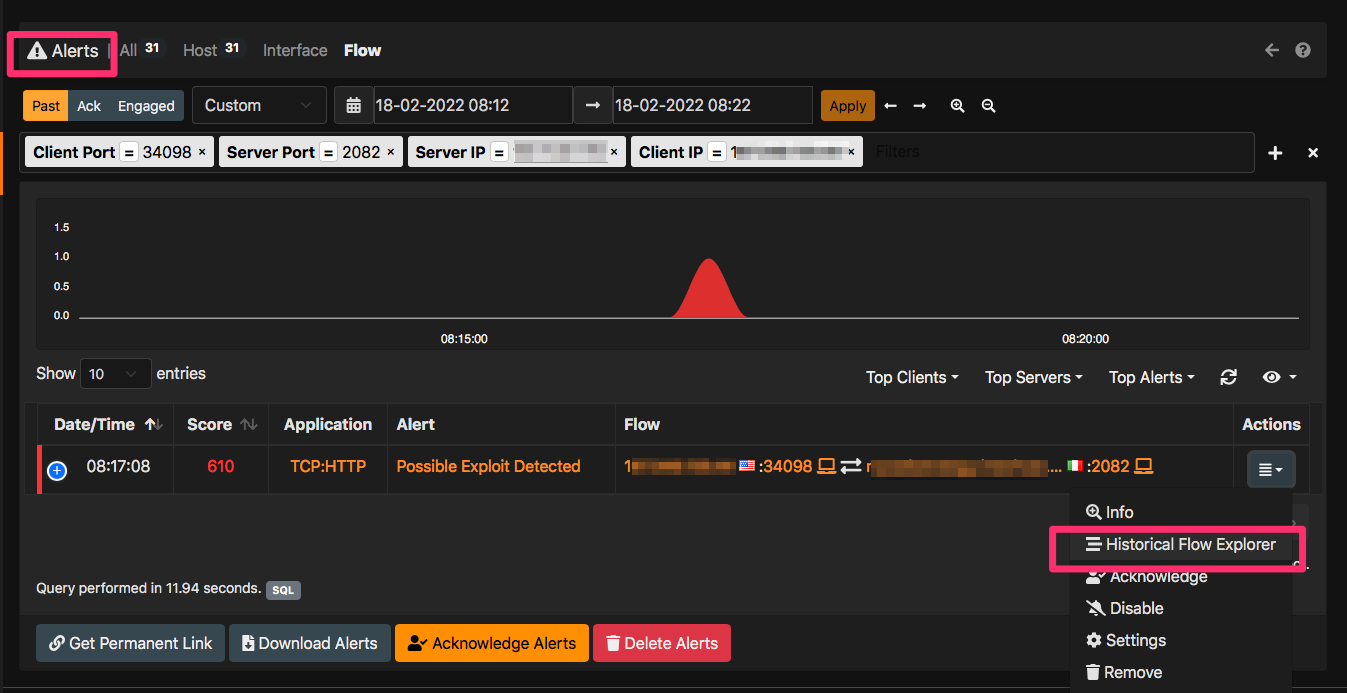
This will drive you to the flow alerts page where relevant alerts are displayed. In a similar way for every alert, inside the alert explorer you can select under the Actions menu the item “Historical Flow Explorer” for displaying to the flows that ntopng has used to report the alert.
In conclusion, you have a comprehensive solution for analyzing your traffic with a matter of mouse clicks. In case of an incident you can drill down from alerts to flows to packets. You can also download alerts, flows and packets by clicking on the relevant buttons so that you can extract this data and import them on your favourite data analytics platform or analyse packets with Wireshark. All this from the ntopng GUI with no shell expertise required.
Enjoy !