ntopng creates timeseries for traffic by periodically (e.g. every minute) writing into RRD/Influx the traffic volume observed. Below you can see an example.
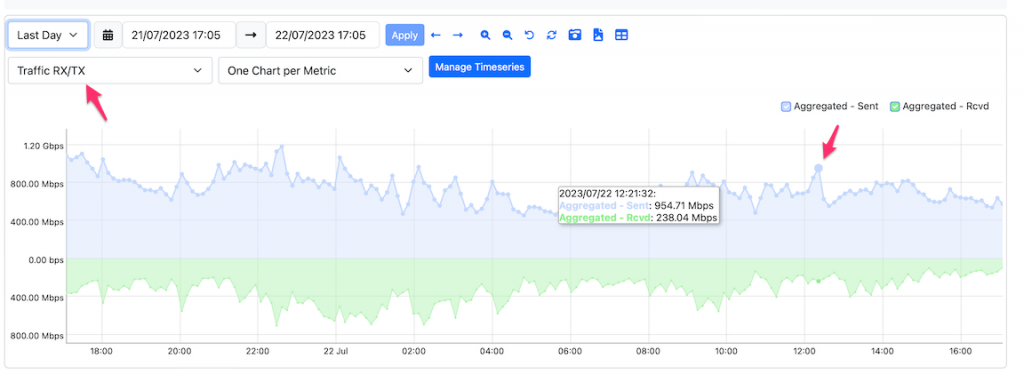
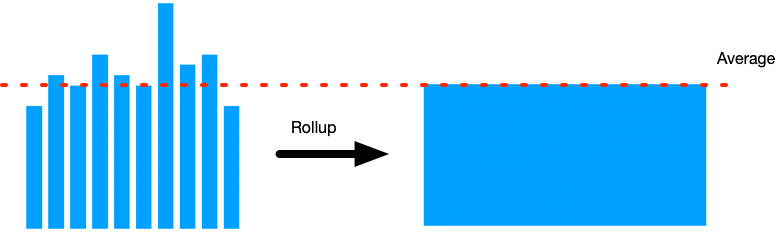
Traffic is used to keep track of the data volume exchanged. Over time timeseries are aggregated (roll-up) to save space, meaning for instance that 60 minute observations are used to compute a hourly observation. A timeseries rollup involves summarising the original time series data over larger time intervals. The purpose of doing a rollup is to reduce the volume of data and make it more manageable while preserving important information. Different rollup methods can be used, including:
- Summarization: Summing up the values over each time interval.
- Averaging: Taking the average of values within each interval.
- Max/Min: Retaining the maximum or minimum value within each interval.
- Sampling: Taking a sample data point within each interval.
The results is a new timeseries with a lower resolution as it has only one point per hour, instead of 60 individual observations. As in the hourly and minute timeseries the area under the curve (i.e. the volume of data exchanged) must be the same regardless of the timeseries resolution, the hourly point is computed as the average hourly value (among the 60 minute observations).
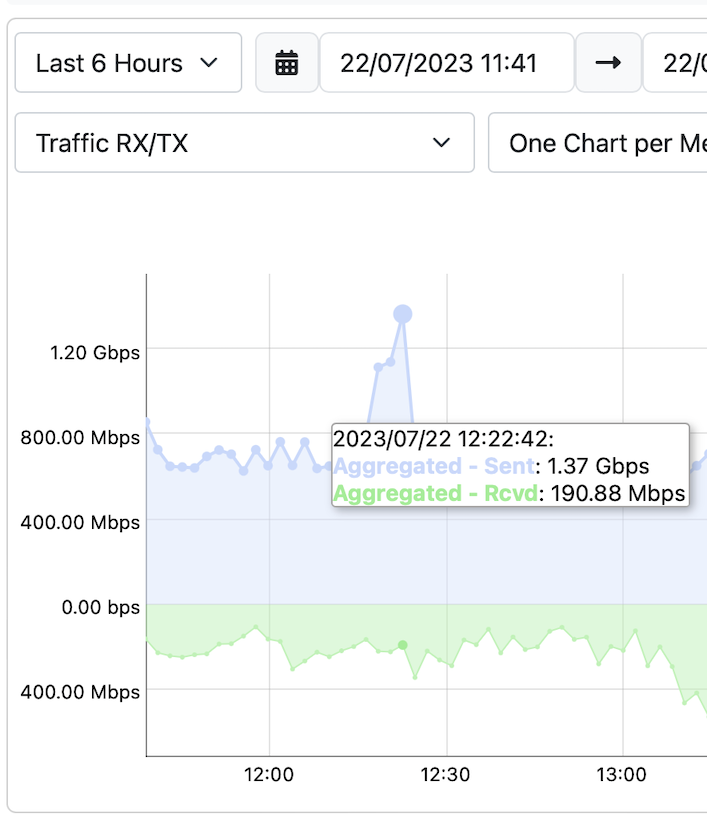
This means that if you display the above (last day) timeseries at a different resolution (e.g. week) as the average value is used, the timeseries points peaks will be lowered as each aggregated point will be computed as the average value of the period, thus smoothing the curve. The result is that the above timeseries when shown at 6 hour resolution reports 1.37 Gbps for TX, whereas the previous timeseries (daily) reported 0.95 Gbit.
This said, the traffic timeseries are good for computing data volume but not for handling throughout due to the use of average rollup. For this reason we have introduced (in dev branch, and soon stable when the new a new family of “Throughput” timeseries that are used to store throughput.
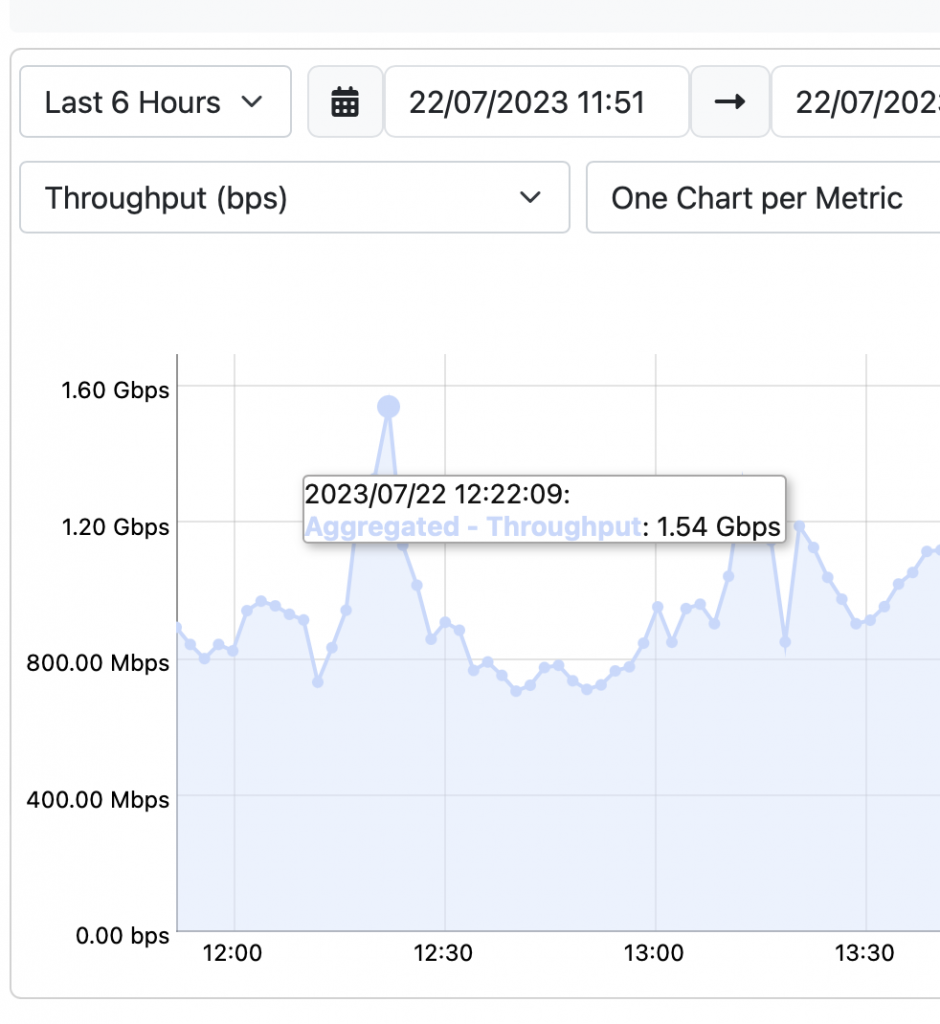
In this timeseries family, the rollup function is MAX instead of AVERAGE in order to make sure that the top throughput of the observation period is properly computed. This is the timeseries to use (instead of traffic) in case you care about the maximum observed period value that is usually the case with throughout.
Enjoy !