Not all ntop users know that ntopng natively implements multitenancy support. Namely you can use ntopng to collect and analyse traffic from multiple users, and show to each user its own traffic, hiding all the rest. All you need to do is very simple
- Start ntopng and configure it to receive monitored traffic. You can do it via flows or packets.
- Create ntopng users and for each user specify the traffic restrictions.
ntopng will honour all this. Let’s now see this in detail.
Flow and Packet Collection
ntopng allows you to specify the data source. You do this with the -i option. For instance you can use “-i eth0” for capturing and analysing traffic on the eth0 interface, or “-i zmq://192.168.1.200:1234” for connecting to nProbe running on host 192.168.1.200 listening on port 1234. You can define multiple -i if you need to collect flows or capture packets on multiple interfaces, or (for flow only) you can run ntopng in collector mode. Below you can see depicted and example of two nProbes running on remote hosts, each capturing traffic on a local eth0 interface all sending flows to a central ntopng instance.
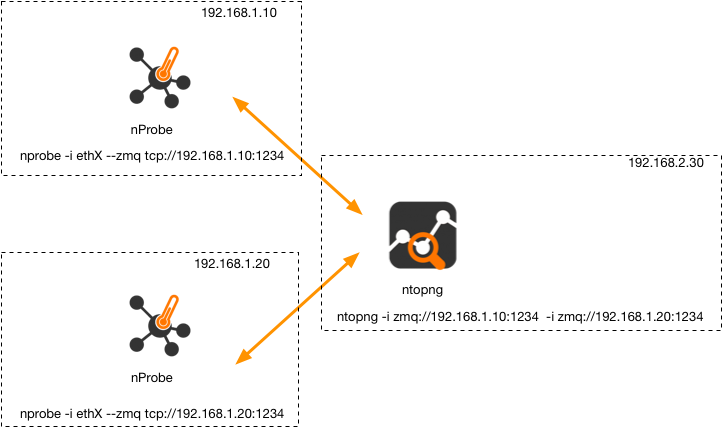
This setup is great if you want to keep split traffic originated from each remote nProbe. For instance this is the typical case of each remote nProbe monitoring traffic of two customers, and you want to avoid to mix this traffic on the ntopng side, by creating a virtual collector interface per customer. Note that in this setup, ntopng connects via ZMQ (on top of TCP) to the remote nProbe’s (i.e. each nProbe is the server accepting connections initiated by ntopng).
Instead if you have a customer with multiple remote sites, each monitored by a nProbe instance, you can send all flows to the same virtual ntopng collector interface,

The configuration is slightly different with respect to the previous case (and probably simpler), as in this case all the probes are configured in the same fashion all sending flows to the same ntopng.
Of course you can add to ntopng multiple interfaces, depending on your topology. Just keep in mind a couple of details:
- You can merge traffic on multiple interfaces using the view interface. For instance, if you add “-i view:all” ntopng creates yet another interface merging all the traffic from the existing interface. Note that “-i view” accepts interface name if you do not want to merge all traffic. Example “ntopng -i eth0 -i eth1 -i eth2 -i view:eth0,eth1” will create a view interface containing only traffic from eth0 and eth1 not not eth2.
- In ntopng each interface runs on a separate thread. So beside a little thread number increase as the number of interfaces increase, the ntopng performance will be better with respect to sending traffic to a single interface as in this case you can better exploit multicore architectures.
User Configuration
Now that the collection infrastructure has been setup we need to configure user rights. Namely, make sure that each user can see only the traffic that matters him/her and not all monitored traffic. Said that ntopng can also authenticate users via Radius and LDAP, suppose we want to create local users that can see part of the monitored traffic limiting its visibility to his traffic, hiding all the rest of traffic ntopng monitors.
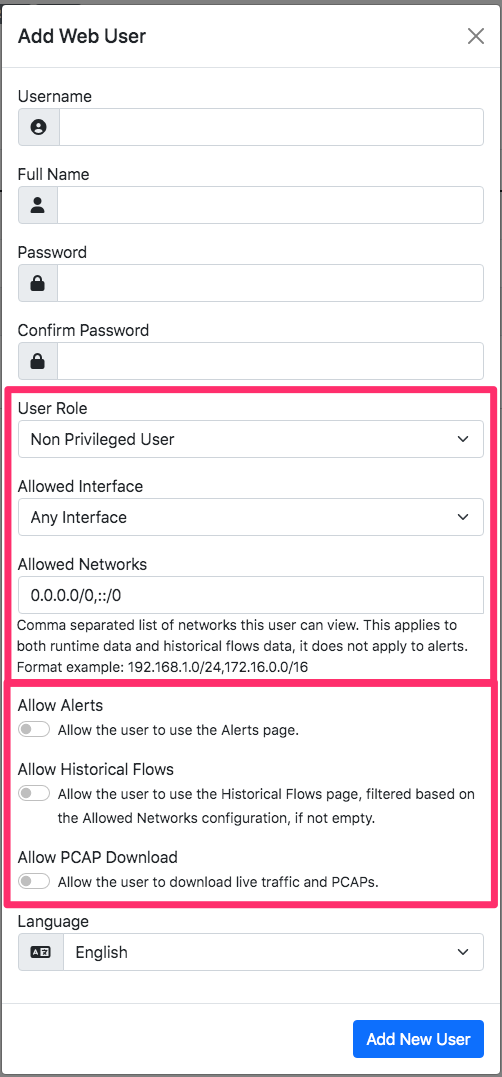
You can achieve this by creating a user (left sidebar Settings -> Users) as follows:
- Role: usually these users are non privileged, as privileged users could change the settings and thus overcome all limitations.
- If you have divided ingress traffic using interfaces, you can bind this user to an interface so that he could only see this interface and not the others. Instead if you need to restrict (also) based on the IP addresses this customer own, you can set them in the allowed network box.
- You can decide if these users can see alerts and historical flows (if ClickHouse has been enabled) by setting the toggles at the end of the table.
Done this, when a user connects to the ntopng web interface only the information that matters is shown and all the rest is hidden, this including historical flows and alerts. Note that some information might seem to be inconsistent (for instance the total throughput) as individual users can see interface counters but only a subset of flows/hosts/alerts.
That’s all. Happy ntopng multitenancy.
Enjoy!