Telemetry protocols such as sFlow/NetFlow, SNMP or packet-based traffic analysis are the source of data for network traffic monitoring. For a long time visibility was the main issue and people were attracted by new tools such as Grafana that allowed them to put on a screen a lot of data. A big misconception in this area is that the more data you see the less you understand as networks are constantly growing in both size and complexity and adding second or a third screen a PC isn’t the perfect way to scale up in known what is happening in a network. The score is a numerical indicator (present in all ntopng versions) that when non-null it indicates that some kind of issue is present: the higher is the score the worst is the problem associated, and thus the higher is the attention that a network operator should put on this resource.
The main source of score are the flows that have three score values:
- The flow score that indicates how bad is this flow. For instance a flow with severe retransmissions has a non null flow score.
- The flow source host score: a numerical value associated with the source host. For instance if in the above flow retransmissions are only destination->client the source host score for this flow will be zero, but if the source has also retransmissions the value will be positive.
- The flow destination host score: same as before but for the flow destination host.
As flows can have multiple issues, each issue found on a flow (for instance a TCP retransmissions or an outdated TLS version detected on a flow) contribute to the score. Hence the flow/source/destination score is the sum of all individual scores found on such flow. The flow score is computed by the flow user scripts (Settings -> User Scripts) when they are executed on flows.
The host score is computed as the sum of all active flow scores where such host is either client or server, complemented with additional scores eventually found on this host. The host score is increased as soon as a flows with non-zero score are observed, and it is decreased when the observed flows are purged. A typical example is a network scan: every individual flow part of scan might have a zero score, but as this host is doing a scan, this results on a non-zero score. The host score is used to compute the score of other elements such as the Autonomous System, a Network, an Interface score that is the sum of individual scores in an iterative process as described above.

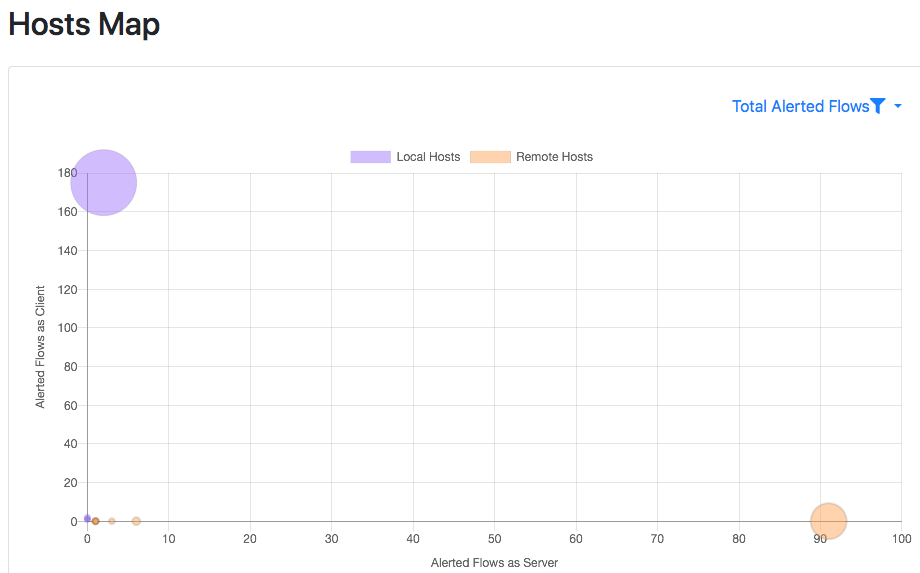
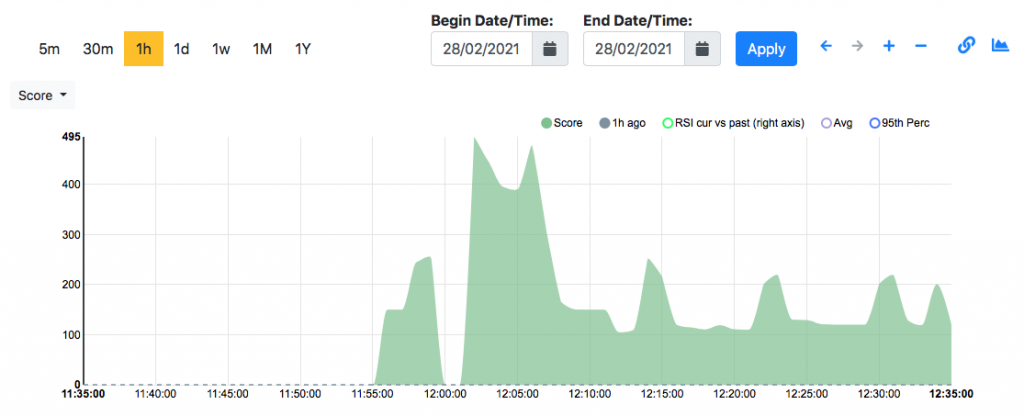
Using the flow score you can go to Maps -> Hosts Map to see hosts are creating (or receiving) most trouble. In the above picture if you move the mouse over the purple or salmon coloured circles, you will see the name of the host creating most problems as the circle radius is proportional to the score associated. Inside each host (please make sure that Settings -> Preferences -> TimeSeries -> Host Timeseries is set to full) you can see a timeseries of the host score that you can use to see how healthy is a host and when troubles have been detected.

The next challenge we’re working on is to implement a method that allows you to detect score changes and alert you when this happens. This to drive network analysts towards the problem without having to constantly watch hundred of micro-windows.
Enjoy !
