Fully Fledged and High Performance
Network Visibility
and Cybersecurity
Enterprise-ready network monitoring solutions with an Open-Source heart.
Network Telemetry
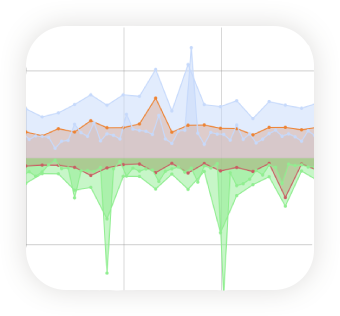
Network KPI and QoE Monitoring. Many locations, single pane of glass.
With an intuitive web interface and support for advanced analytics, ntopng helps network administrators monitor, troubleshoot, and optimize their infrastructure with ease.
450+
App Protocols
100+
Behavioural Checks

Solutions
What ntop can do for you
 Bandwidth Monitoring Monitor network traffic in real time using flow-based technologies or analysing traffic mirrors to ensure optimal performance and detect congestions or anomalies. Also collect from NetFlow or sFlow exporters.
 Observability Measure network and application performance metrics, detect performance degradation, high-latency paths, or packet drops before they impact users or services.
 Threat Detection Identify anomalous behaviours like lateral movements, data exfiltration or policy violations. Integrate with IDS/IPS systems and export enriched flow data for advanced correlation.
 Activities Logging Log and correlate user, device, and application activity across the network. Track who did what, when, and where, essential for compliance, auditing, and forensic investigations.
 Unlimited Scalability Deploy network probes at branch offices or WAN edges to monitor local traffic, export flows, and detect issues closer to the source. Scale horizontally and monitor distributed networks at 100 Gbit and more.
 Industrial Monitoring Bridge IT and OT/SCADA visibility, monitor industrial control systems, networked sensors, and traditional IT infrastructure in a unified view.
 DDoS Mitigation Deploy on-premise mitigation to block volumetric attacks at the edge ensuring service continuity without relying solely on upstream providers.
 Enterprise and Community Support Build your monitoring infrastructure with with the help of professional consultancy services, or leverage insights from a large community of industry professionals.
Our Products
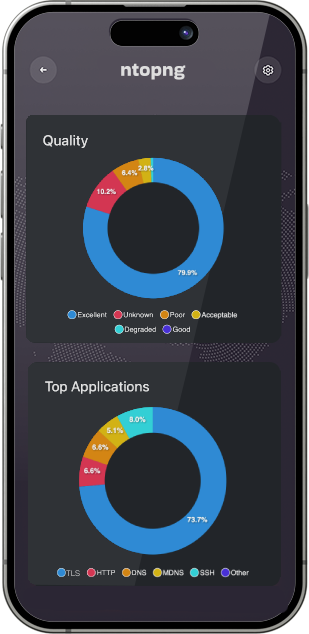
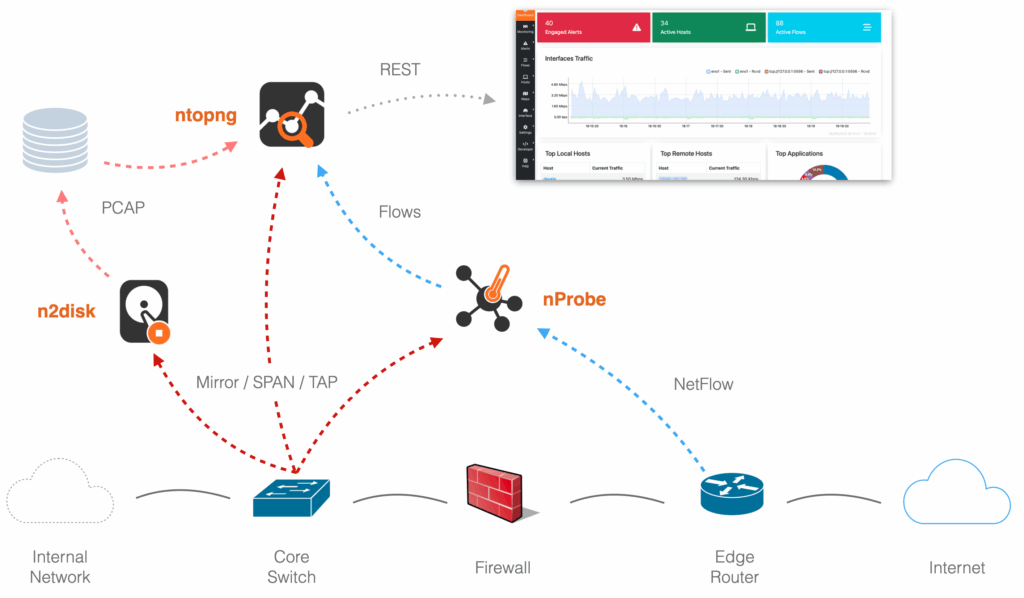
 ntopng Web-based analyzer with a centralized console that provides real-time and historical visibility, flow analytics, host and application tracking, and cybersecurity insights.
 nDPI Open Source Deep Packet Inspection toolkit for Layer 7 detection and metadata extraction. Used by our tools for advanced traffic classification, security analysis, and policy enforcement.
 nProbe An extensible flow exporter and collector supporting NetFlow v5/v9/IPFIX, JSON and many other formats. Enables deep traffic monitoring, metadata enrichment, and integration with third-party systems.
 nProbe Cento A high-performance, software-based flow probe designed for 100+ Gbps environments. Leverages PF_RING ZC for zero-copy packet processing and exports enriched NetFlow/IPFIX for scalable monitoring.
 n2disk Lossless network traffic recording with on-the-fly indexing and timestamping with nanosecond precision. Ideal for trobleshooting, HFT optimization, lawful interception and forensics.
 disk2n A PCAP traffic replay tool that injects previously captured packets from n2disk back into the network. Useful for testing, simulation, and forensic reconstruction with accurate timing.
 PF_RING A packet capture acceleration engine for Linux. Powers ntop’s tools with efficient zero-copy capture and transmission, ideal for high-performance monitoring and inline applications.
 nScrub An on-premise scrubbing solution that detects and blocks DDoS traffic in real time. Designed for HSP and large networks, nScrub filters volumetric attacks ensuring clean traffic reaches protected services.


Multi platform
Runs Anywhere You Need It.
Our software is designed for maximum flexibility — it runs seamlessly on major operating systems like Linux, Windows, and macOS, as well as on embedded platforms including Raspberry Pi, OpenWRT, and other ARM-based devices. Wherever your network lives, ntop is ready.
Turn key Solutions
nBox Appliances
Pre-packaged hardware appliances running ntop software, ideal for out-of-the-box traffic analysis, flow collection, and continuous traffic recording in enterprise and industrial environments.


25+ Years of
Monitoring Experience
We matured a strong experience developing network monitoring solutions and supporting thousands of customers worldwide for decades.
25
Years
Application
Frequently Asked Questions
What is ntop and why do I need it?
- ntop is a software company specializing in high-performance network traffic monitoring tools. We develop both open-source and commercial applications for real-time traffic analysis, cybersecurity, and enhanced network visibility. Our tools are fully compatible with industry standard network monitoring technologies including NetFlow and PCAP.
Is ntop software free to use?
- ntop software is available in both Community (free and open source) and Professional/Enterprise (commercial) editions. The commercial editions include additional features and support options.
Where can I download ntop software?
- You can download binaries for ntop software or access our repositories for major Linux distributions from the Software Installation section.
- You can download the source code from GitHub at github.com/ntop
How do I install and configure the software?
- Installation guides and documentation for ntopng and the other tools are available in the Software Installation page and our User’s Guide.
- We also provide Docker images and pre-built packages for quick deployment.
Does ntop offer commercial support?
- Yes. We provide professional support services including custom development, priority issue handling, and consulting. Visit the Professional Services page for details.