Introduction
When I first started investigating network security incidents, I felt overwhelmed by the complexity. Packets flying everywhere, mysterious connections, alerts I didn’t understand—sound familiar? Whether you’re an IT professional new to security, a small business owner wearing multiple hats, or simply someone who wants to understand what’s really happening on your network, this guide is for you.
ntopng is more than just a network monitoring tool—it’s your window into the invisible world of network traffic. And the best part? You don’t need to be a security veteran to start using it effectively .
In this beginner-friendly guide, we’ll walk through real-world security investigations using ntopng. By the end, you’ll know how to spot anomalies, investigate suspicious hosts, and understand what those alerts actually mean.
Part 1: Getting Started with ntopng
Installation in Under 5 Minutes
Let’s get ntopng up and running quickly. On Ubuntu Linux, it’s straightforward (see https://packages.ntop.org for details):
sudo apt-get update
sudo apt-get install ntopng
After installation, you’ll want to configure basic settings. The main configuration file lives at /etc/ntopng.conf. Here’s a simple starting configuration:
text
--http-port=3000
--interface=eth0
--local-networks="192.168.1.0/24"
For the web interface, ntopng runs on port 3000 by default. If you’re using a firewall, open it up:
bash
sudo ufw allow 3000
Now open your browser and navigate to http://<your-server-ip>:3000. The default credentials are admin/admin—you’ll be prompted to change the password immediately .
Your First Look at the Dashboard
After logging in, you’ll see the dashboard. Don’t let the information density intimidate you—we’ll focus on the security-relevant parts first.
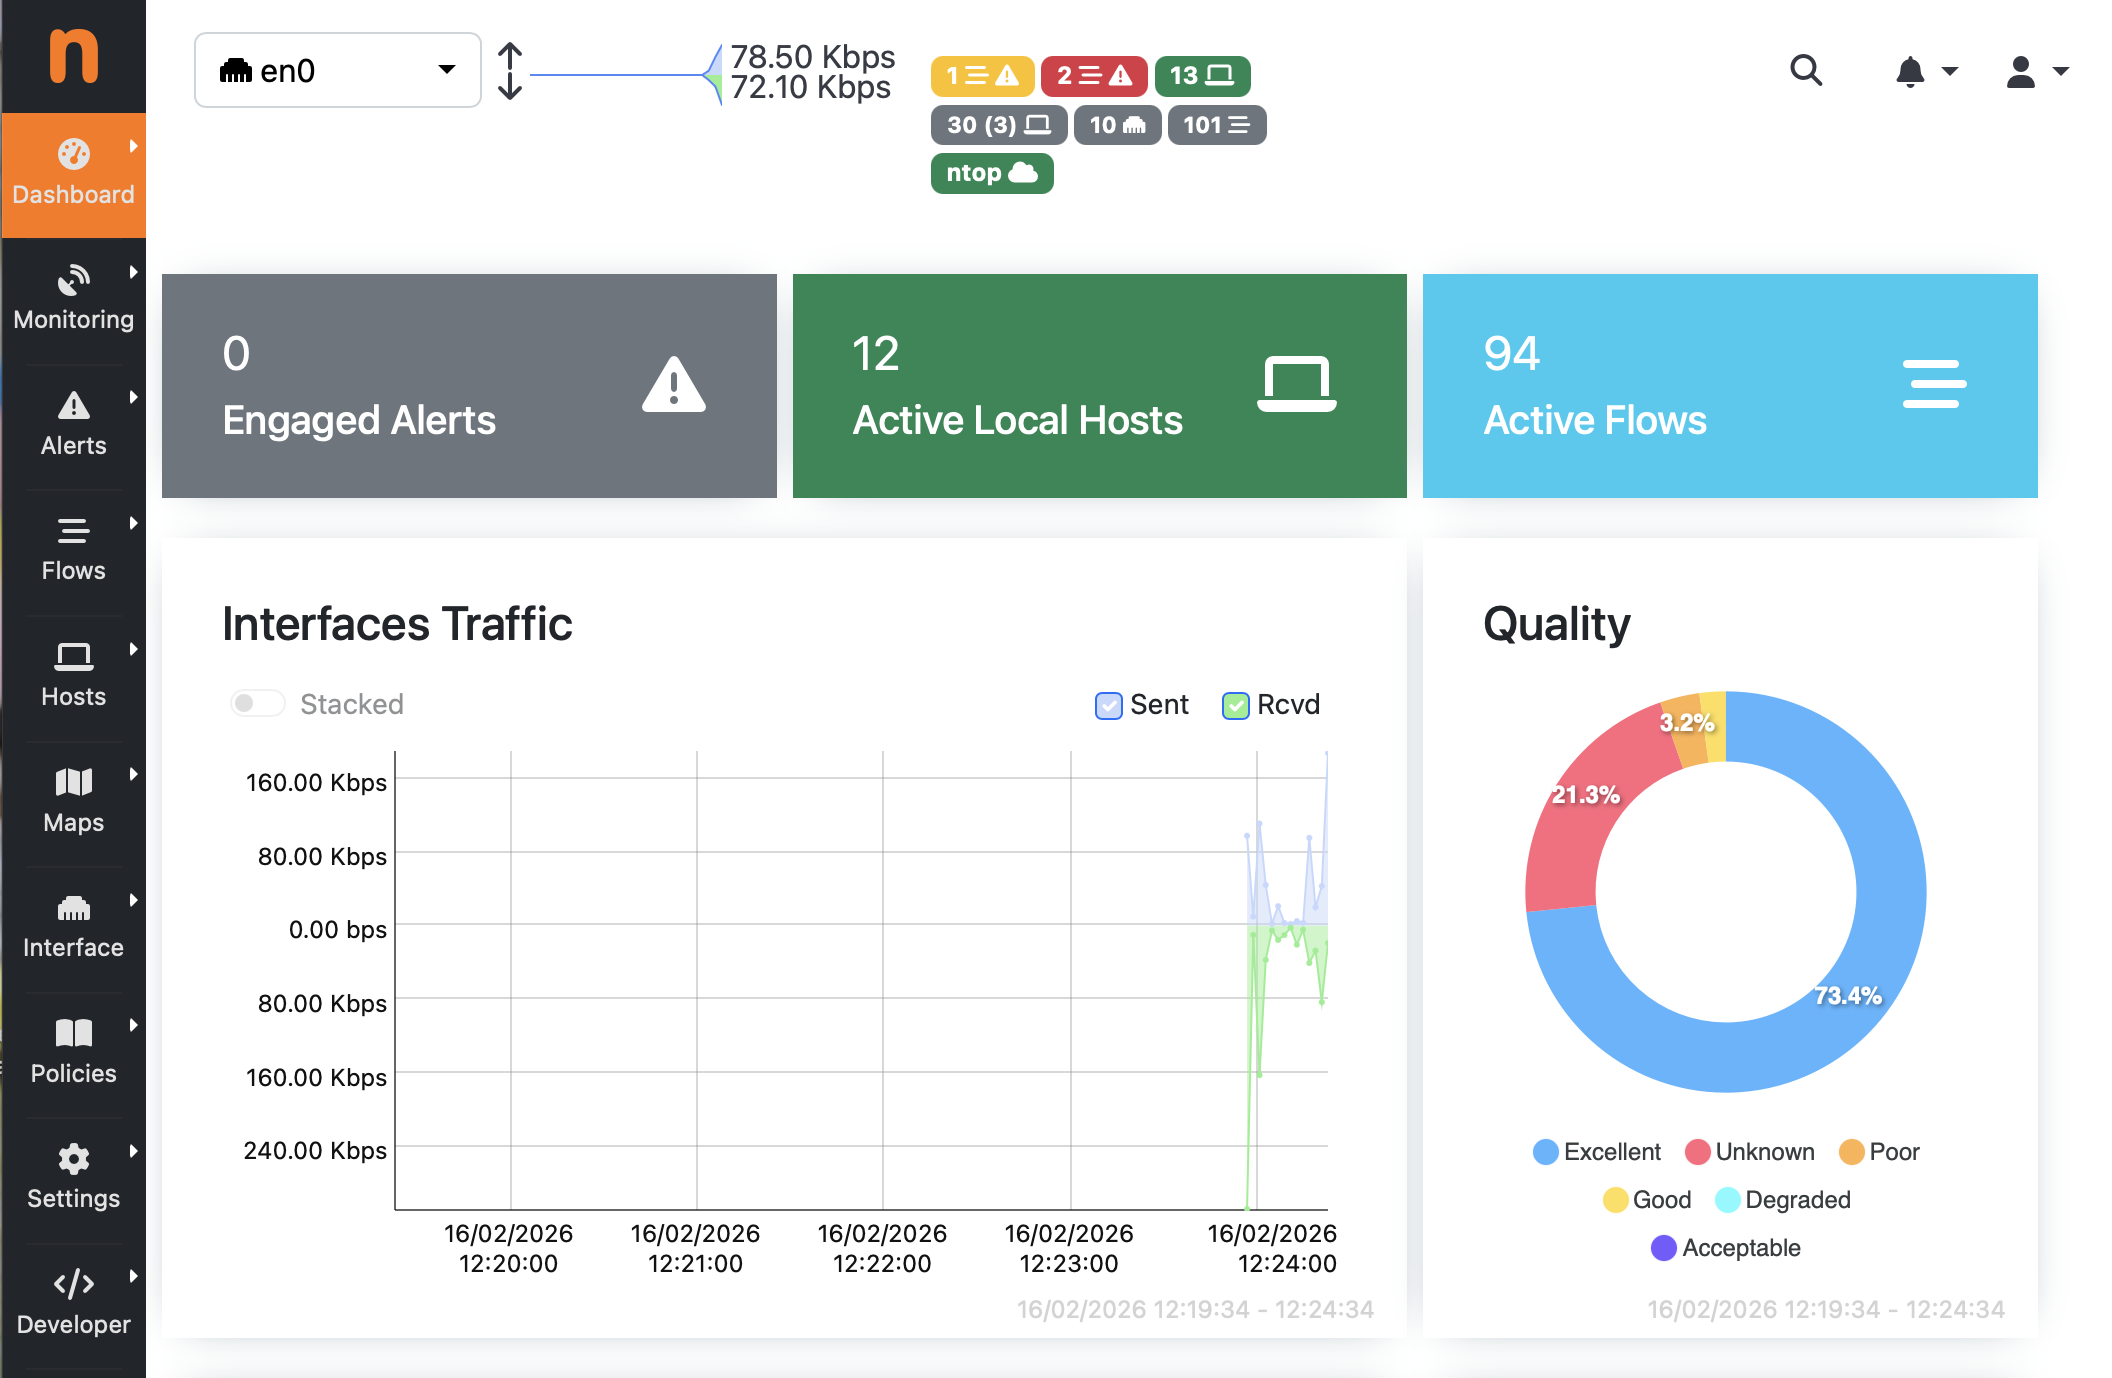
The dashboard shows you:
- Top talkers: Which devices are sending/receiving the most traffic
- Protocol distribution: What kinds of traffic are flowing
- Active alerts: Any security issues detected so far
For security investigations, the most important element is the alerts counter—that’s your early warning system .
Part 2: Understanding Security Scores and Alerts
The Security Score System
ntopng uses a risk-based scoring approach that’s perfect for beginners because it does the heavy lifting for you. Instead of memorizing what’s “normal,” ntopng assigns scores to hosts based on their behavior .
How scoring works:
- Malicious flow detection: +210 points
- Suspicious activity: +200 points
- Individual alerts: Various point values based on severity
The score isn’t an absolute measure—there’s no magic number where “above 1000 is bad.” Instead, think of it as an indicator intensity meter. A single host with a score of 20,000 deserves immediate attention .
Types of Security Alerts
ntopng generates various alerts that matter for security investigations:
Part 3: Real Investigation Scenario – Tracking Malware on Your Network
Let’s walk through a complete investigation using a real example. We’ll follow the footsteps of someone who used ntopng to detect Qakbot banking trojan activity .
Scenario Overview
Imagine you notice some strange behavior on your network—maybe a user complains about slow performance, or you see unusual outgoing connections in your firewall logs. You suspect malware but don’t know where to start.
Step 1: Identify Suspicious Hosts
Start by looking at the Hosts view. Sort by Alerted Flows or Security Score. In our example investigation, one host stood out immediately :
- IP address:
10.12.7.101 - Security score: 19,905 (extremely high for a single host)
- Alerted flows: 168 out of 634 total flows (roughly 25% of all traffic from this host had alerts)
- SMTP flows: 152 connections to various mail servers—very unusual for a typical client
What to look for as a beginner:
- Hosts with security scores significantly higher than others
- Unusual protocol usage (like a workstation running many SMTP connections)
- High percentage of alerted flows
Step 2: Examine Flow Alerts
Click on the caution sign ⚠️ next to the suspicious host to see detailed flow alerts. Sort by score to see the most severe issues first .
In our example, the top alert was “TLS Certificate Self-signed” —but digging deeper revealed much more.
Step 3: Drill Down into Suspicious Flows
When you find an interesting alert, click the magnifying glass to see flow details. In the Qakbot investigation, examining one alert revealed :
- Suspicious URL:
hXXp://amajai-technologies[.]world/— note how this mimicsakamaitechnologies.com(look-alike domain) - Self-signed TLS certificate with empty issuer/subject fields — major red flag
- JA4 fingerprint marked as malicious in Abuse.ch‘s SSL blacklist
The JA4 fingerprint was particularly telling—it identified the client as using a fingerprint associated with the Gozi banking trojan, a relative of Qakbot .
Step 4: Correlate with Other Evidence
Now look at the broader context:
- The host is identified as Windows 8 (plausible for a workstation)
- 152 SMTP flows suggest spambot activity (Qakbot often distributes spam)
- Multiple self-signed certificates to suspicious domains
Conclusion: This host is almost certainly infected and should be isolated for further investigation.
Part 4: Using Vulnerability Scanning for Proactive Security
ntopng includes built-in vulnerability scanning that integrates nmap and vulscan to detect known vulnerabilities (CVEs) and open ports .
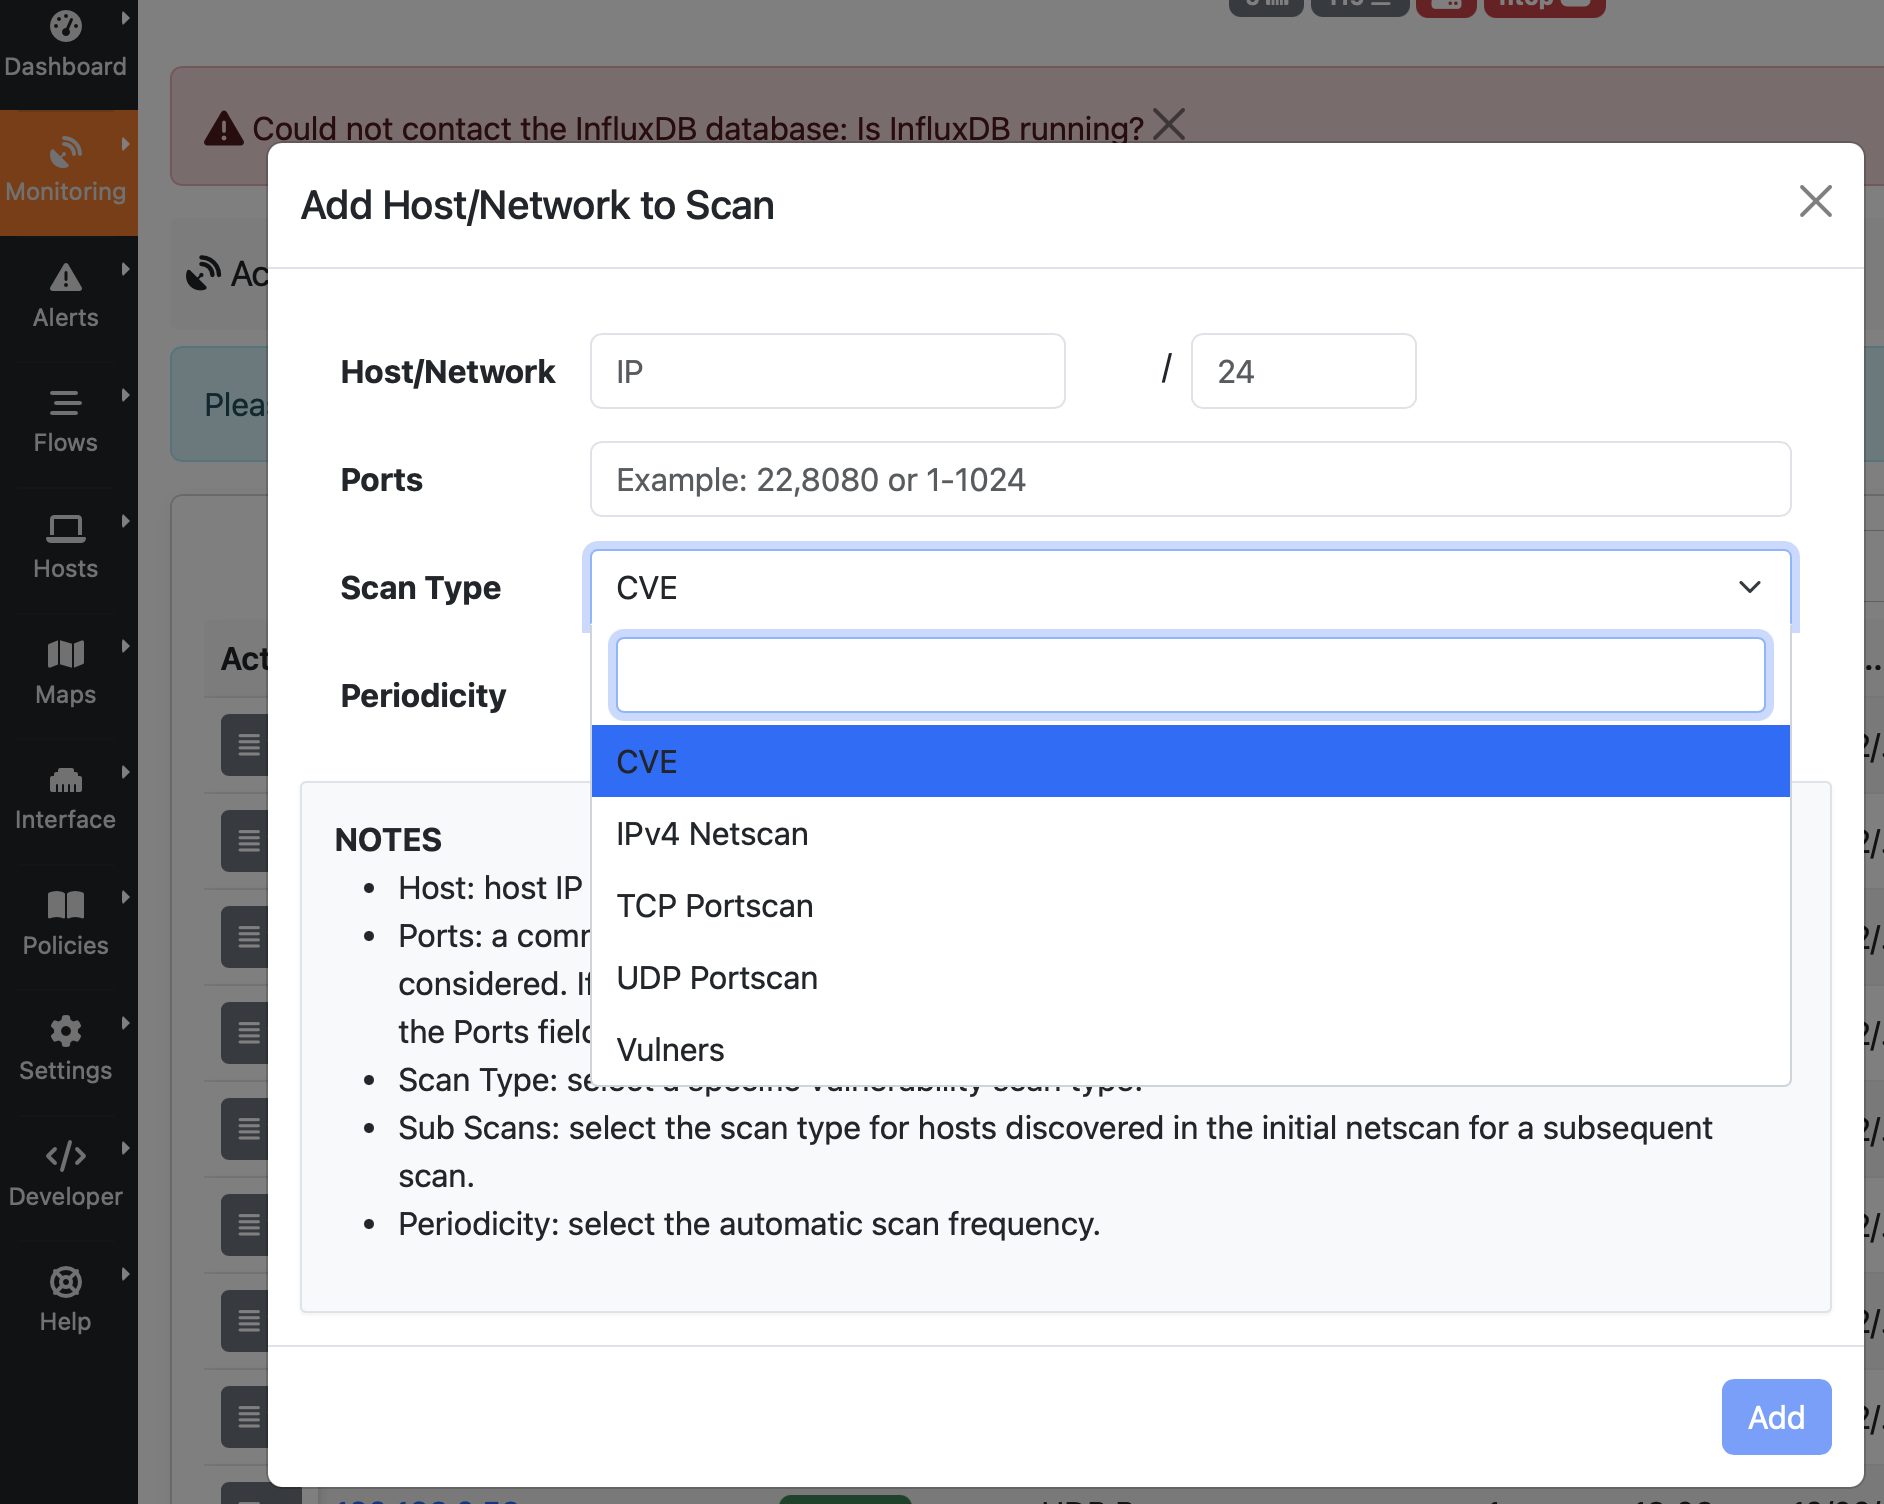
Setting Up Your First Vulnerability Scan
- Navigate to Vulnerability Scan in the left sidebar (Menu Monitoring -> Active Scan). Note that you can select thsi only if you have enabled ntopng from a physical network interfaces as in this example (i.e. eth0) and not a ZMQ interface.
- Click the + icon to add a host
- Select the target IP or network
- Choose scan type:
Understanding Scan Results
After scanning, ntopng shows you:
- Open ports detected
- CVEs found with severity scores
- Ghost ports: Ports open according to the scan but not seeing traffic (potential backdoors)
- Filtered ports: Ports seeing traffic but not detected by scan (firewall rules?)
Real-world example: If vulnerability scanning shows port 3389 (RDP) open on a host that never uses RDP according to traffic monitoring, that’s a potential compromise indicator.
Scheduling Regular Scans
For ongoing protection, schedule periodic scans:
When new CVEs appear or ports change, ntopng generates alerts automatically.
Part 5: Detecting DoS Attacks and Anomalies
Distributed Denial of Service (DDoS) attacks can cripple your network, but ntopng helps you spot them early .
What to Watch For
Traffic volume anomalies:
- Sudden spikes in incoming traffic
- Unusual protocol distribution (e.g., 90% UDP when normally 20%)
- Single IP consuming disproportionate bandwidth
Connection pattern anomalies:
- Thousands of half-open connections (SYN flood)
- Repeated connections to the same port across many sources
- Periodic probing behavior
Beginner tip: The Host Map with “Alerted Flows” filter gives you a visual overview of which hosts are generating security alerts—circles get bigger as alert count increases .
Part 6: Practical Workflows for Daily Security Checks
You don’t need to spend hours in ntopng every day. Here’s a 10-minute daily security routine:
Morning Check (5 minutes)
- Check dashboard alerts: Any red alerts overnight?
- Review top talkers: Any unfamiliar hosts at the top?
- Scan for high-scoring hosts: Sort by security score
Weekly Deep Dive (30 minutes)
- Review vulnerability scan results: New CVEs? New open ports?
- Examine periodic alerts: Any suspicious recurring patterns?
- Check blacklist hits: Any communication with known bad IPs?
Monthly Review (1 hour)
- Generate vulnerability reports for management
- Compare scan results month-over-month: Improving or worsening?
- Review alert trends: What triggered most alerts? Tune if needed
Part 7: Responding to Security Incidents
When you find something suspicious, here’s a simple response framework:
1. Isolate and Verify
- If possible, quarantine the host from the network
- Confirm findings with additional tools (packet capture, endpoint scanning)
2. Investigate Scope
- In ntopng, check what other hosts the suspicious device communicated with
- Look for similar patterns on other hosts
- Check historical data—how long has this been happening?
3. Remediate
4. Learn and Improve
- Add new indicators to your watchlists
- Adjust alert thresholds if needed
- Document findings for future reference
Conclusion: Your Journey from Beginner to Confident Investigator
Network security investigation doesn’t require a computer science degree or years of experience. With ntopng, you have a powerful ally that translates complex network behavior into understandable insights.
Remember these key takeaways:
- Start simple: Focus on security scores and alerted flows first
- Follow the outliers: High scores, unusual protocols, and excessive alerts point to problems
- Drill down methodically: Host → Flows → Individual flow details
- Correlate multiple signals: Combine traffic patterns, vulnerability scans, and blacklist checks
- Take action: Even simple containment buys you time for deeper investigation
The ntopng community is here to help. Join the discussions, share your experiences, and don’t hesitate to ask questions . Every expert was once a beginner, and every investigation makes you better at the next one.
Ready to start your first investigation? Log into ntopng right now, find the host with the highest security score, and click through to see what’s happening. That single action might be the first step toward catching a real security threat.
Have questions about your own investigations? The ntopng community welcomes your stories and questions—reach out and share your experiences!
Enjoy !