NetFlow has been originally designed to monitor network traffic using simple bytes/packets metrics. For TCP, it is also possible to know what TCP flags (that indicate the connection state) have been used on a flow, as NetFlow/IPFIX exports them as a cumulative OR of all TCP flags of the flow. This allows you to know if a SYN flag has been observed on a flow but not the number of SYN flags that have been reported for a flow. No other information elements have been implemented to report detailed TCP flow information, performance metrics, and quality.
In all ntop tools (ntopng, nProbe, and nProbe Cento), we have implemented detailed measurements for reporting users, not just traditional bytes/packets metrics, but also detailed information about the TCP connection status.
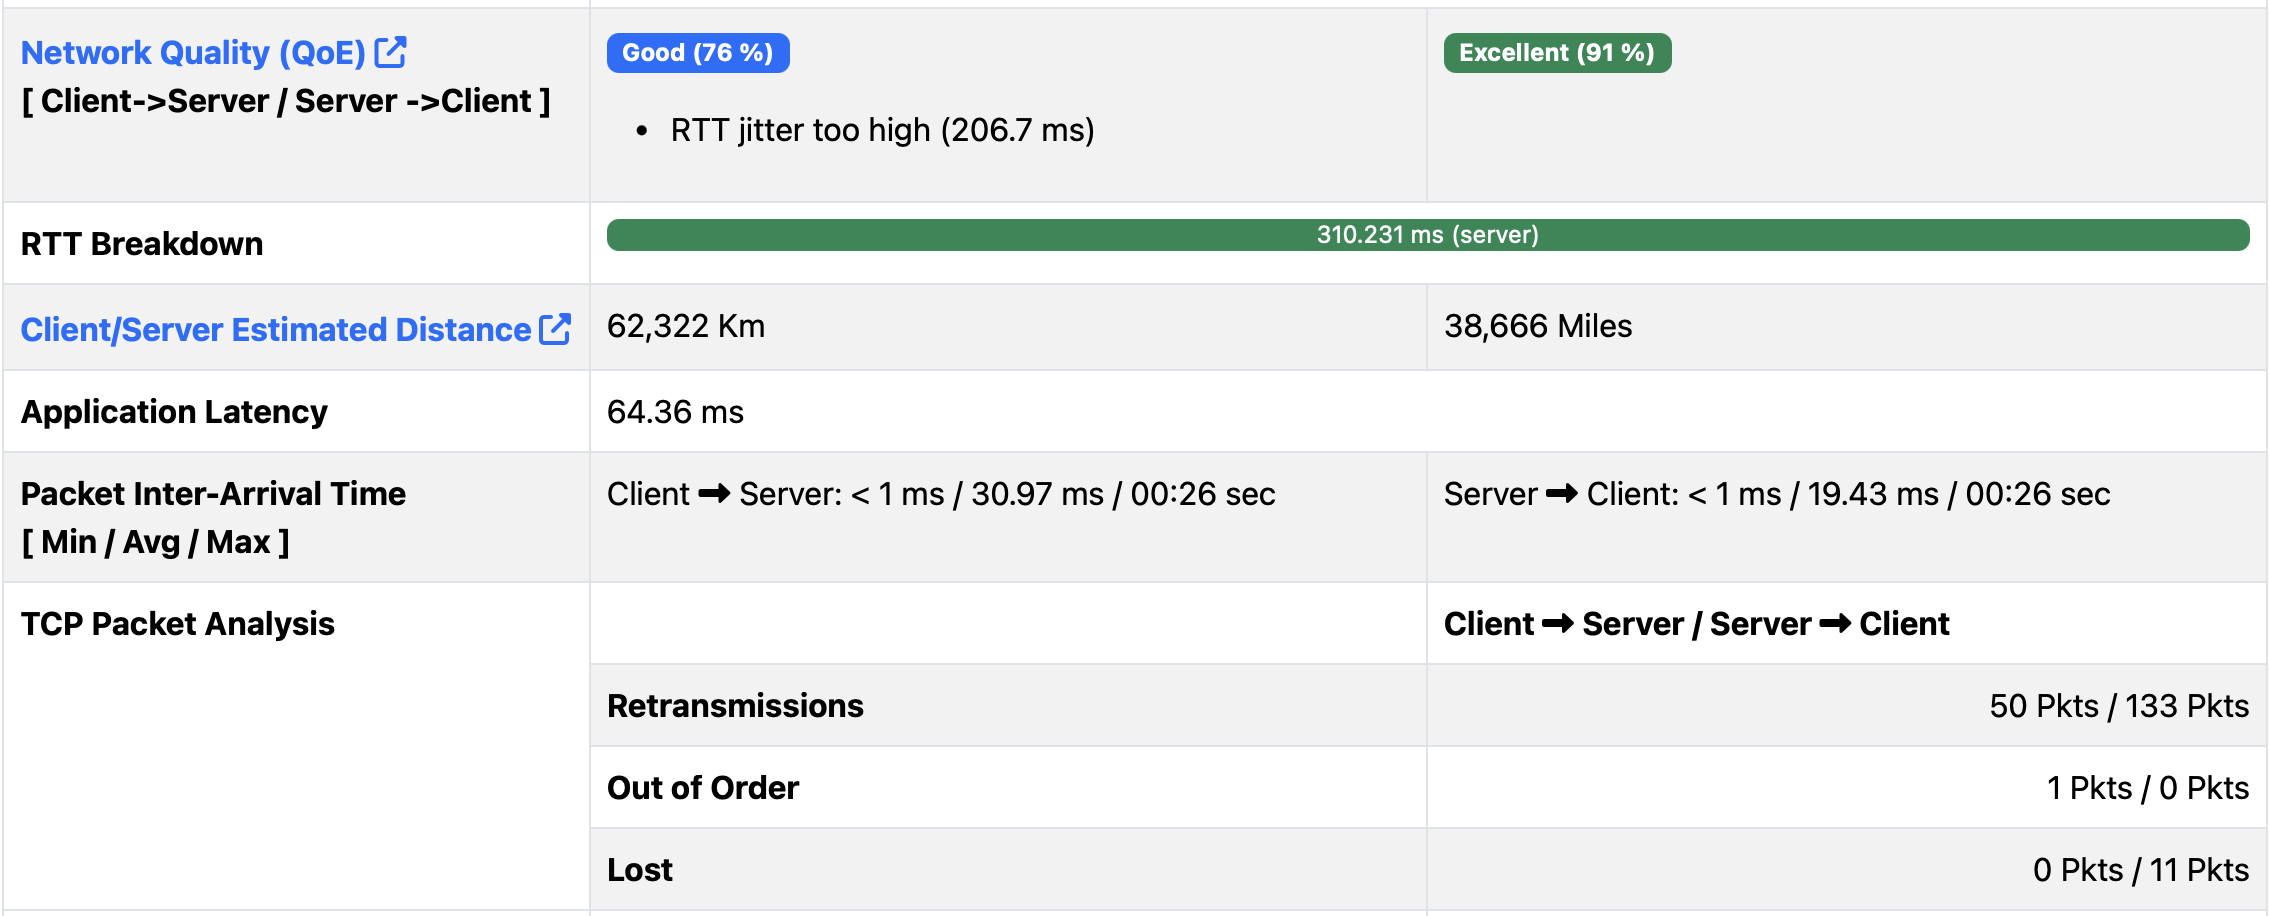
In additional to the network quality (QoE) that we have already discussed some time ago, ntop tools report:
- Network Latency
- RTT (Round-Trip Time)
- IAT (Packet Inter-Arrival Time)
- TCP Statistics (Retransmissions, Packets Out-of-Order, Packets Lost).
- TCP zero-window packets
Furthermore, as SYN/RST-based scans are pretty popular on the Internet, we have enhanced our tools to report not just the presence of a flag but also its number.
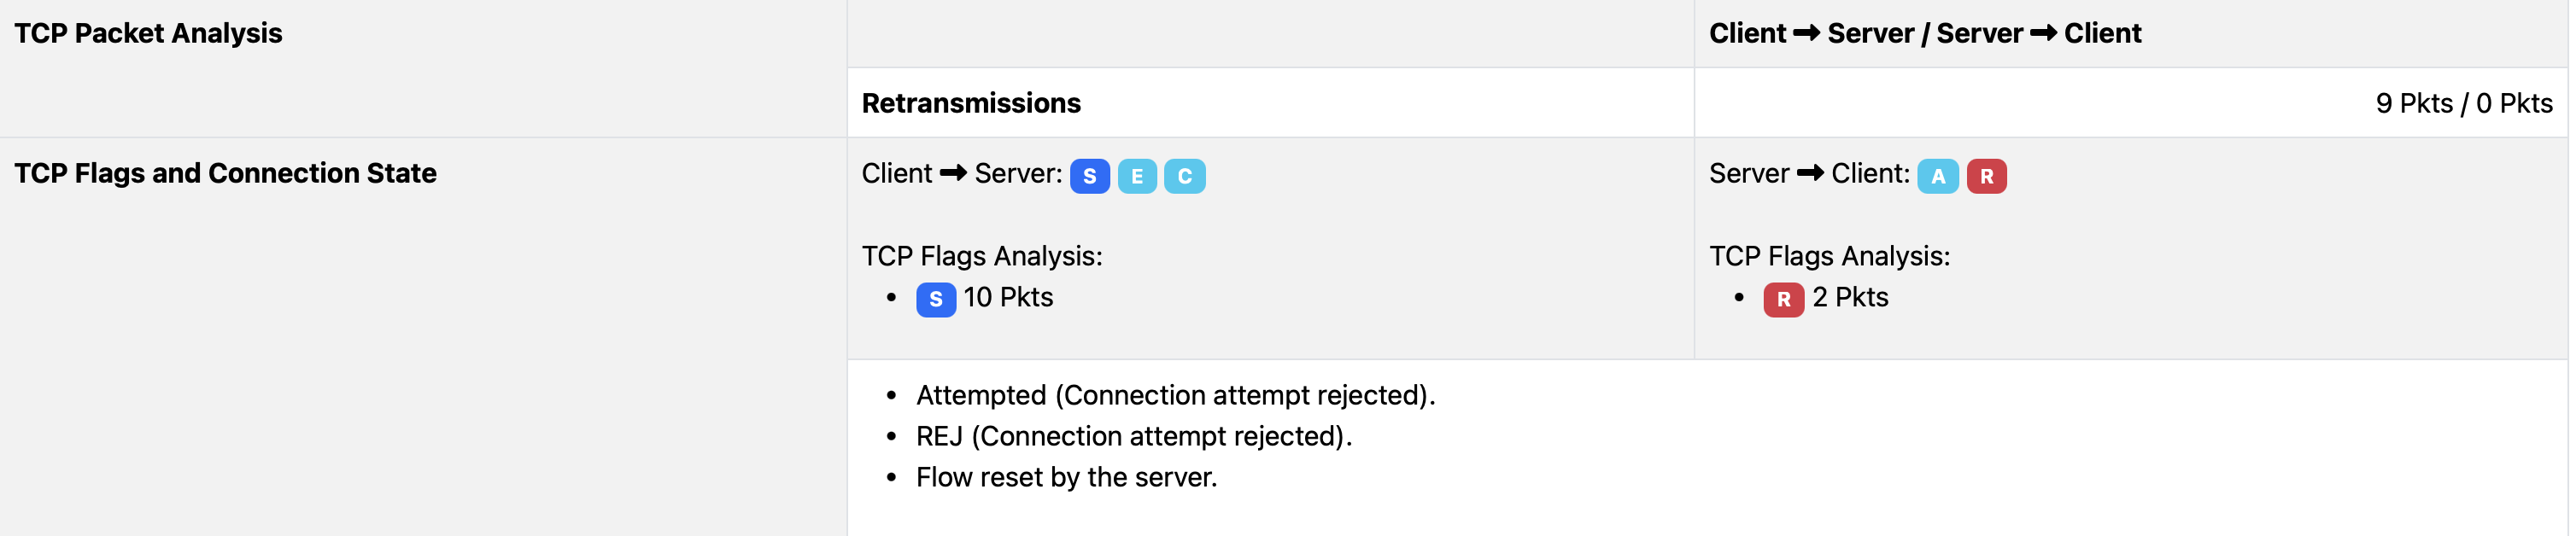
In the latest dev branch (see above) version, we can now report how many packets with relevant TCP flags (SYN, FIN, RST) have been observed, by enhancing flow-based analytics with statistical metrics typical of packet-based analysis. Note that in order to report the above information, you need to update the ntop tools and run nProbe/nProbe Cento on packets (example “nprobe -i eth0 –zmq tcp://127.0.0.1:1234”) as when nProbe is used in flow-collection mode, the above statistics cannot be reported as they have not been exported by the router. All the above measurements are enabled automatically by default, so you do not need to modify anything in the application configuration, but just update the ntop tools to the latest version.
In conclusion, using ntop tools, you can now have the same level of detail both with packets and flows. This is in addition to nDPI layer-7 statistics that we have already discussed several times on this blog.
Enjoy !