Transform network data into actionable infrastructure decisions with ntopng
Introduction
Every IT team faces the same challenge: how much network capacity is enough? Too little, and applications grind to a halt during peak hours. Too much, and you’re wasting budget on infrastructure you don’t need.
Capacity planning doesn’t have to be guesswork. With the right tools and methodology, you can predict growth, identify bottlenecks before they cause outages, and make data-driven decisions about infrastructure investments.
ntopng—the high-performance network traffic analyzer—gives you the visibility needed for effective capacity planning . Whether you’re managing a small office network or a large enterprise infrastructure, ntopng provides the metrics that matter: bandwidth utilization, protocol distribution, top talkers, and historical trends.
In this guide, we’ll walk through practical capacity planning using ntop tools, from basic monitoring to advanced forecasting techniques.
Part 1: Why Traditional Capacity Planning Falls Short
Before diving into ntopng, let’s understand why many capacity planning efforts fail:
The Problem with “Peak Hours” Only
Many teams look only at peak utilization and multiply by a safety factor. This approach misses critical patterns:
- Seasonal variations (month-end reporting, holiday traffic)
- Application shifts (new services consuming unexpected bandwidth)
- Asymmetric growth (uploads growing faster than downloads)
The Visibility Gap
Standard SNMP monitoring tells you how much traffic, but not what kind of traffic . Without application visibility, you might over-provision for “bandwidth hogs” that are actually business-critical applications, while missing optimization opportunities for non-essential traffic.
The Reactive Trap
Without historical trending, you’re always reacting to problems rather than anticipating them. By the time users complain, the capacity issue is already affecting productivity.
ntopng solves these problems by providing deep packet inspection, historical data storage, and customizable alerting—all in a single platform .
Part 2: ntopng Metrics That Matter for Capacity Planning
Let’s explore the specific ntopng metrics you’ll use for effective capacity planning.
2.1 Bandwidth Utilization Trends
The foundation of capacity planning is understanding normal vs. abnormal bandwidth usage. ntopng’s dashboard provides real-time and historical views:
- Interface throughput graphs: See inbound/outbound traffic over selectable timeframes
- Peak utilization records: Identify when your network is under maximum stress
- Percentile-based analysis: 95th percentile calculations for accurate billing/capacity modeling
What to watch: Look for sustained utilization above 70% on critical links—this indicates capacity may soon become a bottleneck.
2.2 Top Talkers and Consumers
Knowing who uses bandwidth is as important as knowing how much. ntopng’s host views show you :
- Top local hosts: Which internal devices generate the most traffic
- Top remote hosts: External destinations consuming your bandwidth
- Conversation pairs: Traffic between specific endpoints
Real-world example: A sudden shift in top talkers might indicate a new application deployment, a compromised host, or changing user behavior—all factors in capacity planning.
2.3 Protocol and Application Distribution
This is where ntopng’s nDPI deep packet inspection shines . You can see exactly which applications drive your traffic:
- Web browsing (HTTP/HTTPS)
- Video streaming (YouTube, Netflix, Zoom)
- File transfers (FTP, SMB, NFS)
- Database traffic (MySQL, PostgreSQL, MongoDB)
- Cloud services (Office 365, Google Workspace, AWS)
Why this matters: If 60% of your bandwidth is video streaming, capacity planning differs from a network dominated by database replication. You might prioritize QoS policies before adding bandwidth.
2.4 TCP Performance Indicators
Bandwidth isn’t the only capacity constraint. Poor TCP performance can make ample bandwidth unusable :
- Retransmission rates: High retransmissions indicate congestion or packet loss
- Round-trip time (RTT): Increasing latency suggests growing queues
- Out-of-order packets: May indicate path issues or load balancer problems
These metrics help you distinguish between “need more bandwidth” and “need better network optimization.”
2.5 Flow Records and Connection Patterns
For advanced capacity planning, ntopng’s flow data reveals :
- Concurrent connection counts: How many simultaneous sessions your firewall/load balancer handles
- New connection rates: Critical for planning stateful device capacity
- Flow duration distributions: Short vs. long-lived flows indicate different application patterns
Part 3: Setting Up ntopng for Capacity Planning
3.1 Installation and Basic Configuration
Let’s get ntopng running with capacity planning in mind. On Ubuntu Linux :
bash
# Add the ntop repository
wget https://packages.ntop.org/apt-stable/42.04/all/apt-ntop-stable.deb
apt install ./apt-ntop-stable.deb
apt update

# Install ntopng and dependencies
apt install -y ntopng
3.2 Optimized Configuration for Long-Term Data
For capacity planning, you need historical data. Configure ntopng to store what matters :
# /etc/ntopng/ntopng.conf

--http-port=3000
--interface=eth0
--local-networks="192.168.0.0/16"

# Enable historical data storage
-F=clickhouse

# Increase host/flow limits for production networks
-x 1000000    # Max hosts
-X 2000000    # Max flows

# DNS resolution for better host identification
--dns-mode=1
3.3 Enabling SNMP for Infrastructure Visibility
ntopng can poll network devices via SNMP, giving you complete infrastructure visibility :
- Navigate to Settings > SNMP Devices
- Add your routers, switches, and firewalls
- Enable interface role tagging (core/distribution/access) for better topology understanding
- Configure SNMPv3 for production environments
This integration lets you correlate application traffic with interface utilization—essential for identifying exactly where capacity constraints exist.
3.4 Setting Up NetFlow/sFlow Collection
For router/switch traffic analysis, configure ntopng as a flow collector :
# On your ntopng server, enable flow collection
ntopng -i "tcp://*:5556" # For NetFlow/IPFIX
Then configure your network devices to export flows to your ntopng server IP on port 5556.
Part 4: Building Your Capacity Planning Baseline
Before predicting future needs, you must understand your current network. Here’s how to establish a baseline with ntopng.
4.1 The 30-Day Baseline
Collect at least 30 days of data to account for weekly and monthly patterns. Focus on:
- Daily peak hours (typically 9-11 AM and 1-4 PM)
- Weekly variations (Mondays often differ from Fridays)
- Month-end patterns (financial reporting, backups)
4.2 Key Baseline Metrics to Document
Create a capacity planning spreadsheet with these metrics from ntopng:
| Metric | Current Value | Growth Trend | Threshold |
|---|---|---|---|
| Peak inbound bandwidth | 450 Mbps | +15% YoY | 80% of link |
| Peak outbound bandwidth | 120 Mbps | +8% YoY | 80% of link |
| Concurrent connections | 8,500 | +22% YoY | 80% of firewall limit |
| Top protocol % | HTTPS (65%) | Stable | N/A |
| Peak packet rate | 85K pps | +12% YoY | Device-specific |
| DNS queries/sec | 320 | +18% YoY | 1,000 |
4.3 Identifying Normal Ranges
ntopng’s timeseries charts help you visualize normal variability. Export this data weekly and calculate :
- Average peak utilization
- Standard deviation during business hours
- 99th percentile peaks (what you should plan for)
Part 5: Advanced Capacity Planning Techniques with ntopng
5.1 Trend Analysis and Forecasting
With sufficient historical data, you can project future needs. ntopng’s historical reporting shows trends over time :
- Navigate to Reports > Historical
- Select interface or host
- Choose Traffic metric
- Set time range (last 90 days, last year)
- Export data for trendline analysis
Simple forecasting method: Calculate month-over-month growth rate and apply to current utilization:
Projected Peak = Current Peak × (1 + Monthly Growth Rate)^Months
If your peak is 450 Mbps growing at 2% monthly, in 12 months you’ll need:
450 × (1.02)^12 = 450 × 1.268 = 570 Mbps
5.2 Application-Aware Capacity Planning
Different applications have different growth trajectories. ntopng’s protocol breakdown lets you plan by application category :
Example analysis:
- Video conferencing traffic: +35% YoY (remote work growth)
- Database replication: +5% YoY (stable)
- Cloud storage sync: +50% YoY (new tool adoption)
This granularity helps you:
- Justify SD-WAN upgrades for real-time traffic
- Plan QoS policies before congestion
- Identify optimization opportunities (caching for video traffic)
5.3 What-If Scenario Modeling
Use ntopng data to model scenarios:
Scenario A: New Office Opening
- Current remote worker traffic: 25 Mbps per 100 users
- New office: 50 users
- Projected additional bandwidth: 12.5 Mbps peak
Scenario B: Cloud Migration
- Current on-premise application traffic: 80 Mbps internal
- Post-migration: becomes 80 Mbps internet-bound
- Impact: Internet link utilization doubles
5.4 Autonomous Systems Analysis for ISP/Enterprise
If you’re an ISP or multi-homed enterprise, ntopng 6.6 introduces Autonomous Systems (AS) analytics :
- AS traffic matrices: See traffic between transit and origin ASes
- Top AS contributors: Which networks drive your traffic
- AS-based trending: Track growth by upstream provider
This helps answer questions like: “Is our transit provider traffic growing faster than our peering traffic? Should we add another peer?”
Part 6: Real-World Capacity Planning Examples
Example 1: The Fast-Growing SaaS Company
Situation: A 200-person SaaS company with 500 Mbps internet link. Users report slow performance during midday.
ntopng investigation:
- Peak utilization: 420 Mbps (84% of link)
- Top protocols: Video conferencing (40%), cloud storage (25%), web traffic (20%)
- Video traffic grew 60% year-over-year
- Cloud storage sync traffic doubled in 6 months
Recommendation:
- Upgrade link to 1 Gbps within 6 months (based on 18% quarterly growth)
- Implement QoS prioritizing video conferencing
- Consider local caching for cloud storage
Example 2: The Regional Hospital
Situation: Hospital with 10 Gbps backbone, planning EMR system upgrade.
ntopng investigation:
- Current EMR traffic: 150 Mbps average, 400 Mbps peak
- EMR traffic patterns: Highest during 8-10 AM (morning rounds)
- Database replication traffic: 200 Mbps continuous
- PACS imaging traffic: 300 Mbps bursty
Recommendation:
- Upgrade core switches to 25 Gbps for imaging traffic
- Isolate PACS traffic on separate VLAN
- Plan for 30% EMR growth post-upgrade
Example 3: The Service Provider ISP
Situation: Regional ISP with 100 Gbps upstream, planning capacity for 20% annual subscriber growth.
- Peak subscriber traffic: 85 Gbps
- Video streaming: 70% of traffic (Netflix, YouTube, Prime)
- Gaming traffic: 15% and growing 40% YoY
- Business traffic: 10% but higher priority
Recommendation:
- Upgrade to 200 Gbps within 18 months
- Peer with major CDNs to reduce transit costs
- Implement subscriber quotas for heavy users
Part 7: Setting Up Alerts for Proactive Planning
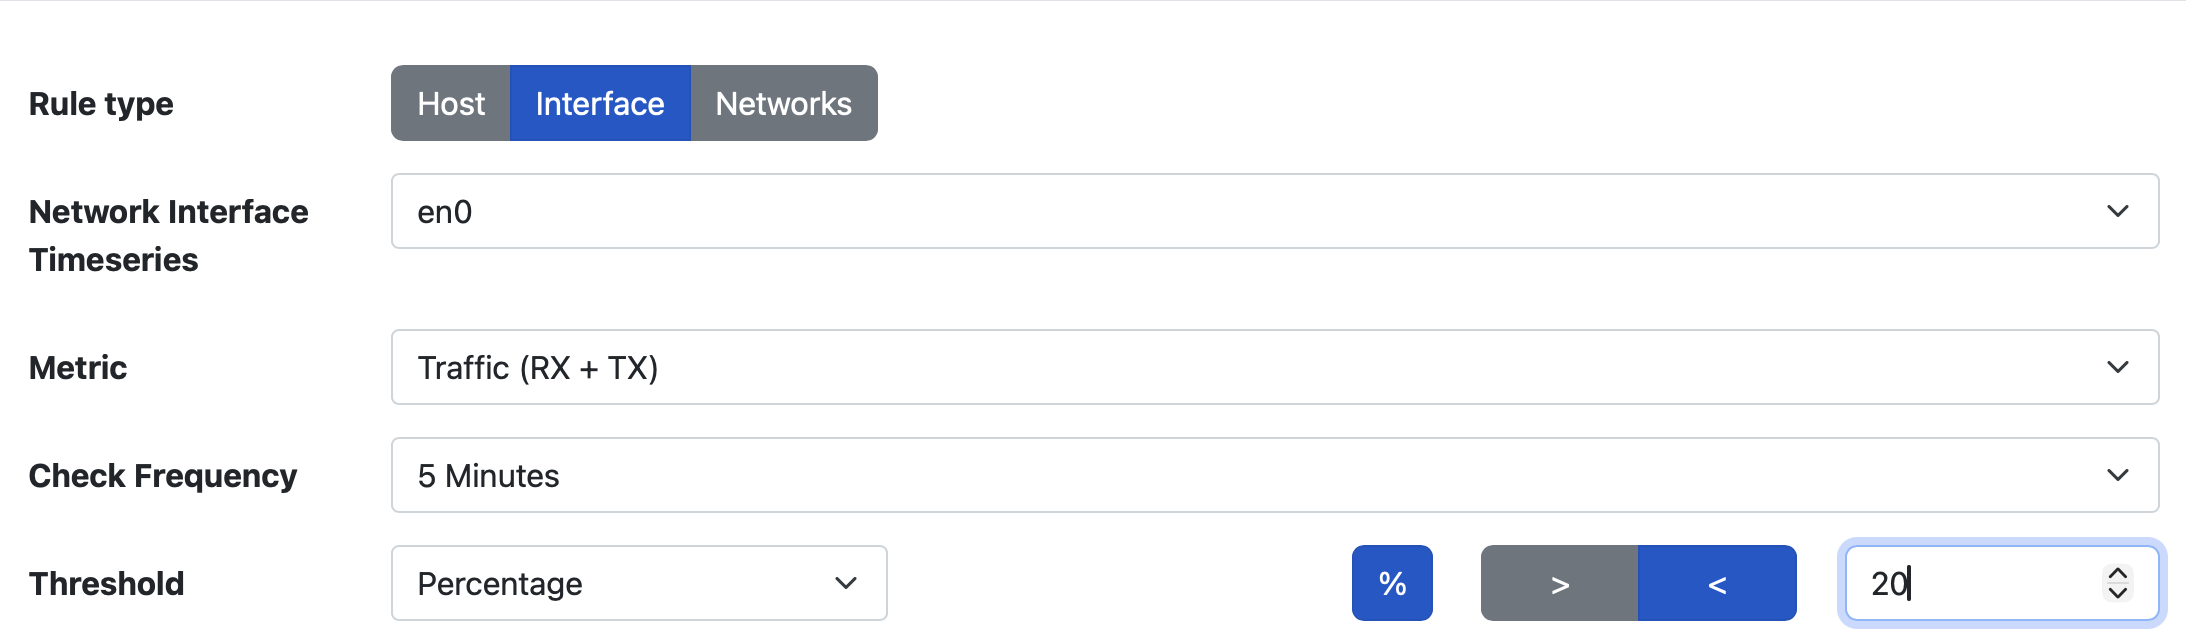
Don’t wait for users to complain. Configure ntopng alerts to notify you before capacity becomes critical. You can set alerts using Policies -> Traffic Rules as shown below in this picture.
7.1 Traffic Volume Rules
Create rules that trigger when thresholds are approached :
Interface-level rules:
Target: Interface ens160
Metric: Total traffic
Frequency: Daily
Threshold: Upperbound s0% of link capacity
Action: Email network team
Host-level rules:
Target: 192.168.1.50 (critical server)
Metric: Total traffic
Frequency: 5 minutes
Threshold: Upperbound 100 Mbps (alert if exceeded)
Action: Email and Slack notification
7.2 Growth Rate Alerts
Detect anomalous growth that might indicate planning needs:
Target: Interface ens160
Metric: Total traffic
Frequency: Weekly
Threshold: Percentage increase > 20% week-over-week
Action: Create ticket for review
7.3 Protocol-Specific Alerts
Monitor specific applications for unexpected growth:
Target: All local hosts
Metric: Zoom traffic
Frequency: Daily
Threshold: Upperbound 50% increase from baseline
Action: Investigate new collaboration patterns
Part 8: Optimizing Before Upgrading
Sometimes capacity issues aren’t about bandwidth—they’re about inefficient usage. Before spending budget on upgrades, use ntopng to identify optimization opportunities.
8.1 Detect Bandwidth Waste
- Unnecessary streaming: Non-business video during work hours
- Large file transfers: Personal cloud backups
- Inefficient protocols: Uncompressed data transfers
- Retransmissions: 3%+ indicates congestion or errors
8.2 Implement QoS Based on Data
ntopng’s protocol visibility tells you exactly what to prioritize:
| Priority Level | Traffic Types | QoS Action |
|---|---|---|
| Critical | VoIP, Video conferencing, ERP | Guaranteed minimum bandwidth |
| Normal | Web, Email, File sharing | Fair queuing |
| Low | Software updates, Backups, Streaming | Rate limit |
8.3 Review Peering and Transit Costs
For multi-homed networks, ntopng’s AS analytics help optimize provider costs :
- Identify which ASes drive traffic
- Evaluate peering opportunities
- Detect traffic that could be offloaded to CDNs
Part 9: Scaling ntopng for Large Networks
As your network grows, your monitoring must scale too. Here’s how to operate ntopng on large networks .
9.1 Recognizing When to Tune
- Red badges in the bottom-right corner indicate insufficient room for hosts or flows
- Packet drops mean ntopng can’t keep up with traffic rate
- High CPU usage on the monitoring server
9.2 Increasing Capacity
# Increase host/flow limits
-x 500000    # Max hosts (if seeing 50,000 active)
-X 1000000   # Max flows (if seeing 200,000 flows)
9.3 RSS and Multi-Core Scaling
For high-throughput environments, use RSS (Receive Side Scaling) to distribute packet processing across CPU cores :
- Verify NIC driver support (Intel drivers recommended)
- Configure multiple RX queues
- Use ntopng view interfaces to aggregate
Example configuration for 10 Gbps monitoring :
# In ntopng.conf
-i=eth0@0
-i=eth0@1
-i=eth0@2
-i=eth0@3
-i=eth0@4
-i=eth0@5
-i=view:all
This distributes traffic across 6 queues, allowing multiple CPU cores to handle the load. Note that for 10Gbit + we suggest you to preprocess traffic using nProbe or (better) nProbe Cento as explained below.
9.4 Distributed Deployment with nProbe
For very large networks, separate collection from analysis :
On collection points (branch routers, core switches):
nprobe -i eth0 -n none --zmq "tcp://*:5556"
On central ntopng server:
ntopng -i "tcp://<probe1-IP>:5556" -i "tcp://<probe2-IP>:5556"
This architecture scales to hundreds of monitoring points while maintaining centralized analysis. As possible option you can send all flows towards the same ntopng port. Example
On collection points (branch routers, core switches):
nprobe -i eth0 -n none --zmq "tcp://<ntopng-IP>:5556" --zmq-probe-mode
On central ntopng server:
ntopng -i "tcp://<ntopng-IP>:5556c"
Make sure not to send too many flows towards the same collection interface otherwise you will put too much pressure on ntopng. Better to define multiple collection interfaces and aggregate them with a view interface.
Part 10: Building Your Capacity Planning Process
10.1 Weekly Review (30 minutes)
- Check top talkers for unexpected changes
- Review interface utilization trends
- Note any alerts triggered
10.2 Monthly Analysis (2 hours)
- Update baseline spreadsheet with new data
- Calculate monthly growth rates
- Review protocol distribution changes
- Identify top 5 growth drivers
10.3 Quarterly Planning (4 hours)
- Generate trend forecasts for next 12-18 months
- Review upcoming projects (new offices, applications)
- Update capacity thresholds and alerts
- Plan budget for upcoming upgrades
10.4 Annual Strategy (Full day)
- Comprehensive network review
- Long-term architecture planning
- Technology refresh cycles
- Staff training and tooling updates
Conclusion: From Reactive to Proactive
Capacity planning with ntopng transforms your IT team from firefighters to strategic planners. Instead of scrambling when links saturate, you’ll confidently present data-driven recommendations to leadership.
The ntop toolkit gives you:
- Visibility into what’s really on your network
- History to understand trends
- Granularity to plan by application, not just bytes
- Scalability that grows with your network
- Actionable alerts that warn before problems occur
Remember: perfect capacity planning isn’t about eliminating all risk—it’s about making informed decisions with the best available data. ntopng provides that data; your expertise turns it into strategy.
Start your capacity planning journey today:
- Install ntopng if you haven’t already
- Configure historical data storage
- Set up your baseline spreadsheet
- Create your first growth forecast
- Share findings with your team
The network of tomorrow is being built today—make sure you have the visibility to build it right.
Enjoy !