Modern observability platforms are expected to answer questions that traditional monitoring systems were never designed to handle:
- What exactly happened during that 20-second congestion spike?
- Which application caused the transient burst?
- Why did users report latency even though 5-minute averages look normal?
Conventional network timeseries are excellent for long-term capacity planning and trend analysis, but they often smooth away the short-lived events that matter most during troubleshooting and incident analysis.
With the introduction of High-Resolution Timeseries, ntopng closes this visibility gap by enabling historical traffic analysis at 15 second, or even lower, granularity, directly embedded into flow records.
Why High-Resolution Timeseries Matter
Traditional flow records aggregate counters over the entire lifetime of a connection. While this approach is compact and efficient, it also hides traffic dynamics occurring inside the flow itself.
For example, a 10 minutes flow, carrying GBs of data, may appear perfectly stable. In reality, the traffic could have consisted of several bursts separated by idle periods. This becomes a problem for observability because modern operational workflows increasingly rely on micro-congestion analysis, transient anomaly identification, application responsiveness correlation.
High-resolution timeseries address this limitation by preserving throughput evolution, within each flow, at the second level.
High-Resolution Data Pipeline
In order to implement High-Resolution timeseries, ntopng required a source of traffic counters able to export 15 (or less) second buckets for each flow record, rather than only final cumulative counters. nProbe, which is tightly integrated with ntopng, has been extended for this, minimizing architectural complexity.
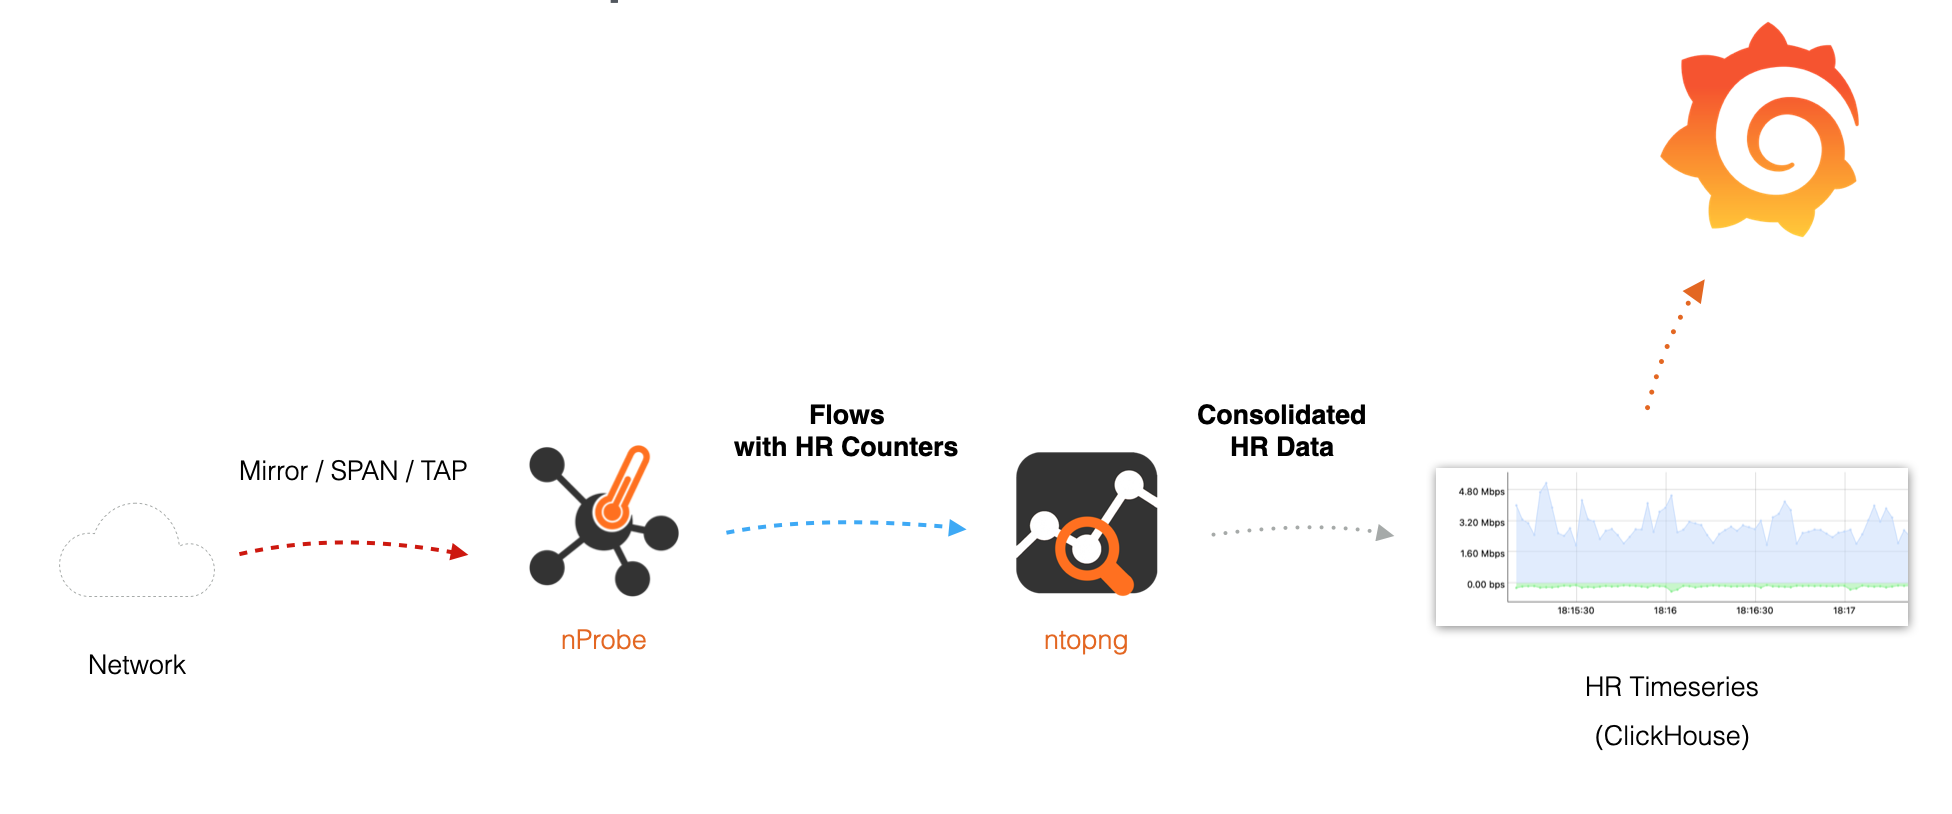
The processing pipeline is:
- Traffic is captured by nProbe.
- nProbe periodically accumulates byte counters into 15-second slots (soon configurable).
- HR data is exported to ntopng according to the Information Elements in the template (e.g. HR_SRC_TO_DST_BYTES, HR_DST_TO_SRC_BYTES)..
- ntopng automatically detects HR fields.
- Consolidated flow records are written into ClickHouse.
- ntopng, or Grafana, can query high-resolution historical flows and build timeseries.
ClickHouse is particularly well suited for this workload because it is optimized for analytical timeseries processing and high-throughput inserts, and being already used by ntopng for storing historical flow records, extending it for HR data has been a natural evolution.
Embedding Timeseries In Raw Flows
Embedding HR data directly into flow records rather than storing them in a separate timeseries database provides several advantages:
- Context Preservation: traffic evolution remains tied to flow metadata:
- Simplified Correlation: no external joins are required between flows and metrics.
- Better Query Semantics: analysts can query “show flows with throughput spikes” using a single dataset.
This model resembles modern observability systems where rich events encapsulate both metadata and time-evolving measurements.
Configuration
HR timeseries require:
- ntopng Enterprise with Historical Flows support (Enterprise M and superior).
- ClickHouse enabled as flow backend (-F clickhouse).
- nProbe configured to export High Resolution Information Elements.
nProbe configuration example to export HR byte counters:
nprobe -i enp1s0 \
-n none \
--zmq "tcp://*:5556" \
-T "@NTOPNG@ %HR_DST_TO_SRC_BYTES %HR_SRC_TO_DST_BYTES"
HR_SRC_TO_DST_BYTES and HR_DST_TO_SRC_BYTES fields in the example contain arrays of byte counters sampled every 15 seconds by default. No additional nProbe options are required.
Note: in order to produce High-Resolution counters, nProbe should be configured to capture traffic from a mirror/SPAN/TAP, as it requires packet analysis. When collecting Netflow, it is not possible to extract High-Resolution data as counters are already aggregated by the exporter.
On the ntopng side, no special HR-specific configuration is necessary. ntopng automatically detects HR fields, maps them to ClickHouse columns, stores the consolidated flow records. The only requirement is enabling ClickHouse as the flow dump backend.
ntopng configuration example:
ntopng -i "tcp://127.0.0.1:5556" -F "clickhouse"Data Visualization
Once data is available in ClickHouse, this is immediately available for drawing high-resolution charts.
Charts are available at different places in ntopng:
- The Interface Details page includes an historical chart aggregating traffic across every flow seen on that interface, showing the total throughput per direction with 15 seconds resolution.
- The Host Details page shows the host per-direction throughput at high granularity, aggregating all flows where the host appears as client or server.
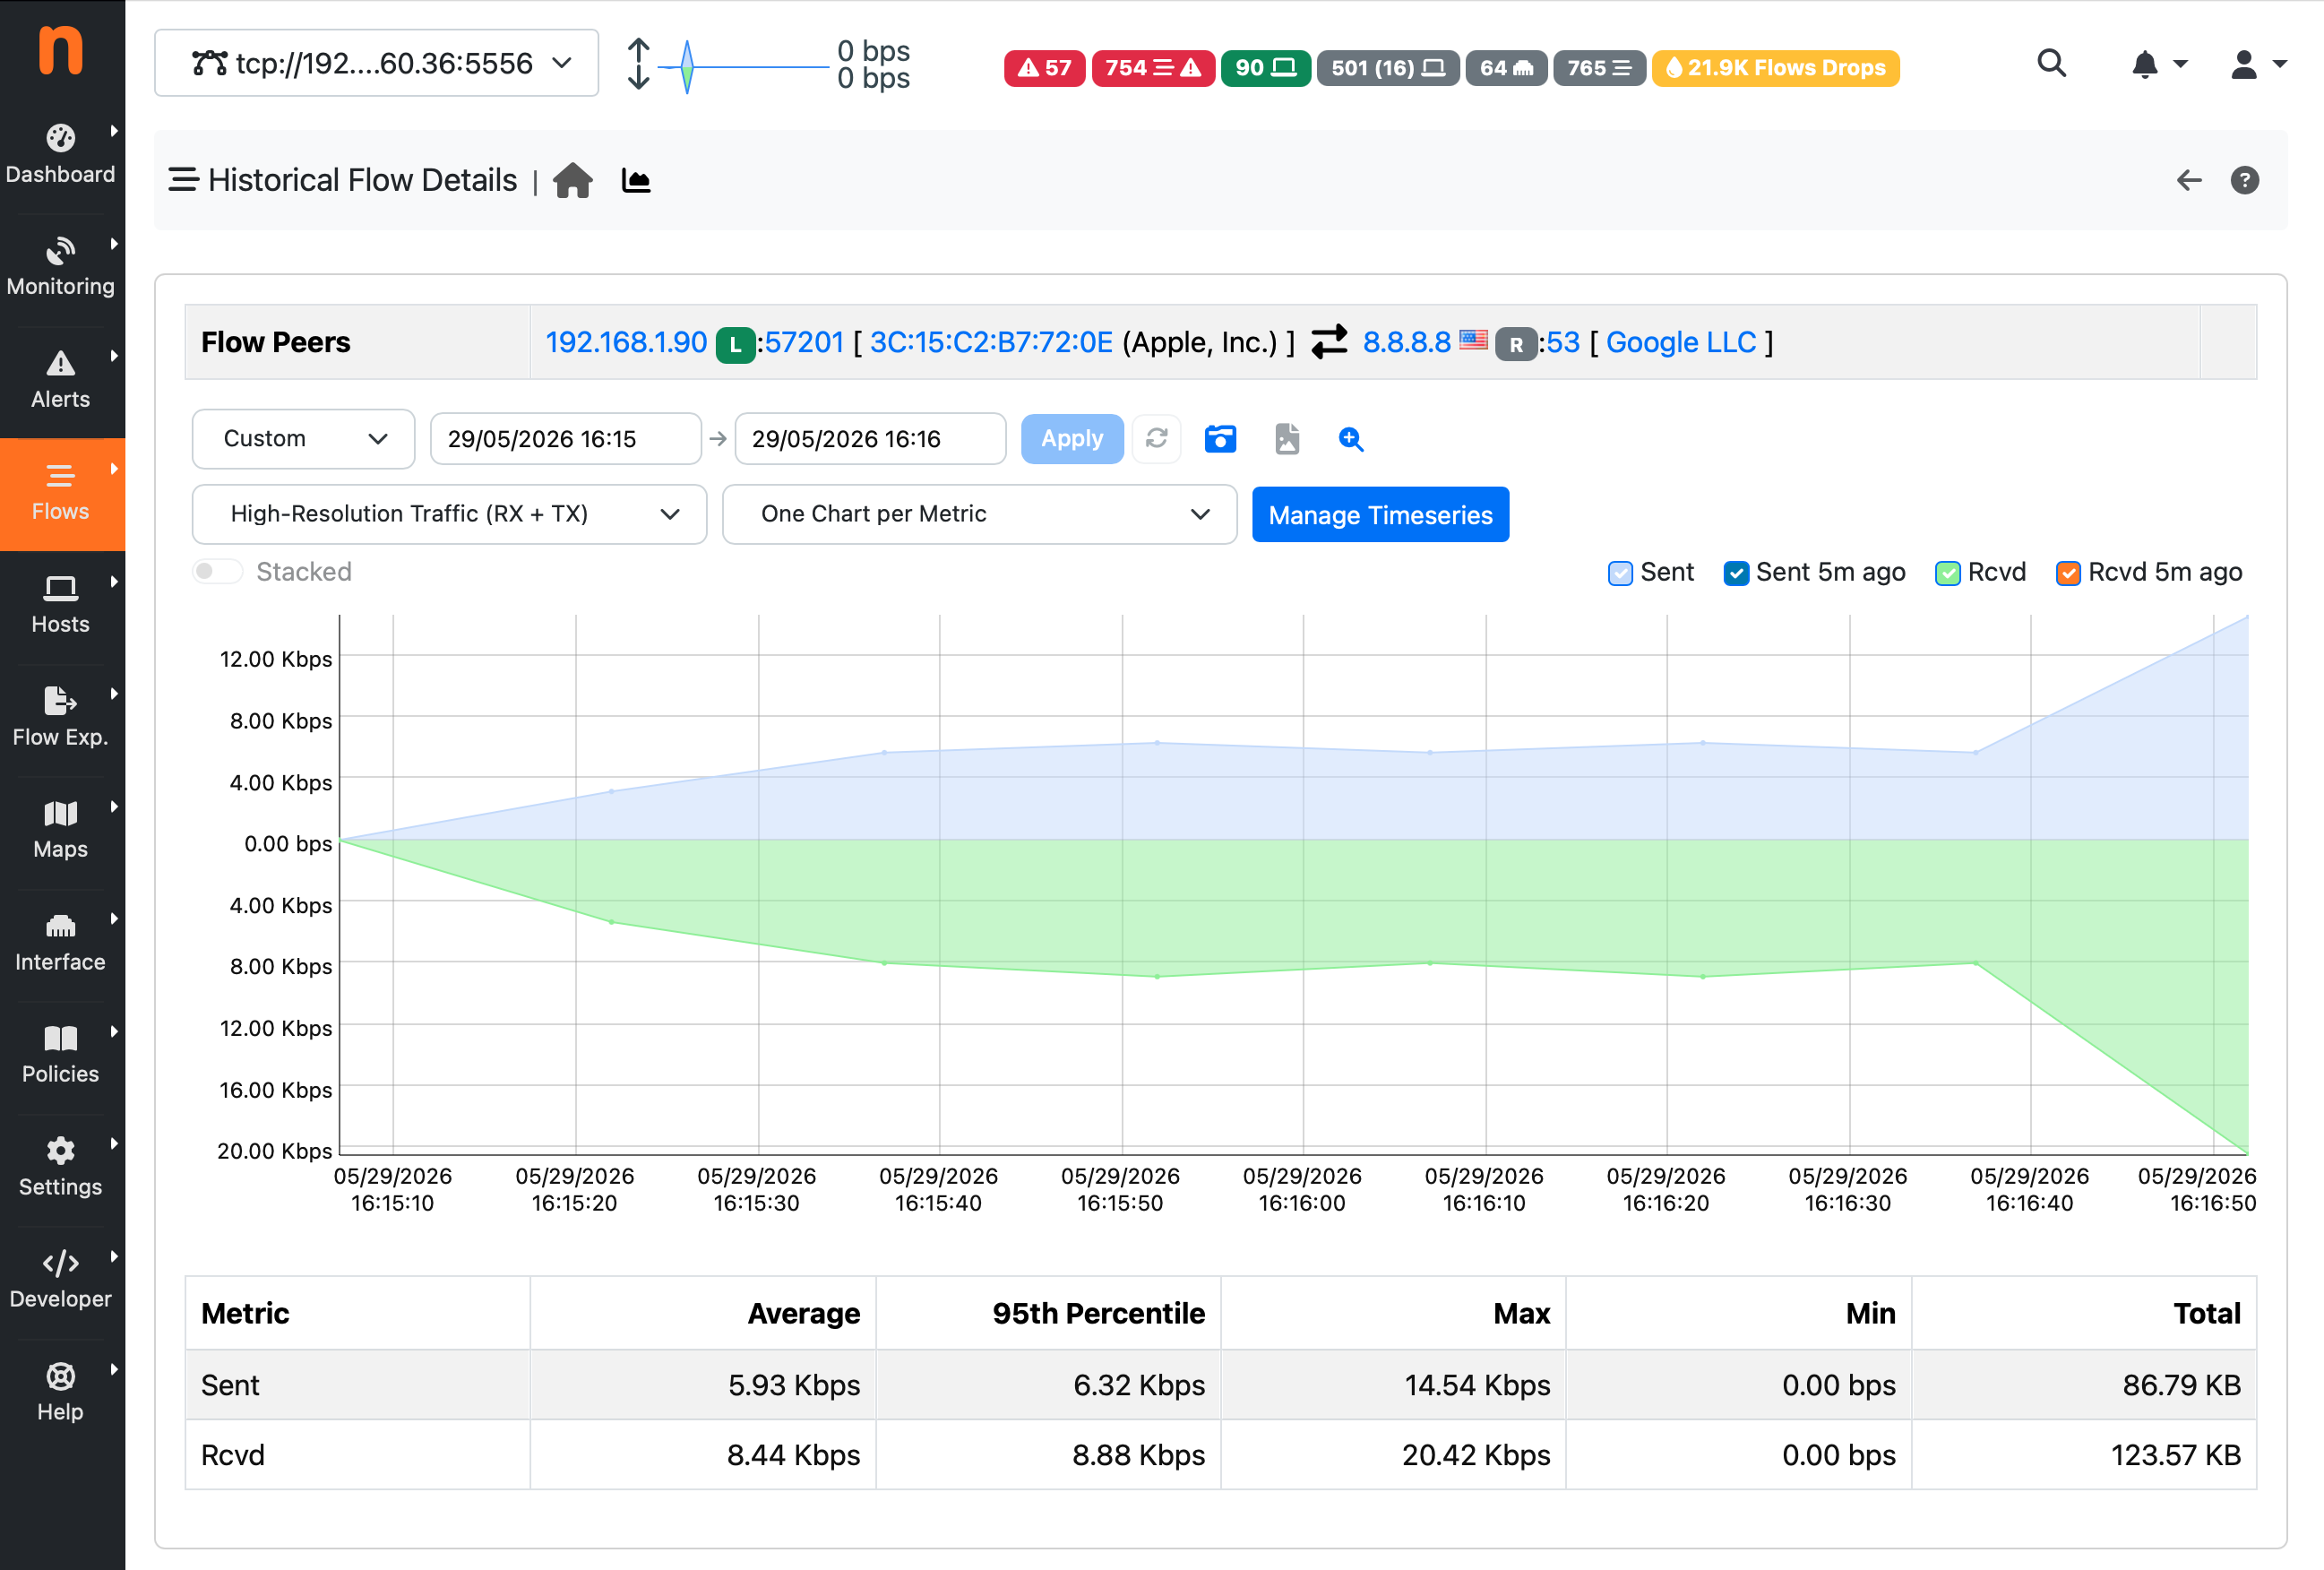
- Drilling down to a specific historical flow through the Historical Flows page and jumping to a single Flow Details page, a dedicated per-flow high resolution chart is available. This chart plots the exact bidirectional throughput profile of that single connection at 15-second resolution, annotated with the flow 5-tuple. This is particularly powerful for observability: it makes it possible to answer questions such as “was the traffic bursty or flat?”, “did the throughput drop midway through the connection?”, or “which direction dominated?”, all at a granularity that a simple/standard flow record cannot provide.
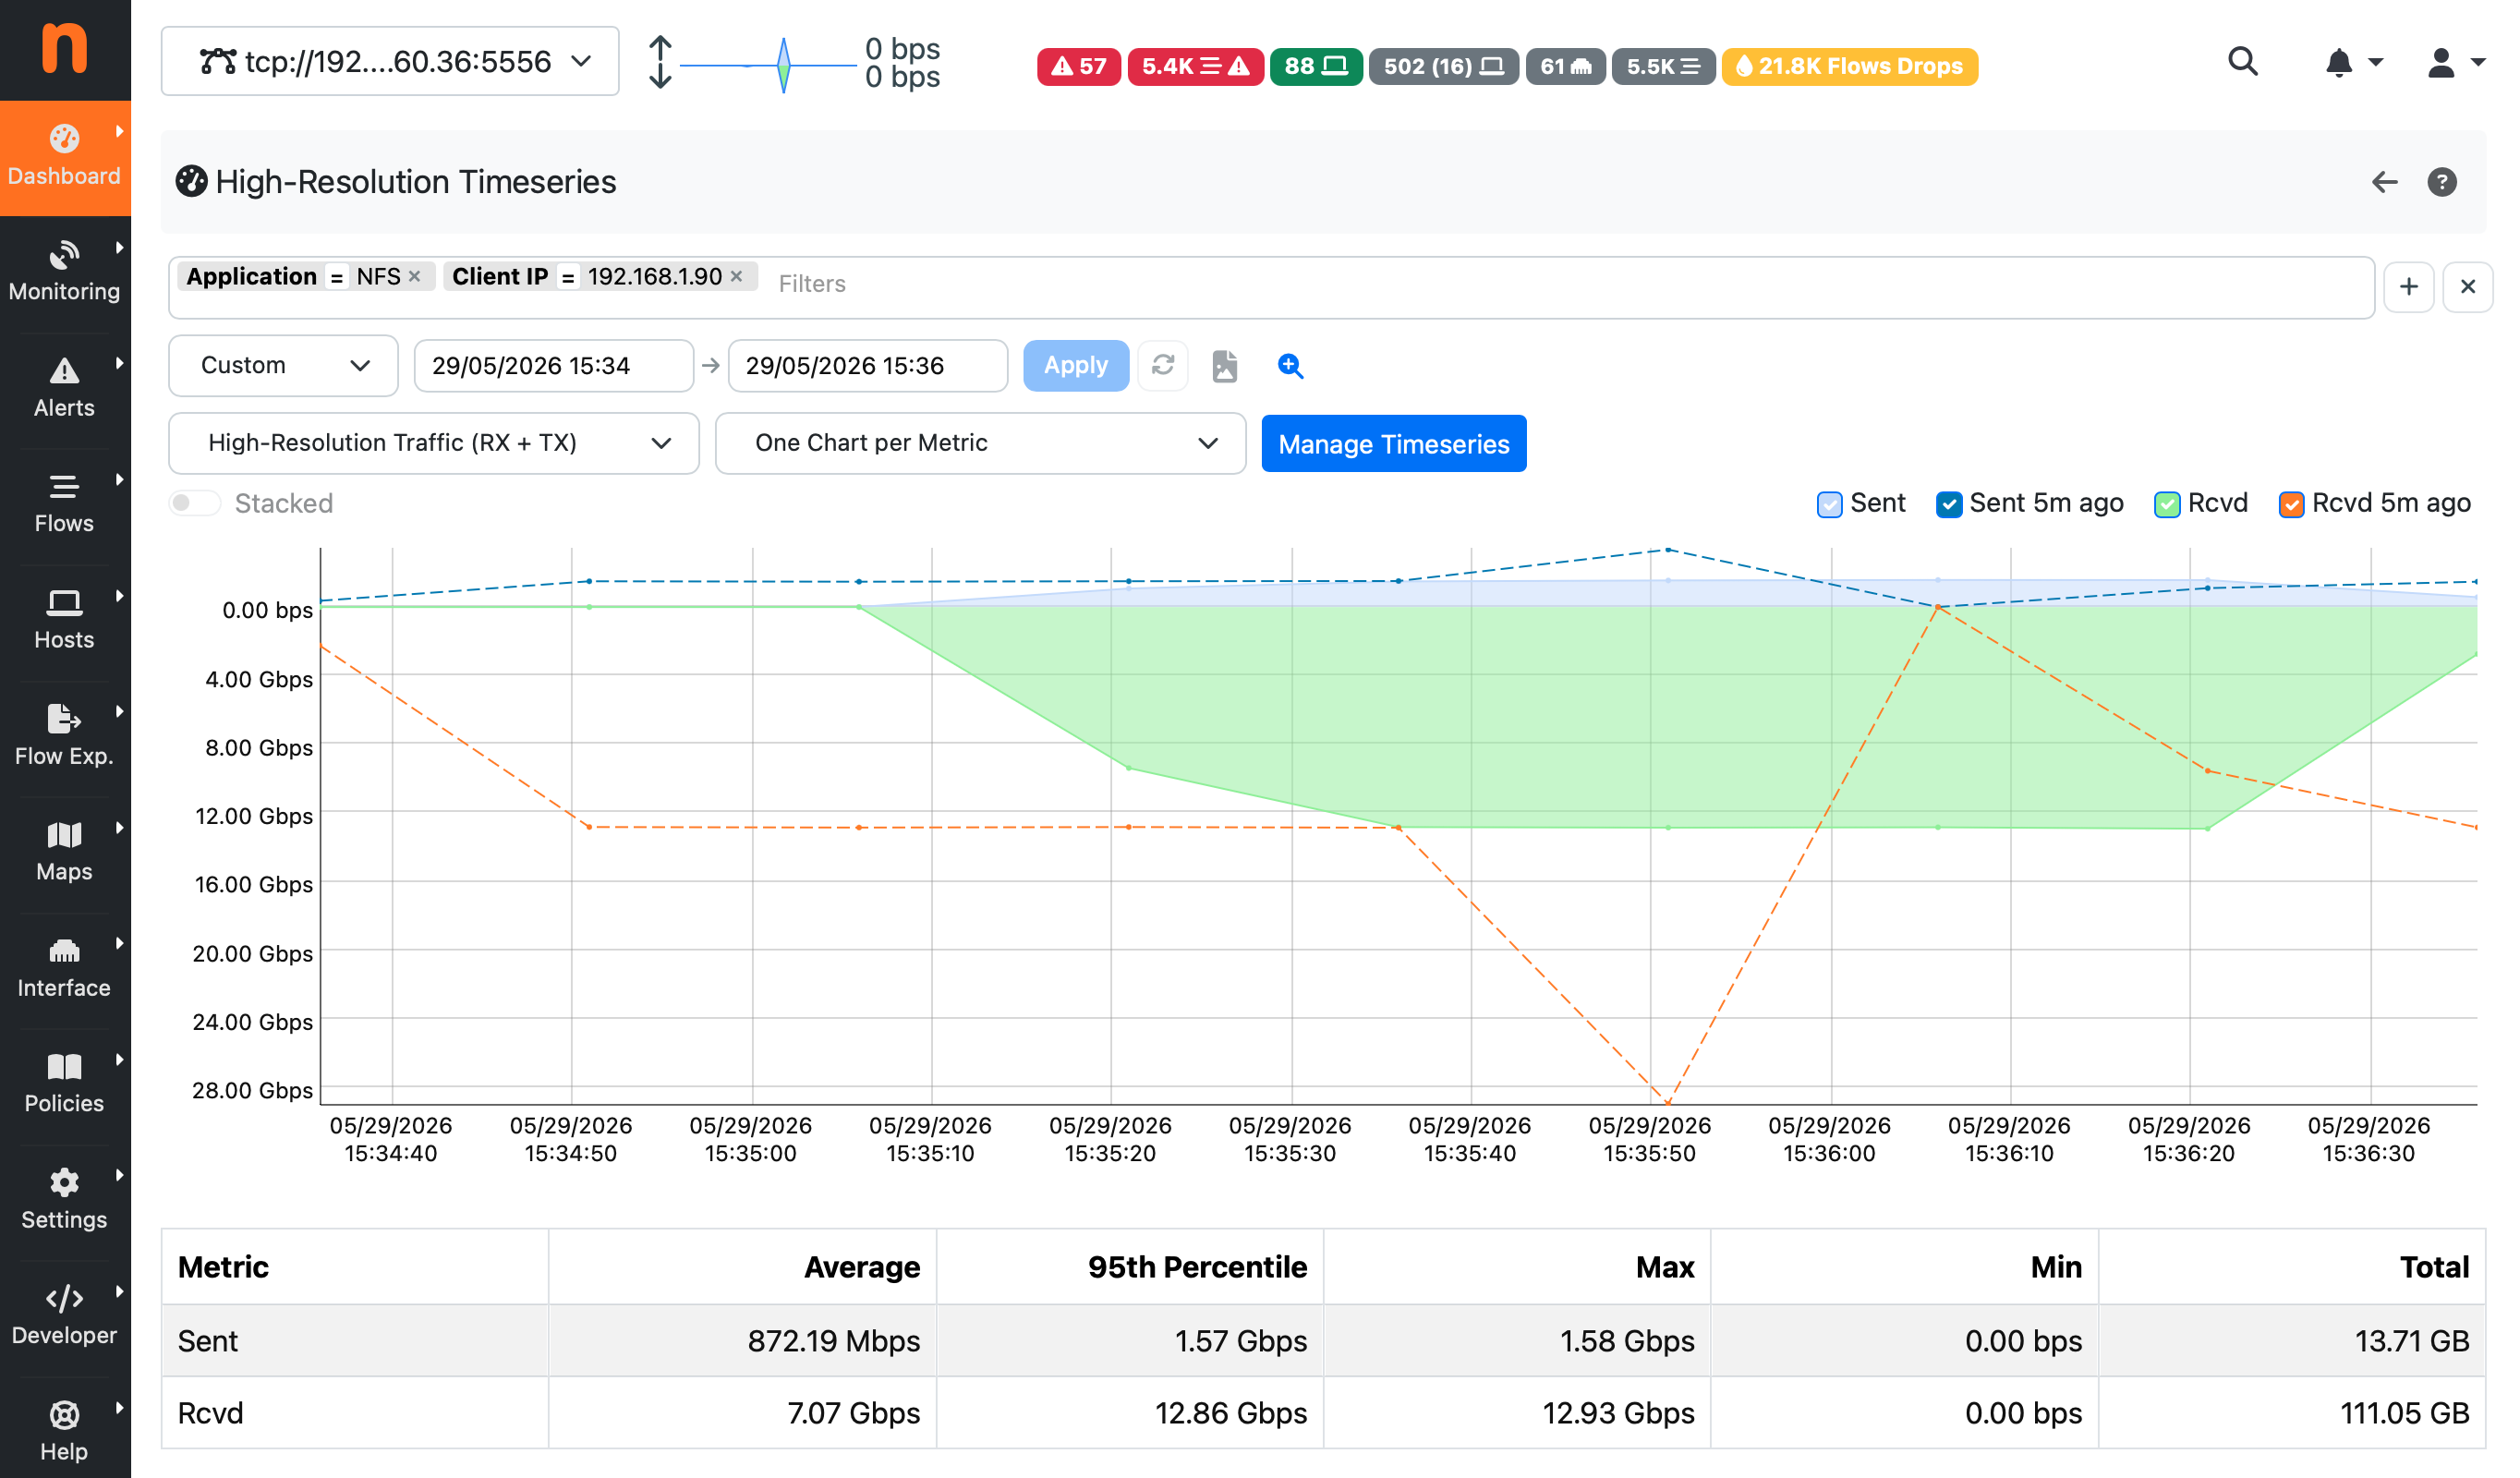
Furthermore, a dedicated High-Resolution Timeseries page is available, this brings together filtering and aggregation in a single interactive view. In fact this page includes a filter bar that lets you narrow the dataset by any flow field supported by the historical flow search (e.g. source IP, destination IP, source port, destination port, L4 protocol, L7 application protocol, VLAN,
ASN, etc.), a high-resolution chart aggregates the high-resolution counters of all flows matching the active filters.
Grafana Integration
Grafana can also be used to draw High Resolution data by means of the ClickHouse plugin. A sample Grafana dashboard is available on GitHub at this URL as starting point.
To import the dashboard into Grafana:
- In Grafana, go to Dashboards → Import.
- Upload hr-flow-throughput-dashboard.json or paste its contents.
- When prompted, select the ClickHouse datasource that points to the ntopng database.
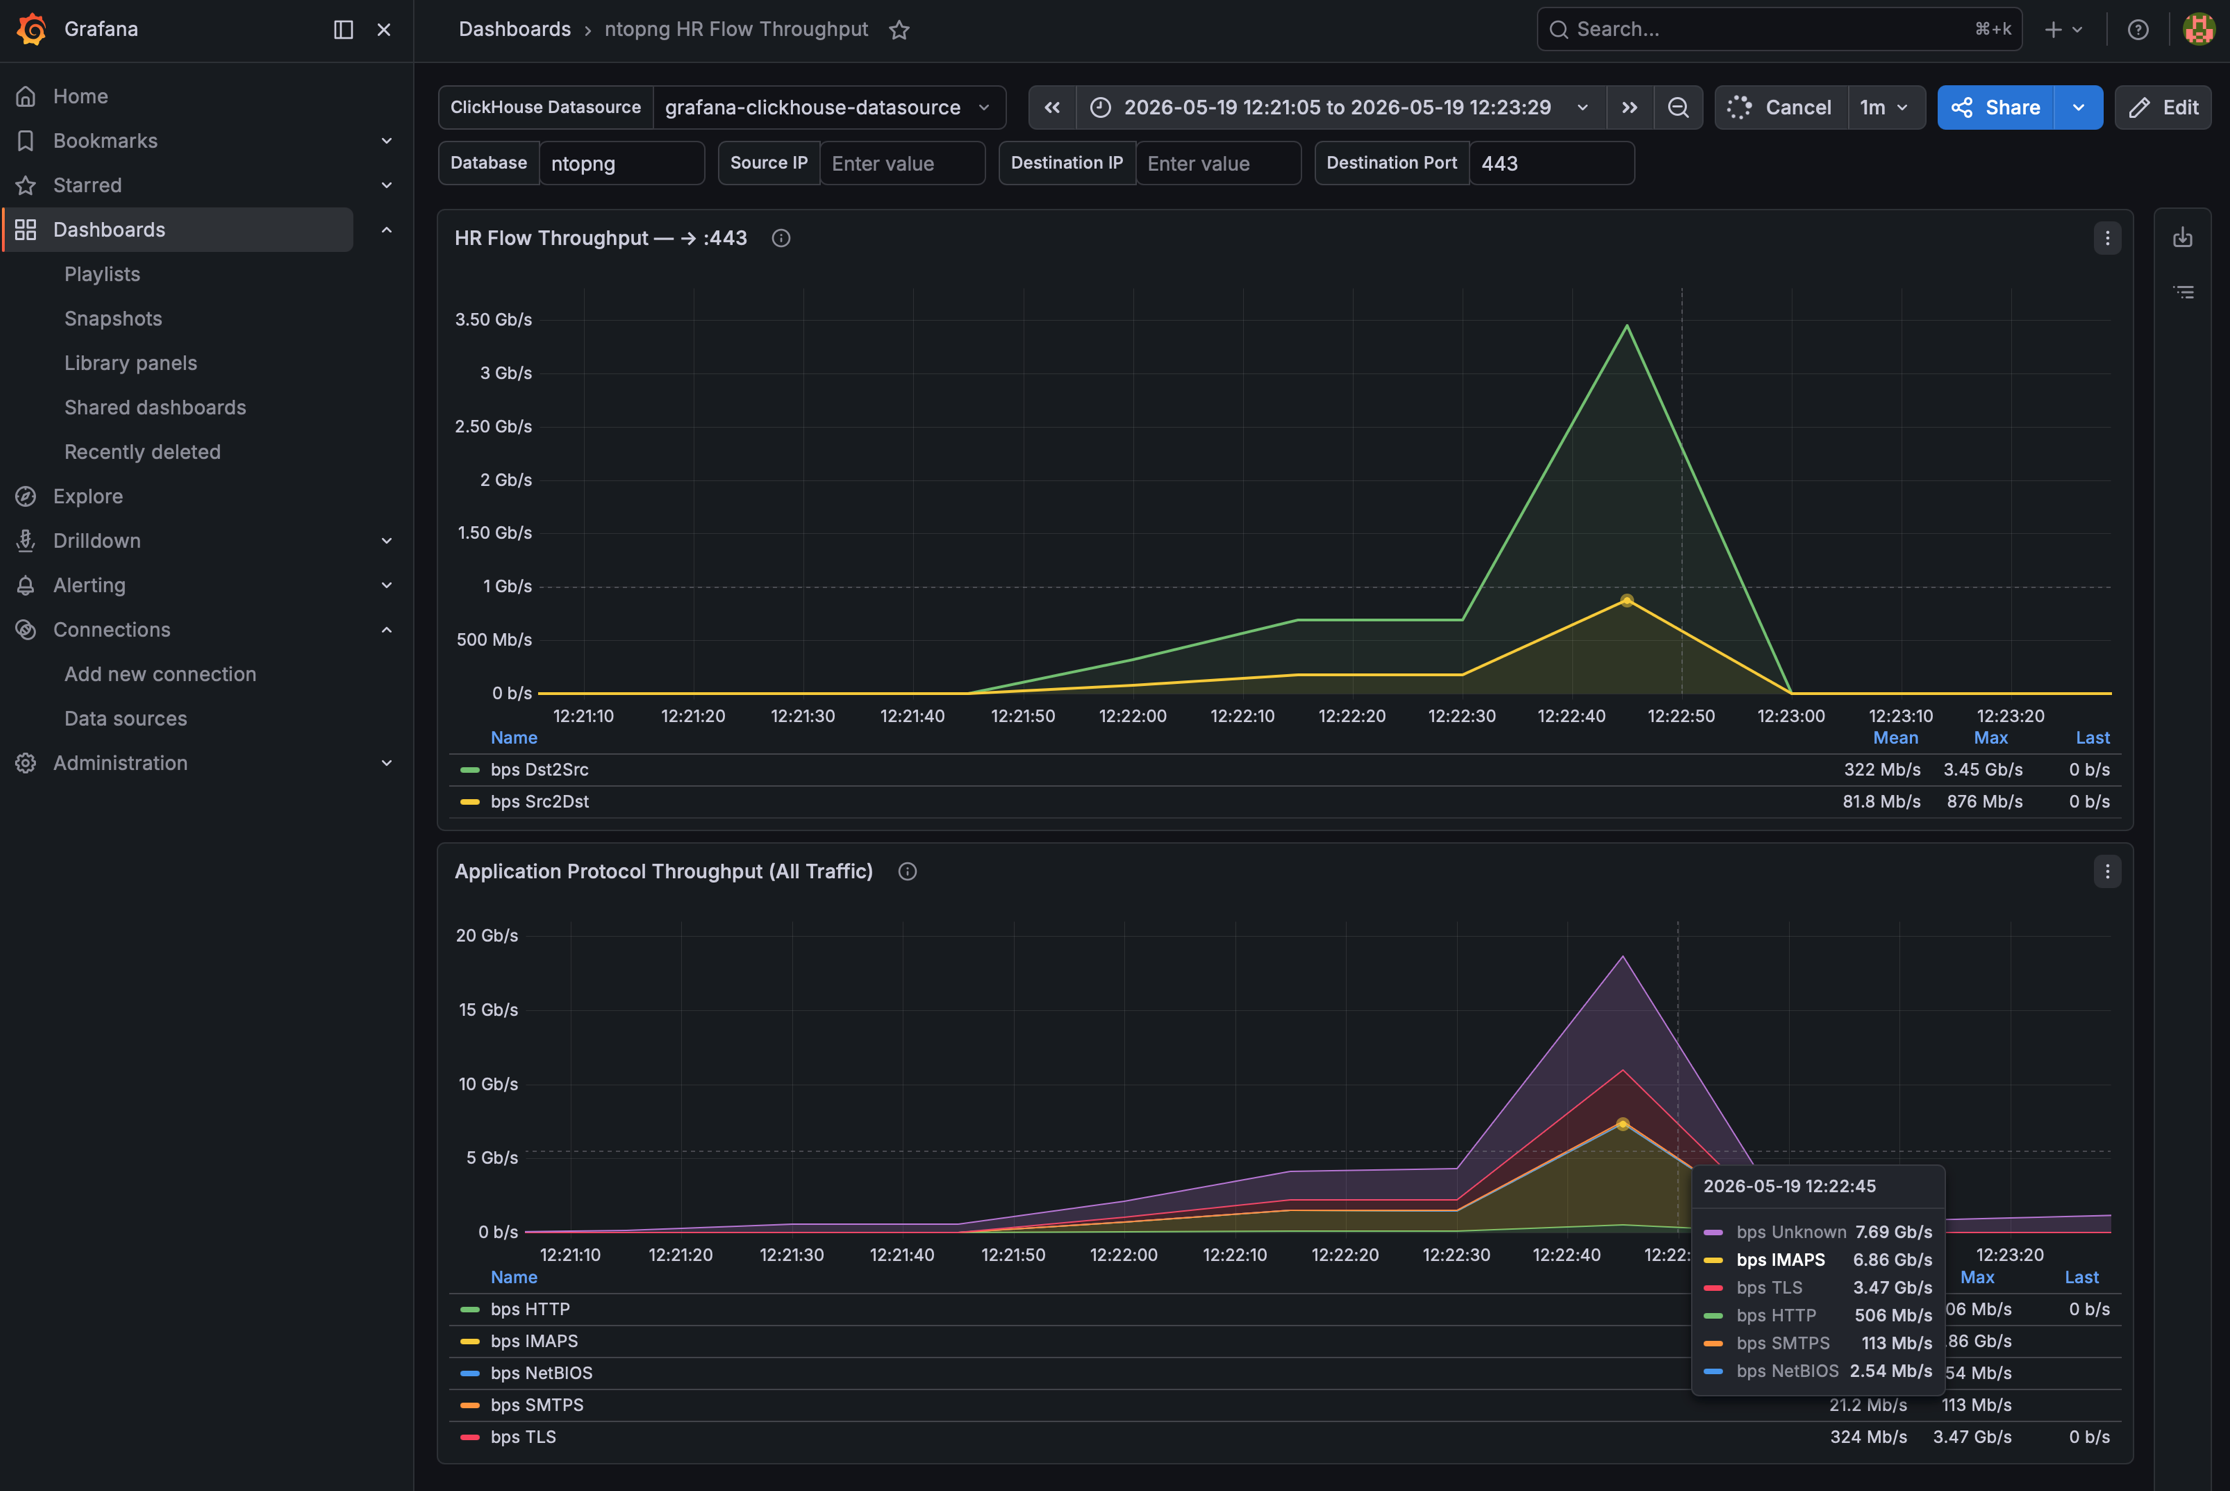
This sample dashboard provides two panels:
- Service Flow Throughput — bidirectional throughput for a specific flow, filtered by source IP, destination IP, and destination port.
- Application Protocol Throughput (All Traffic) — aggregated throughput broken down by application protocol.
with the aim of demonstrating how, High-Resolution data, can be grouped by different criteria to build any higher level metric.
Higher telemetry fidelity naturally introduces tradeoffs. HR timeseries increase storage usage and ingestion volume as additional metadata is included in exported flows. However, this is in most cases negligible as most of the space is used for Layer 7 metadata and other metrics, HR counters represent a small portion. For large deployments, administrators should carefully evaluate retention policies and ClickHouse sizing, which applies to storing raw flows, regardless of HR counters being enabled. Observability in most cases benefits outweigh the additional cost, especially for environments where short-lived traffic anomalies matter.
Enjoy!