
Network devices export flow data in many flavors. Some vendors stick closely to the NetFlow/IPFIX standard, so collecting their flows is essentially plug-and-play. Others extend the standard with proprietary Information Elements (IEs) to expose vendor-specific details (e.g. application names, user identities, security verdicts, etc) which requires a bit of extra configuration on the collector side.
In this post we revisit and update an older article on collecting proprietary flows with nProbe, using two widely deployed firewall vendors as concrete examples: Fortinet FortiGate and Palo Alto Networks.
Two Different Approaches, One Collector
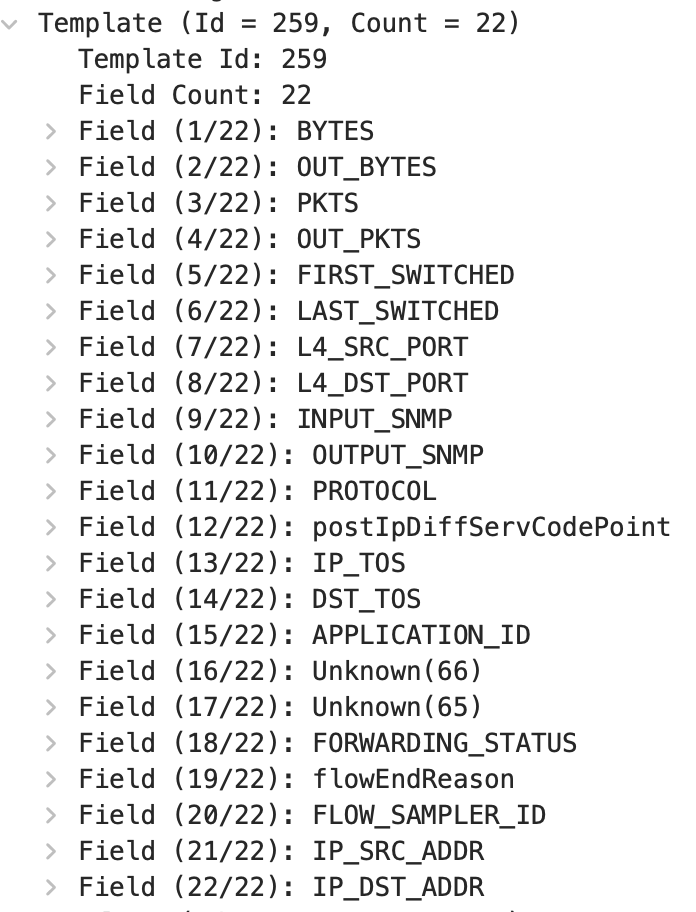
FortiGate exports flow data using standard NetFlow/IPFIX Information Elements. Because it doesn’t rely on proprietary fields for the core telemetry FortiGate typically reports, nProbe collects and decodes those flows out of the box with no special configuration is required on the nProbe side. Point nProbe at the FortiGate NetFlow/IPFIX export and flows start showing up correctly. This is confirmed capturing a Fortigate template that contains all known fields (note that information elements 65 IPV6_SRC_MASK and 66 IPV6_DST_MASK are standard and not mapped inside Wireshark).
Palo Alto Networks, on the other hand, exports a number of fields as proprietary Information Elements identified by Palo Alto’s own Private Enterprise Number (PEN) rather than as standard IEs.
nProbe and Proprietary Information Elements
nProbe Enterprise allows users to define custom Information Elements at runtime via the --load-custom-fields option, which loads a configuration file mapping vendor-specific field IDs to names, types, and (optionally) a standard field they correspond to. Each entry specifies: You can find configuration files for major vendors in the nProbe GitHub repository.
- Field name: the label used in the export template and downstream outputs (MySQL, JSON, etc.).
- Standard alias: an optional mapping to an equivalent standard field, or NONE if there isn’t one.
- PEN: the vendor’s Private Enterprise Number (0 for standard fields).
- Field ID: the numeric identifier within the flow template.
- Length: the field size in bytes.
- Format: how the field should be represented on export.
Below you can find an example for PaloAlto devices.
#APP_ID			NONE	25461	56701	4	dump_as_uint
APP_NAME		NONE	25461	56701	32	dump_as_ascii
USER_NAME		NONE	25461	56702	64	dump_as_ascii
POST_NAT_SRC_IPV6_ADDR	NONE	25461	281	16	dump_as_ipv6_address
POST_NAT_DST_IPV6_ADDR	NONE	25461	282	16	dump_as_ipv6_address
ENTREPRISE_NUMBER	NONE	25461	346	4	dump_as_uint
Once the custom fields are defined, they can be referenced like any native IE in the nProbe export template (-T option), so Palo Alto’s proprietary fields sit alongside standard fields such as %IPV4_SRC_ADDR, %L4_SRC_PORT, or %APPLICATION_ID in the same flow record.
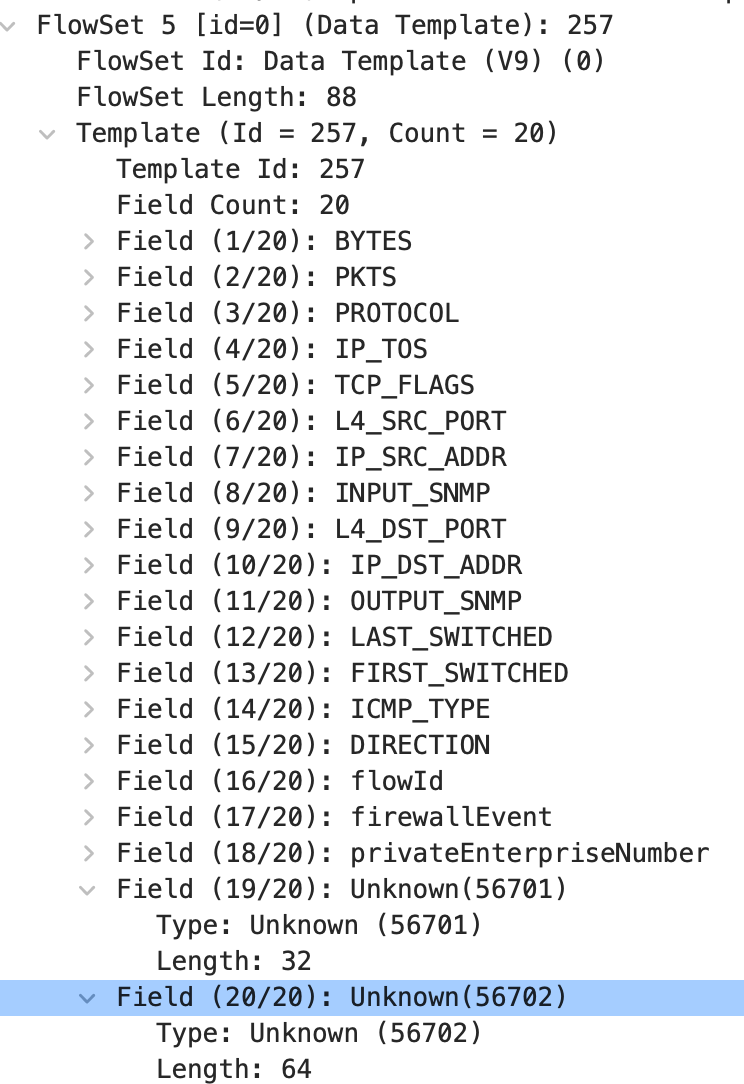
This is an example of a Palo Alto flow template as shown by Wireshark. As you can see at the bottom of the template there are two proprietary fields that have been mapped on the above configuration to APP_NAME and USER_NAME.
From nProbe to ntopng and ClickHouse
Regardless of whether the flow comes from a device that speaks pure standard NetFlow/IPFIX (like FortiGate) or one that needs custom field definitions (like Palo Alto), the result on the collection side is the same: nProbe normalizes the flow and forwards it to ntopng. All you need to do is to pass to nProbe the format of these proprietary fields by downloading the corresponding file (in the case of Palo Alto you can use this file) and passing it to nProbe as follows:
nprobe --load-custom-fields paloalto_custom_fields.txt -3 2055 --zmq tcp://127.0.0.1:1234 -T "@NTOPNG@ %APP_NAME %USER_NAME"The above command tells nProbe to export the application and user name of a given flow to ntopng via ZMQ, this in addition to the standard ntopng template. In ntopng, these flows (including the proprietary Information Elements) are displayed correctly in the GUI, with vendor-specific fields shown alongside standard flow attributes. The same data is also written to the ClickHouse database, so proprietary fields are available for historical queries, dashboards, and long-term analysis just like any other flow attribute.
You do not need to do anything special at the ntopng side as nProbe will send via ZMQ the information about these mapping fields to ntopng that hence will be aware of their name and format. This means that you can start ntopng as usual, and eventually dumping flows in ClickHouse.
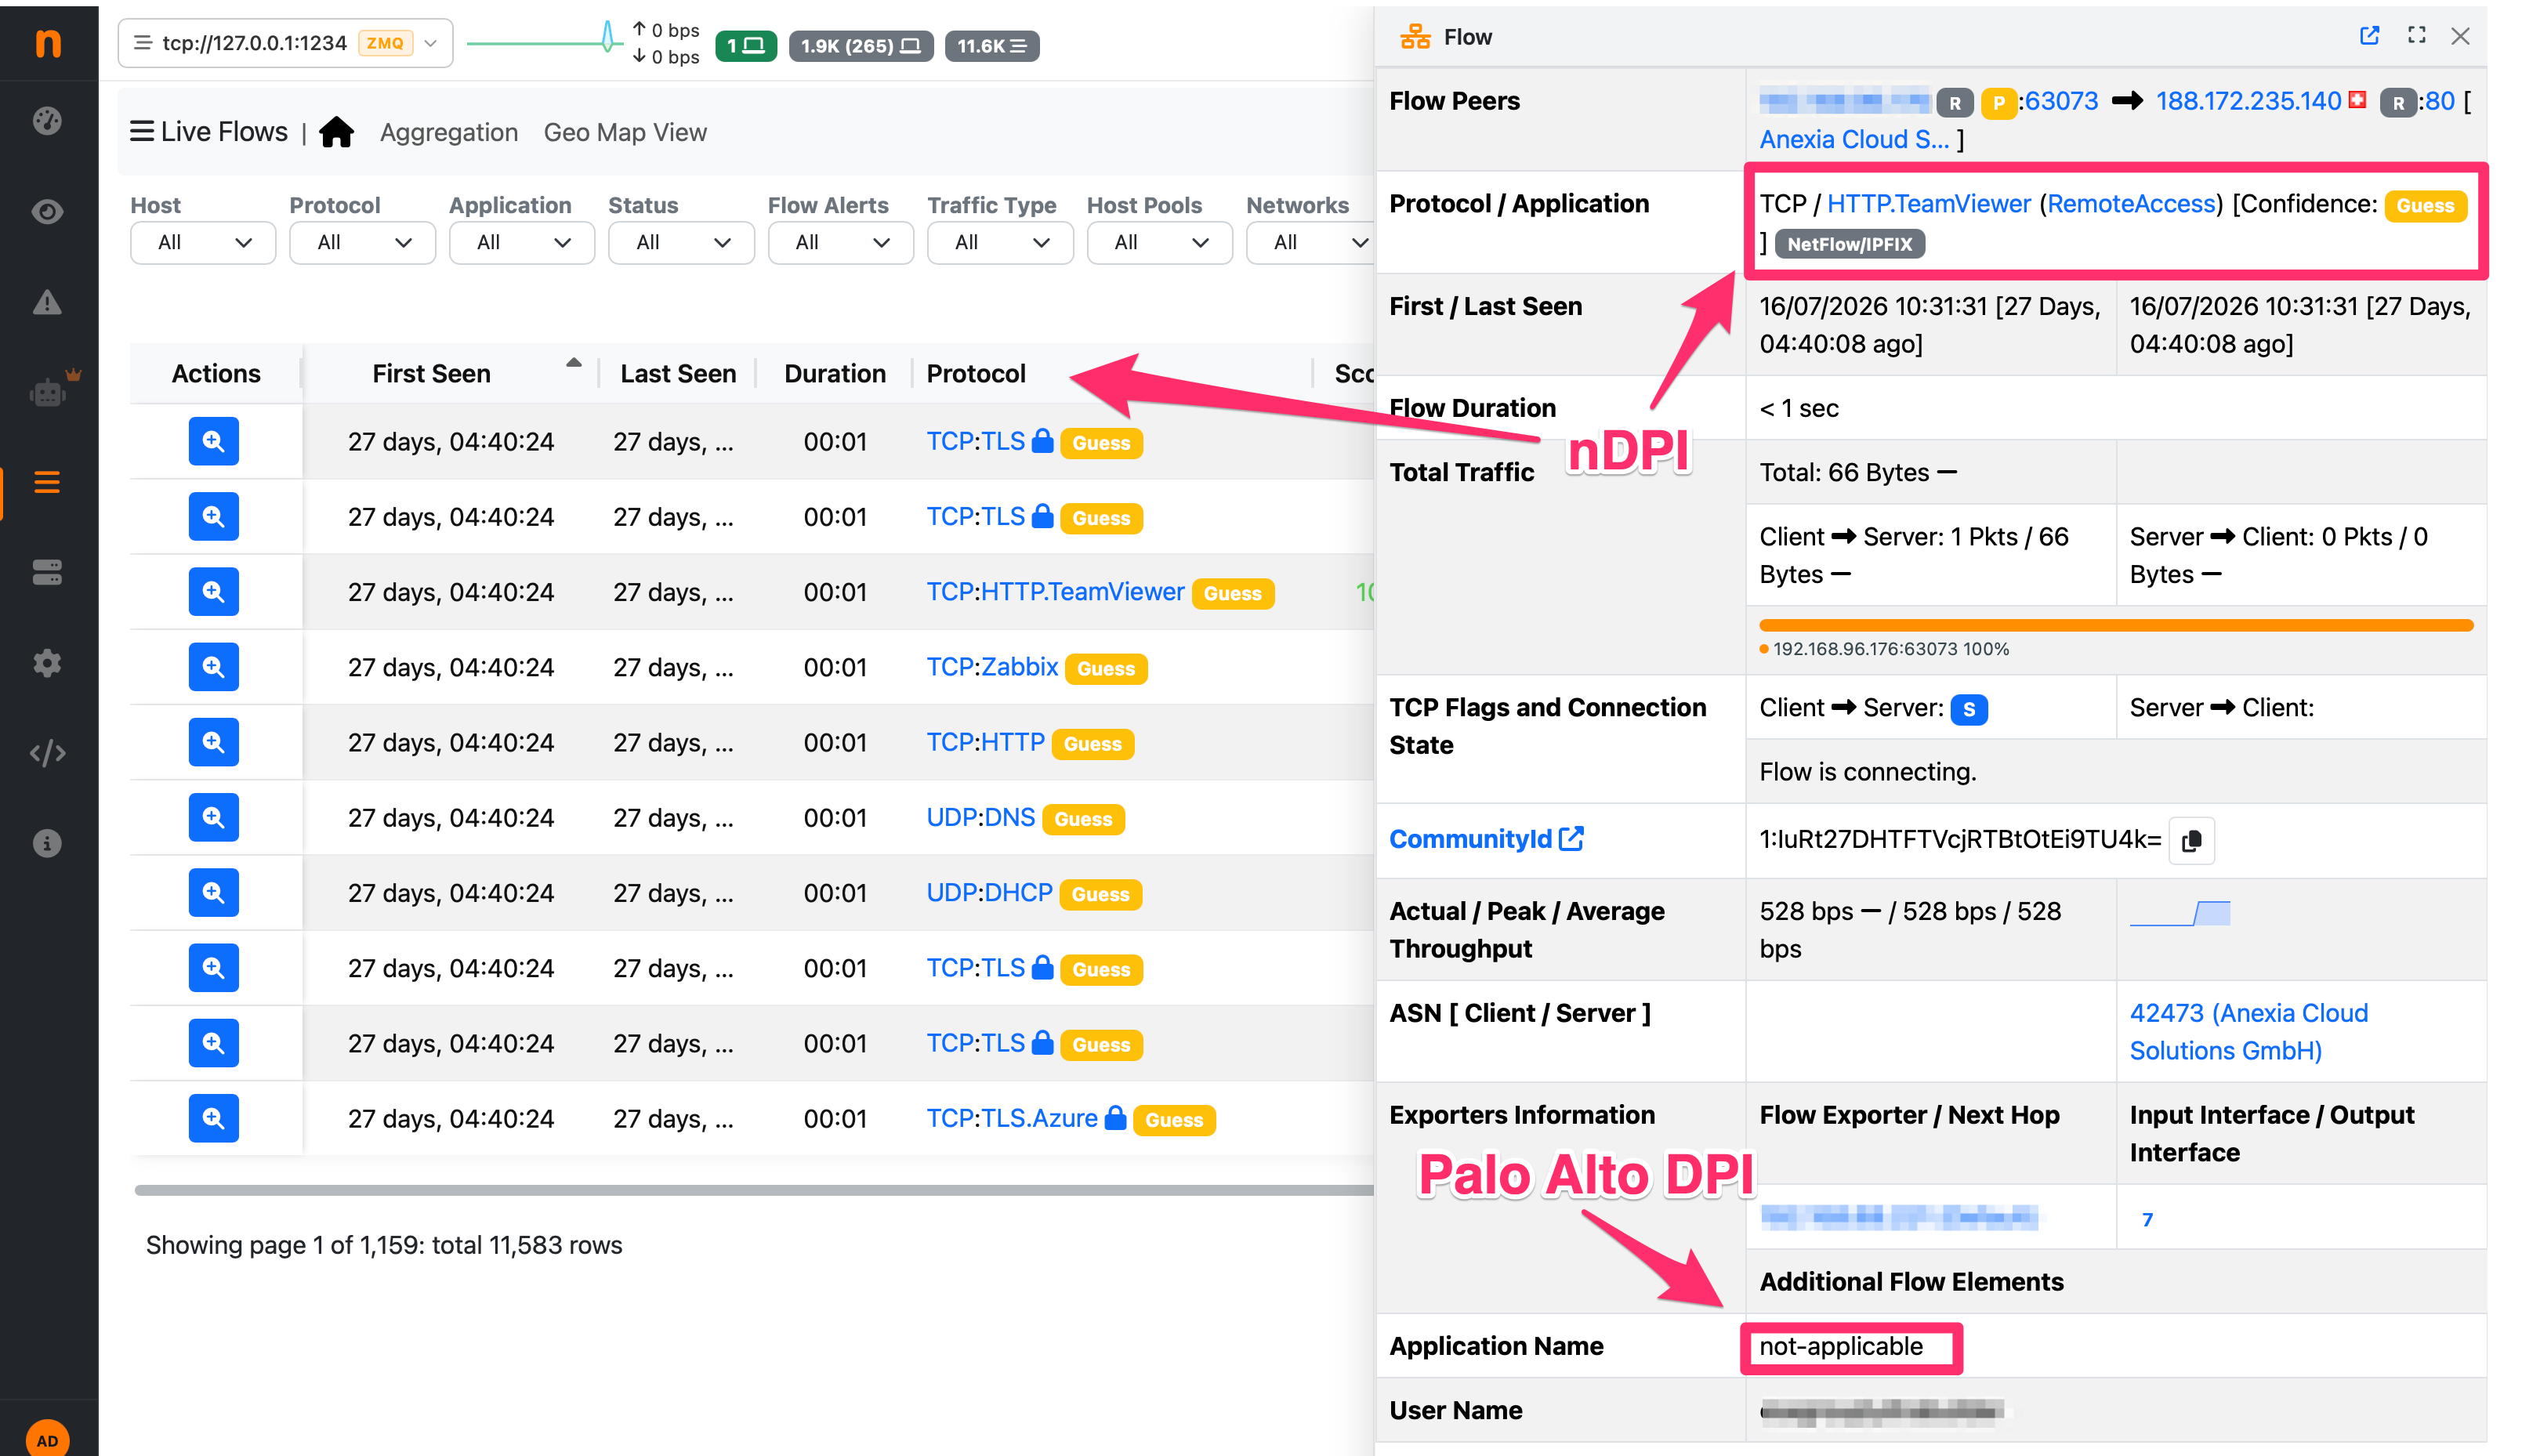
ntopng -i tcp://127.0.0.1:1234 -F clickhouseInside ntopng live flows are reported as shown below: as you can see nDPI seems to wokr better that the native Palo Alto DPI that failed to identify this flow as TeamViewer, thing that instead works beautifully with nDPI.
Of course this information is stored in ClickHouse historical flows as shown below. This means that all the proprietary fields are not just displayed live, but also saved on historical database.
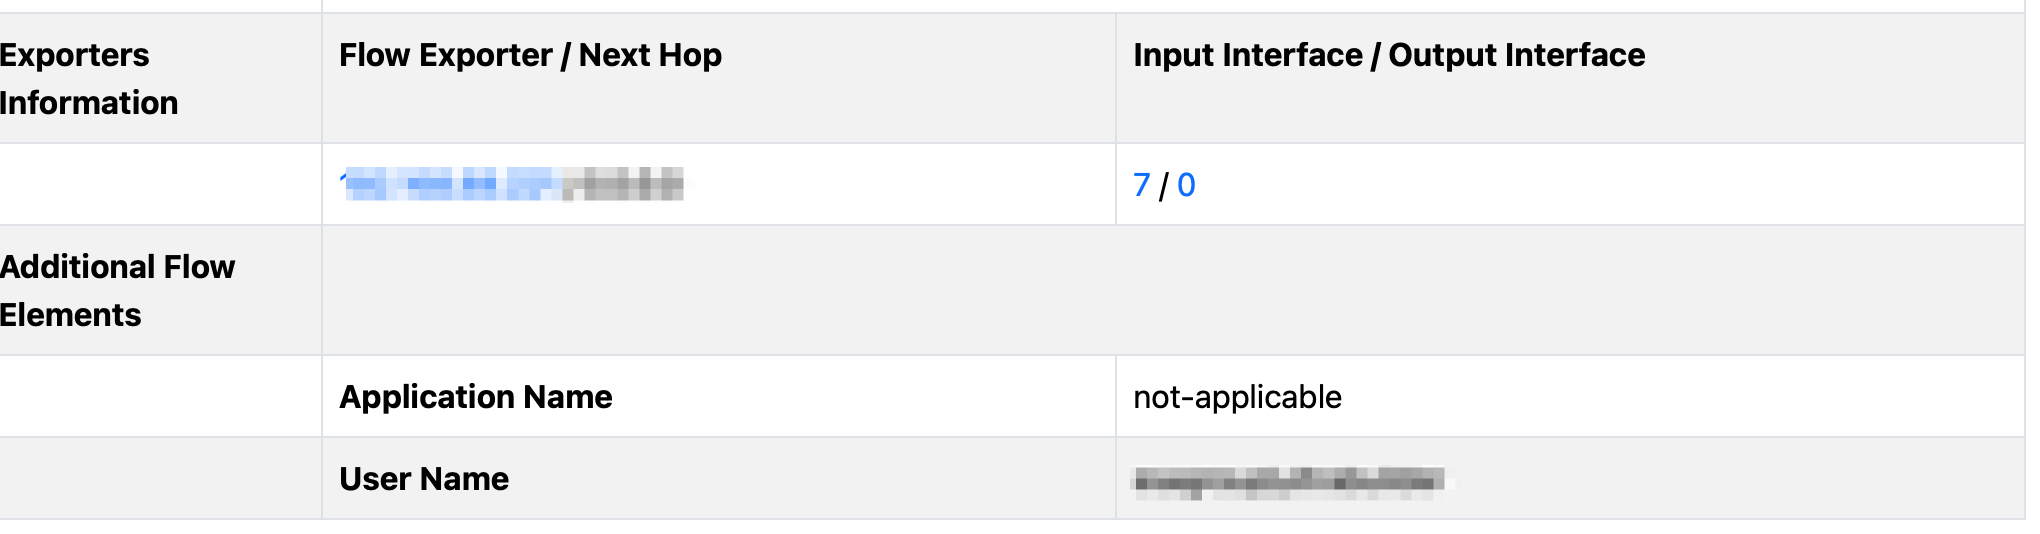
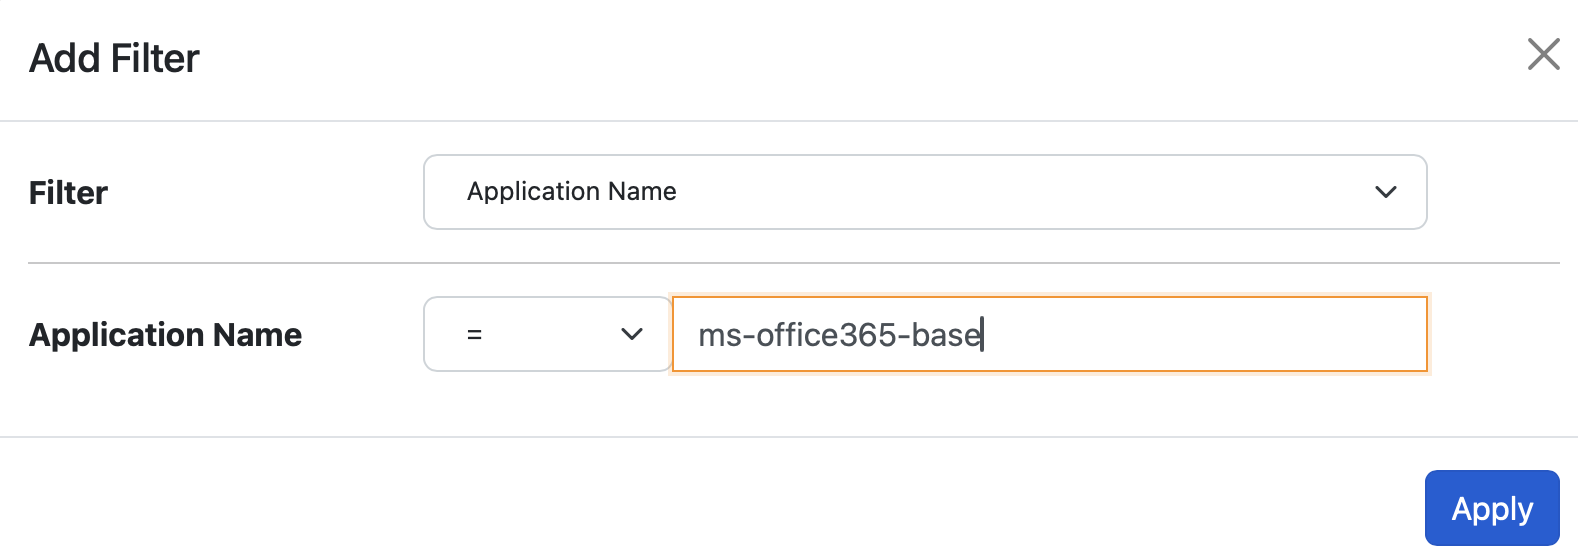
Note that you can search historical flows for these additional fields. When nProbe first connects to ntopng it sends the flow template and the mapping (read from the custom fields file) between the information elementId and its sting mapping. This means that you can do historical searched on those fields as you with standard fields such as IP address and port.
Summary
- Not all flow exporters need special handling: vendors like Fortinet that rely on standard IEs work with nProbe with zero configuration.
- Vendors like Palo Alto that use proprietary fields require defining those fields via –load-custom-fields in nProbe.
- Once collected, both standard and proprietary flow data flow through the same pipeline into ntopng and ClickHouse, so nothing is lost and everything is queryable in one place.
Enjoy !
PS. nDPI rocks !