
We are excited to announce the release of ntopng 7.0, the most significant update to ntopng in years. This release touches nearly every part of the product:
- A brand-new AI-assisted (yes you can ask ntopng to create dashboard using AI) analysis layer to a rebuilt frontend.
- A new timeseries engine based on ClickHouse
- Expanded routing (BGP/BMP) and OT visibility.
- A long list of hardening and security improvements.
nAnalyst: AI-Assisted Traffic Analysis
The headline feature of ntopng 7.0 is nAnalyst, a new layer that brings AI directly into traffic and security analysis. nAnalyst adds:
- A chat interface for live and historical flows and alerts, so you can ask questions about your traffic in natural language instead of building custom queries by hand. It supports a concise mode, streaming responses, and the ability to download the conversation.
- AI policies, with a dedicated policy runner, a policy page, policy alerts, and execution counters, letting you codify recurring analysis tasks and have them run automatically.
- AI dashboards and an agentic loop that can reason over your data step by step rather than answering in a single pass.
- Support for multiple LLM providers (Anthropic, OpenAI, Google, Qwen, and local models) with preferences for selecting a default provider and the ability to stop a response mid-generation.
- An integrated MCP server, with dedicated ntopng functions split between community and Pro editions, so external AI tools and agents can query ntopng directly.
nAnalyst is available starting from Enterprise M and above, and requires ClickHouse to be enabled. It’s also been wired into the Wazuh alerts page and into flow details, so AI-assisted analysis is available wherever you’re already looking at data.
Wazuh XDR/SIEM Integration: Merging System and Network Data
ntopng 7.0 adds native integration with Wazuh, the open-source XDR/SIEM platform. This includes:
- Collection of Wazuh alerts directly into ClickHouse, with day-based partitioning and a configurable retention preference.
- A dedicated Wazuh alerts page, alert details, an info button, and alert exceptions.
- Asset information merge (manual and automatic), with a connection check before saving credentials.
- Wazuh alerts as a recipient/notification target, and MITRE information surfaced directly in alerts. This allows you add fexibility in alert deliver that Wazuh does not natively implement.
- Sample rules and schemas shipped out of the box, for both standalone and cluster Wazuh deployments.
This lets you correlate ntopng’s network visibility with Wazuh’s host-based detections in a single place. Wazuh integration is available starting from the Enterprise M edition.
Sites: A Network-to-Site Hierarchy
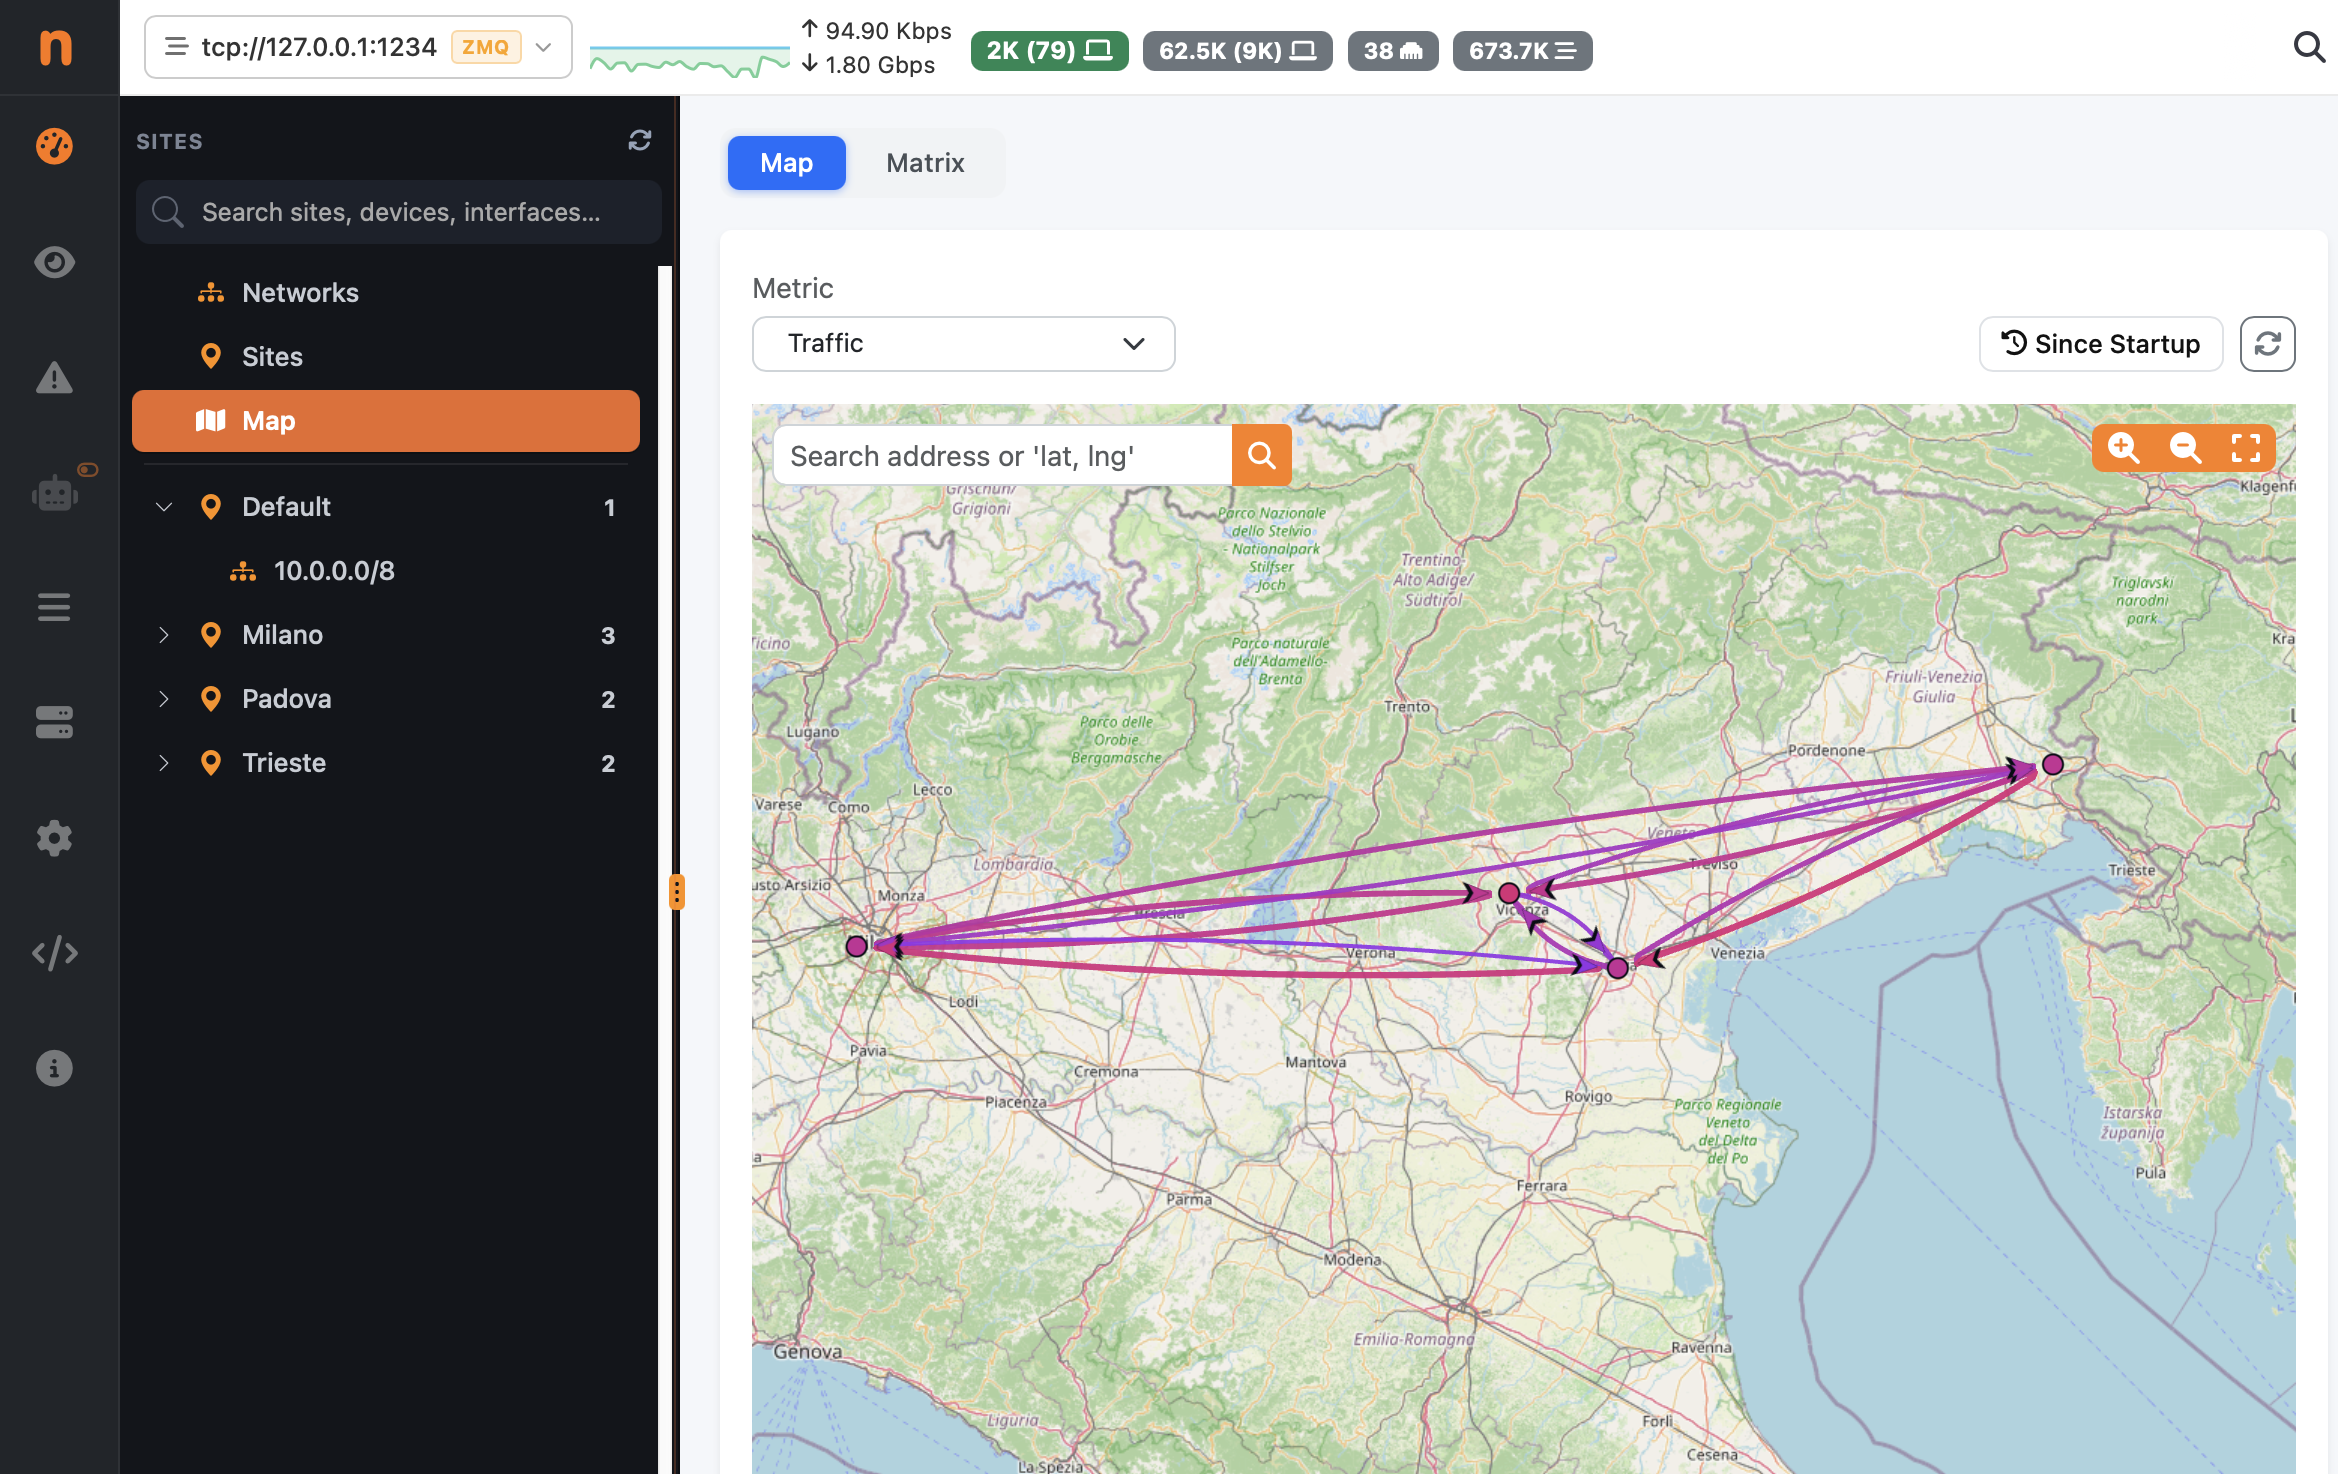
Large, distributed networks are now easier to reason about with the new Sites feature: a hierarchy that lets you group networks, exporters, and hosts by physical or logical site.
Sites come with their own dashboard (SNMP, live flows, hosts, assets, exporters, top items, descendant networks), a geomap with edges between sites, matrix/heatmap views, per-site timeseries, and site import/export. Historical flows now carry client/server Site IDs, so you can filter and aggregate by site across flows, reports, and alerts.
BGP and Routing Visibility
ntopng 7.0 adds full BGP/BMP support, including:
- A Looking Glass page with RPKI validation, best-path information, and next-hop formatting.
- Prefix-change alerts, with a dedicated preference for the prefix-changes endpoint.
- BGP information surfaced directly in live and historical flow details, and serialized into the flow JSON.
This is a meaningful step toward giving network and security teams routing-level context alongside flow-level visibility, without needing a separate tool.
A New Timeseries Engine and Observability Dashboard
We’ve implemented a new ClickHouse timeseries engine, including a High-Resolution (HR) counters driver for sub-second granularity. The former HR dashboard has been renamed Observability and now supports group-by queries, and we ship sample Grafana dashboards you can download directly from the preferences page. Retention is now handled by dropping partitions rather than relying on TTLs, which is both faster and more predictable at scale.
Stronger Authentication and Security
Security has been a major focus of this release, and we have worked hard to make it EU CRA (Cyber Resilience Act) compliant:
- SSO with OpenID Connect, Multi-Factor Authentication, Passkey support, and X-API-Key/bearer token authentication for REST calls.
- A cryptographically strong random source for HTTP session identifiers.
- Administrator capability checks extended to configuration backup, flow filters, notification endpoints, and pools.
- Continued hardening of packet dissectors (DNS, mDNS, NetBIOS, SSDP, Modbus, CAPWAP, EtherNet/IP, RTP, ZMQ, HTTP parameters), backed by continuous fuzzing via ClusterFuzzLite and OSS-Fuzz.
- HTTPS is now enabled by default in the configuration file.
- All ZMQ communications are encrypted by default.
- An official application SBOM is now produced with every release.
The changelog also lists a substantial number of fixed heap and stack overflows, integer overflows, and other memory-safety issues found through this hardening work, all worth a look if you run ntopng in security-sensitive environments.
A Rebuilt Frontend
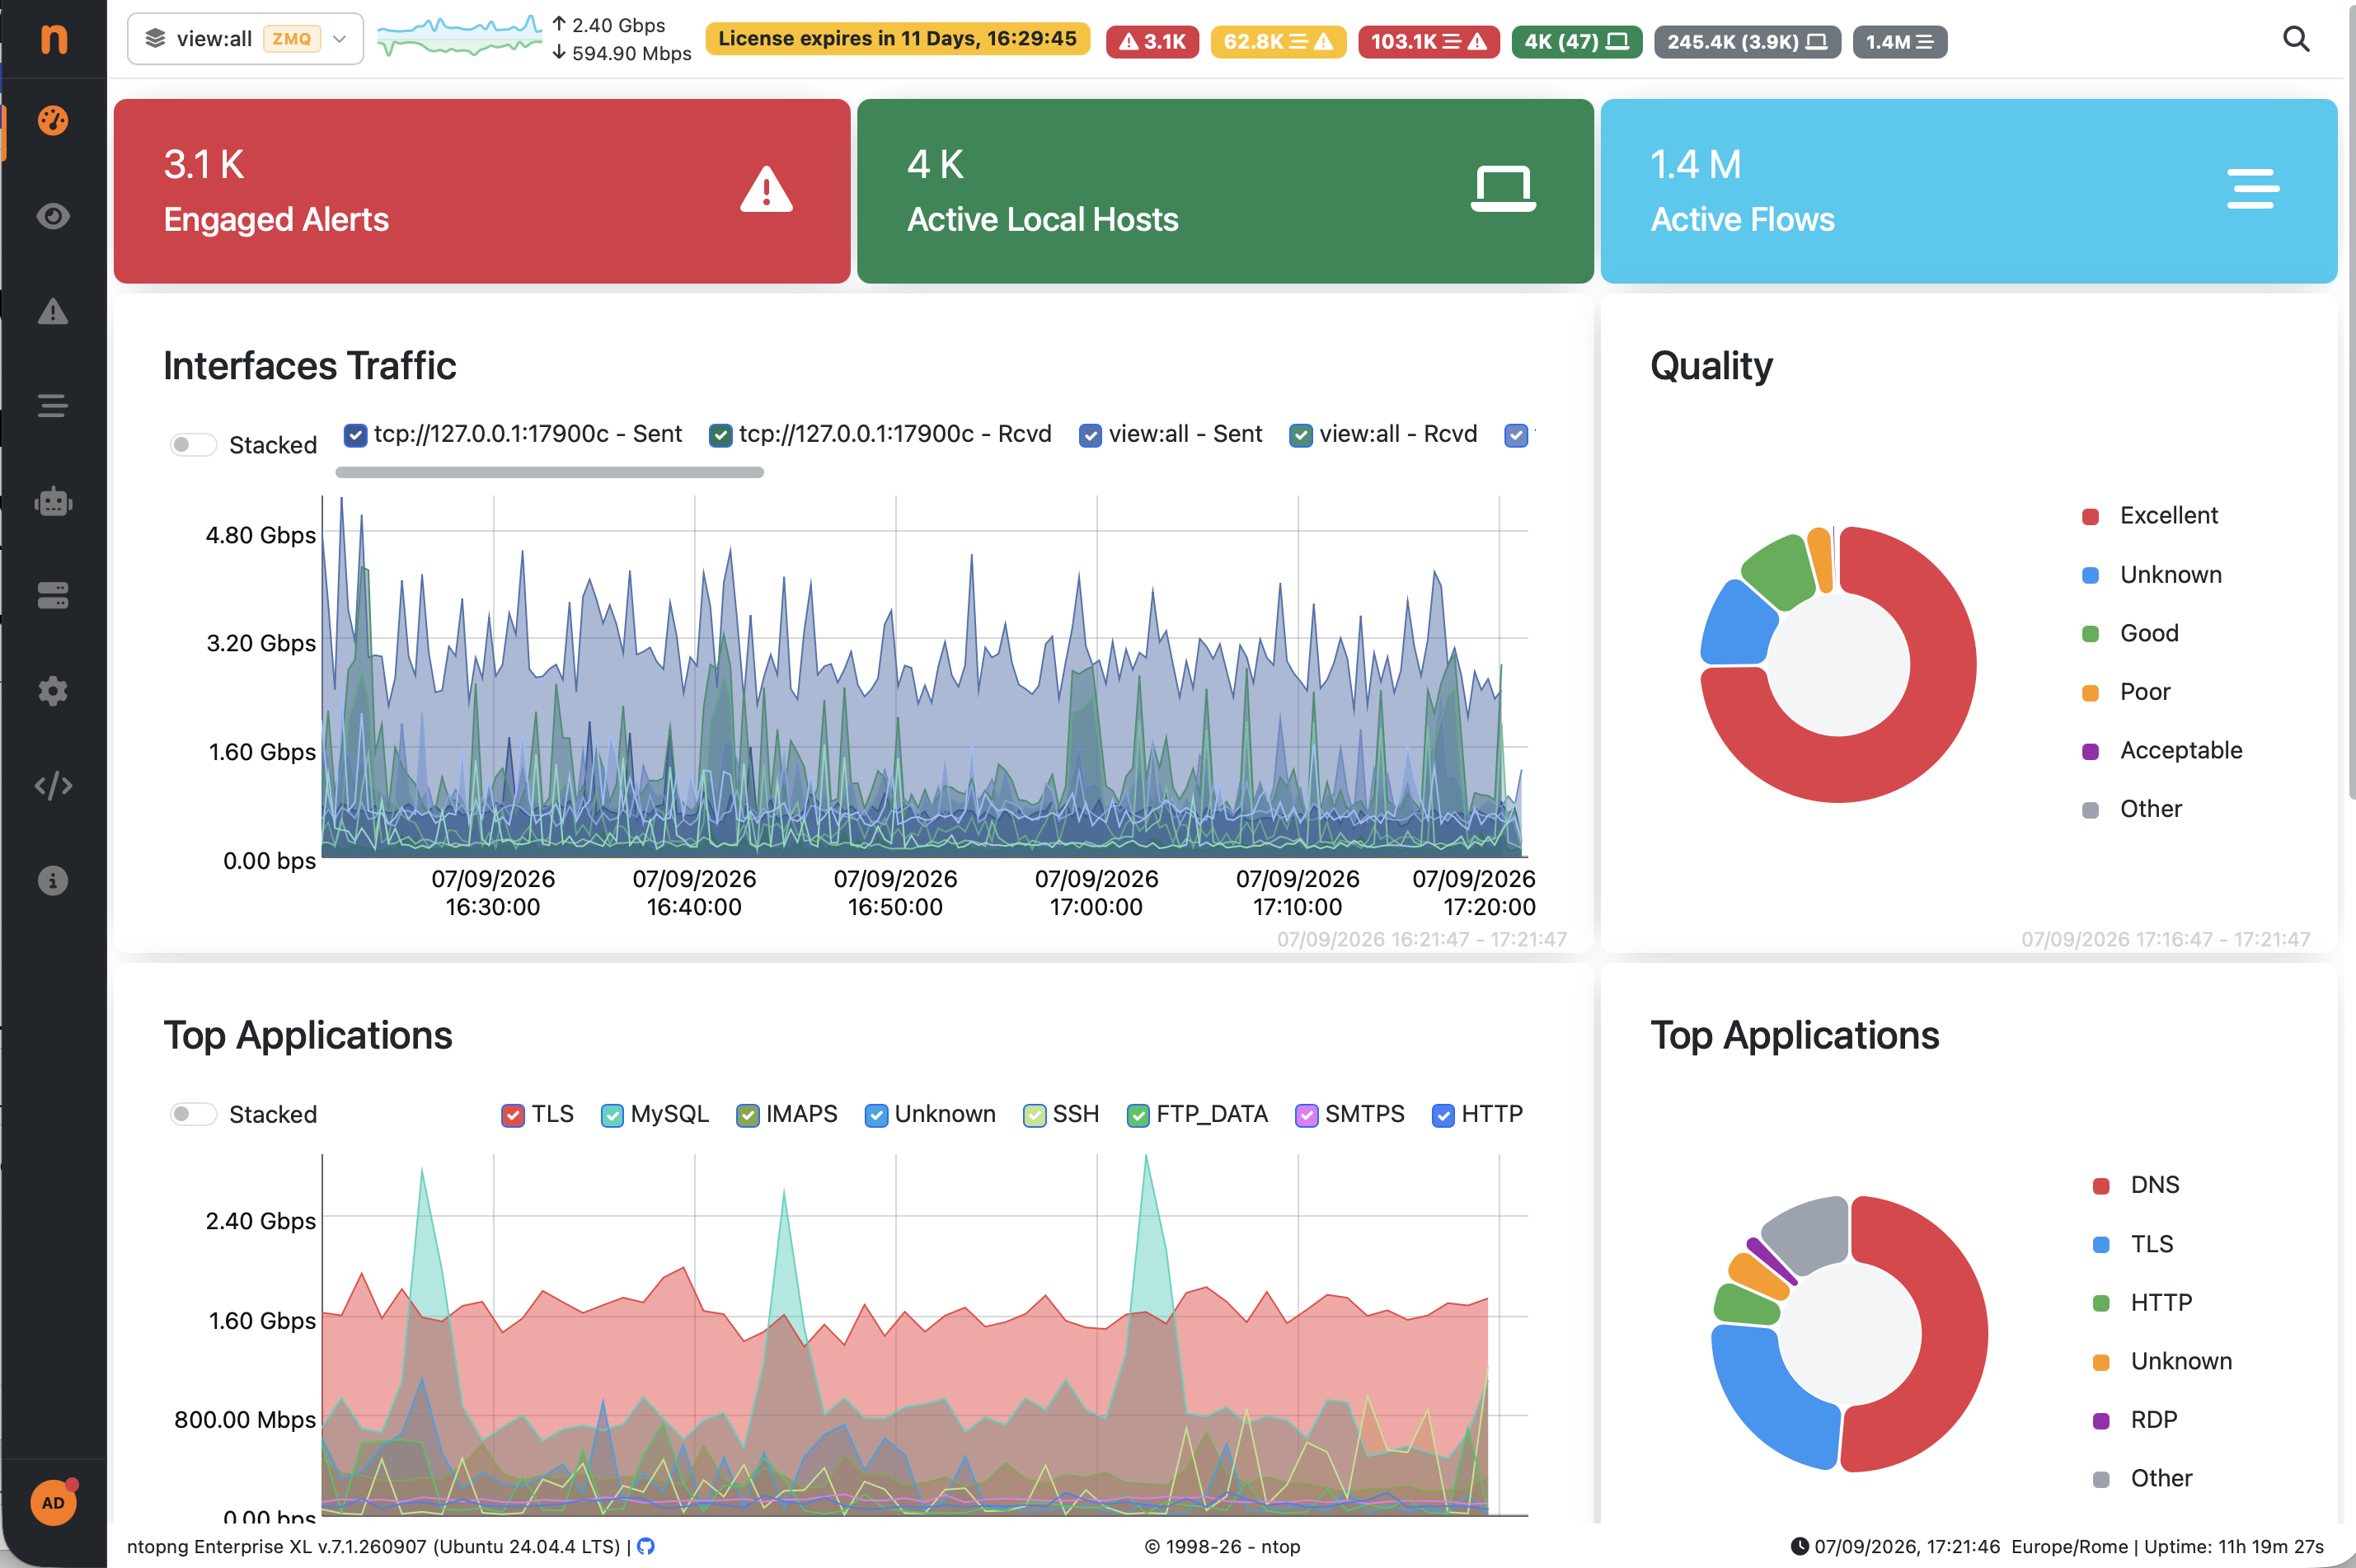
ntopng’s frontend has been substantially modernized in 7.0. The menu, footer, top bar, and preferences pages (along with checks, VLANs, networks, MAC addresses, the service map, backups, configurations, DHCP leases, and more) have all been ported to Vue.js. We’ve also replaced ApexCharts with D3-based charts (pie, bar, line, stacked, heatmap, bubble, chord, sankey, and geomap), moved the frontend build to Vite, and enabled gzip compression, cutting the size of the shipped frontend assets by roughly 7x. You’ll also notice a new guided demo, a friendlier startup page, and improved dark mode and mobile rendering throughout.
Expanded OT and Flow Visibility
OT/ICS visibility has been extended with S7comm and Profinet support, alongside improvements to Modbus statistics and alerting. On the flow-collection side, 7.0 introduces flow deduplication (enabled by default where available), full IPv6 support for flow exporters, the new nDPI flow fingerprint, PQC (post-quantum) flow detection, VPN and Slow DoS detection, and a reworked exporter implementation with better next-hop and IP handling.
nEdge Lite
Finally, this release introduces nEdge Lite, a lighter-weight variant of nEdge — more details on this will be announced separately in the coming weeks.
Upgrading
ntopng 7.0 also brings a number of behavioral changes worth reviewing before you upgradem including the removal of the --community startup option (ntopng now starts in community mode automatically when no license is provided), the move of Wazuh integration to Enterprise M, and the removal of several deprecated components (bundled rrdtool, legacy DoH/DoT code, old database migration code, and the ApexCharts/nvd3/dc/cubism dependencies). We recommend reading through the full changelog before rolling this out to production.
We Want to Hear From You
ntopng 7.0 represents months of work across AI, security, routing, and the frontend, and we’re proud to put it in your hands. But a release like this is really just the start of a conversation, we’d love to know what you think.
Tried nAnalyst? Hit a rough edge in the new Vue.js pages? Have a use case for BGP visibility or Sites we haven’t thought of? Please tell us. You can reach us through the ntop community, file a bug report, or drop a note in our Telegram channel. Your feedback is what shapes the next release, thank you for helping us build ntopng.
Enjoy !
P.S. We promise to shorten our development cycles and deliver stable releases more frequently. This means that even if you aren’t on the development branch, you can enjoy our latest features without the long wait.