Collecting flows on large networks with hundred of routers can be challenging. Beside the number of flows to be collected, another key point is to be able to visualize the informations in a simple yet effective way. ntopng allows you to create up to 32 virtual flow collection interfaces that can be used to avoid merging collected flows: unfortunately they are not enough when collecting flows from 100+ routers. In the latest ntopng and nProbe dev versions (soon to become stable), we have implemented the concept of observation point, that in IPFIX is defined as a location in the network where packets can be observed.
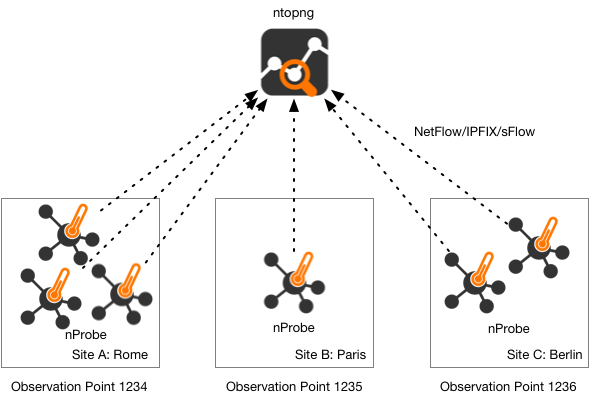
The problem we want to solve is: how-to to cluster flows becoming from the same site regardless of the probe IP that originates them, avoid merging them with those coming from other sites, but still have the ability so see them as a whole at the interface level where flows are collected. Each nProbe instance can be configured to set a numerical value for the observationPoint Id that uniquely identifies a site. Depending on the site size, a site can have one or multiple probes. In nProbe the observationPoint is set with the -E flag as follows:
Rome
nprobe -E 0:1234--zmq tcp://192.168.1.100:1234 --zmq-probe-mode -i eth1nprobe -E 0:1234--zmq tcp://192.168.1.100:1234 --zmq-probe-mode -i eth2nprobe -E 0:1234--zmq tcp://192.168.1.100:1234 --zmq-probe-mode -i eth3
Paris
nprobe -E 0:1235--zmq tcp://192.168.1.100:1234 --zmq-probe-mode -i eno1
Berlin
nprobe -E 0:1236--zmq tcp://192.168.1.100:1234 --zmq-probe-mode -i enp2s0f0nprobe -E 0:1236--zmq tcp://192.168.1.100:1234 --zmq-probe-mode -i enp2s0f1
Central ntopng Flow Collector
ntopng -i tcp://92.168.1.100:1234c
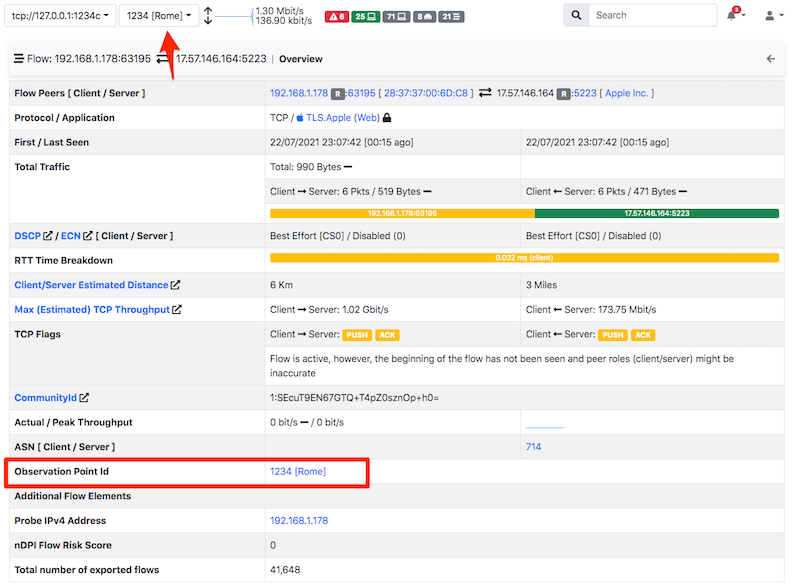
When flows are sent by nProbe, they are uniquely marked with the observationPoint Id that is honoured by ntopng during flow collection and reported in the web interface.
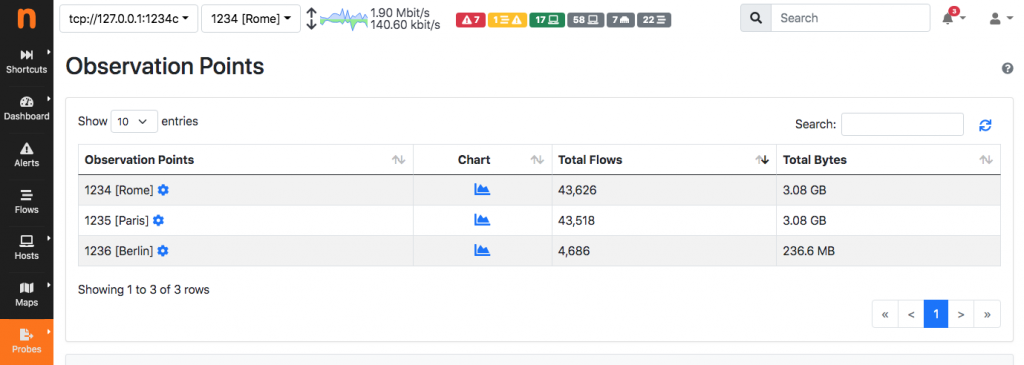
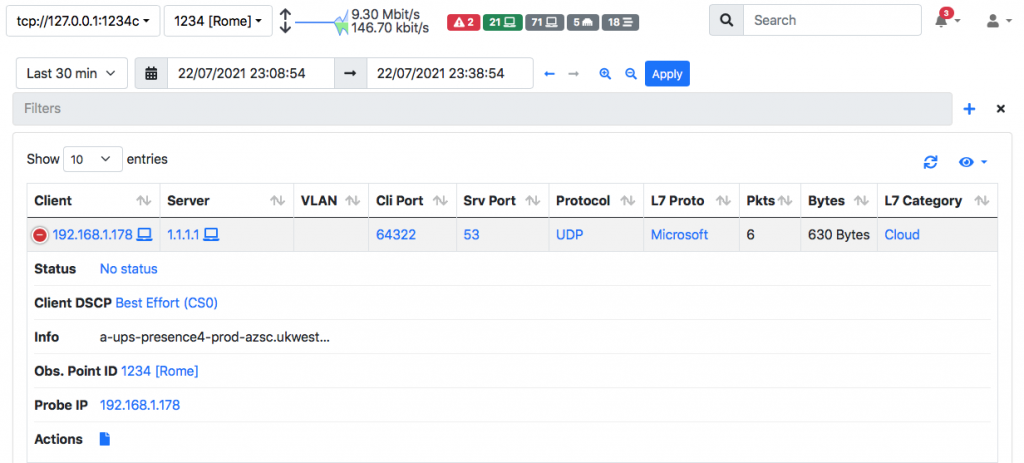
In the top menubar, ntopng lists all the known observationPoint Ids in the dropdown menu: this way a network analyst can select the observationPoint he wants to visualise while hiding flows from a different observation point. On the left sidebar Probes menu, it is possible to list all the known observationPoint Ids, set a custom name clicking on the wheel icon, and visualize traffic statistics clicking on the chart icon.
While flows are kept split, hosts, ASs, networks etc traffic is merged at the interface level regardless of the observation Point Id that has originated it. This choice allows statistics not to be duplicated when hosts from different observationPoints talk together. For instance if a host from the Rome site is talking to www.google.com, and a host from Berlin is also talking to www.google.com, ntopng will keep in memory a single www.google.com host entry accounting the total of the traffic. When flows are stored on nIndex, they both have the observationPoint Id and the probe IP address that exported it: this enables network analysts to drill down a problem (e.g. reported with a ntopng generated alert) up to the traffic origin.
In summary, using observation points it is possible to partition the traffic according to a site, while keeping consistent counters for hosts, ASs, and networks. Note that in case of networks with overlapping addresses (e.g. two hosts with address 192.168.1.1 deployed at two different locations), in order to avoid merging traffic for hosts with the same IP but physically different, it is instead advised to collect their traffic using two different ntopng virtual collection interfaces.
Enjoy!