ntopng is able to deliver monitored traffic flows data to a MySQL server. We have already discussed how to configure ntopng to deliver this data in another blog post.
In this article we discuss the new features that allow you to dig deep into the flows dumped to MySQL using the ntopng web GUI. Earlier ntopng releases didn’t allow for thorough historical analyses and were only giving access to recorded flows and providing limited sorting features.
With the advances made in the latest ntopng Pro Small Business it is possible to drill-down historical flows and obtain, among other things:
- Talkers
- Historical IPv4 and IPv6 talkers;
- The peers list of each talker, together with the amount of traffic exchanged with any peer;
- The application protocols (layer 7) traffic exchanged between a talker and any of its peers.
- Layer-7 Application Protocols
- Historical layer-7 application protocols;
- The talkers list of each application protocol, together with the amount of traffic that involves each talker;
- The peers list that exchanged traffic with a talker using any given application protocol.
All the information pointed out above can be sorted using multiple criteria such as traffic exchanged, number of packets and number of flows. Moreover, the search criteria generated automatically while drilling-down the data can be saved and re-used directly in the future.
Additionally, it is possible to download raw flows or even pcap files matching the search criteria. Pcap files can be downloaded if an nBox with n2disk has been configured via ntopng preferences.
In the remainder of this post we show how to use the ntopng web GUI to dig deep into the recorded flows.
Drill-down features will only be available if ntopng was started with a properly configured MySQL database specified via the -F modifier. We refer the reader to this post for a detailed explanation.
Assuming ntopng has been properly started and instructed to export monitored flow data to MySQL, extra tabs will become available in the historical page of both interfaces and local hosts.
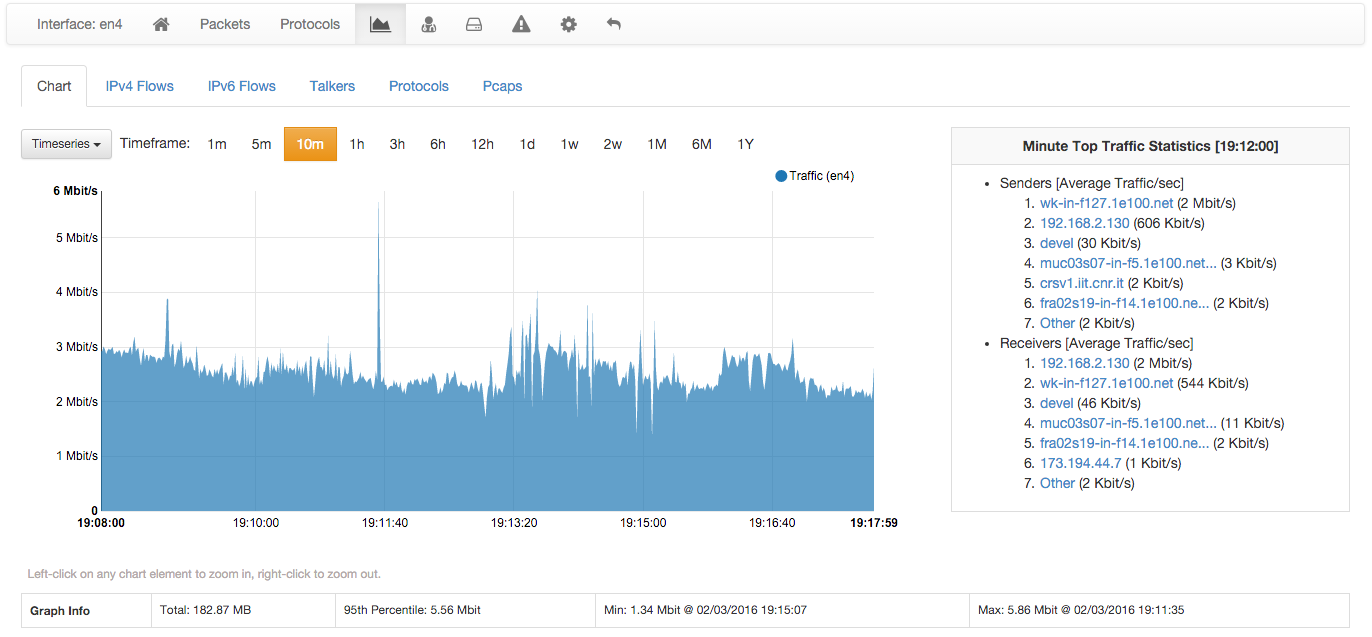
Chart Tab
The historical page shows in its default tab a chart of the data. The chart is clickable and zoomable to go back in time and select a time-span of interest.
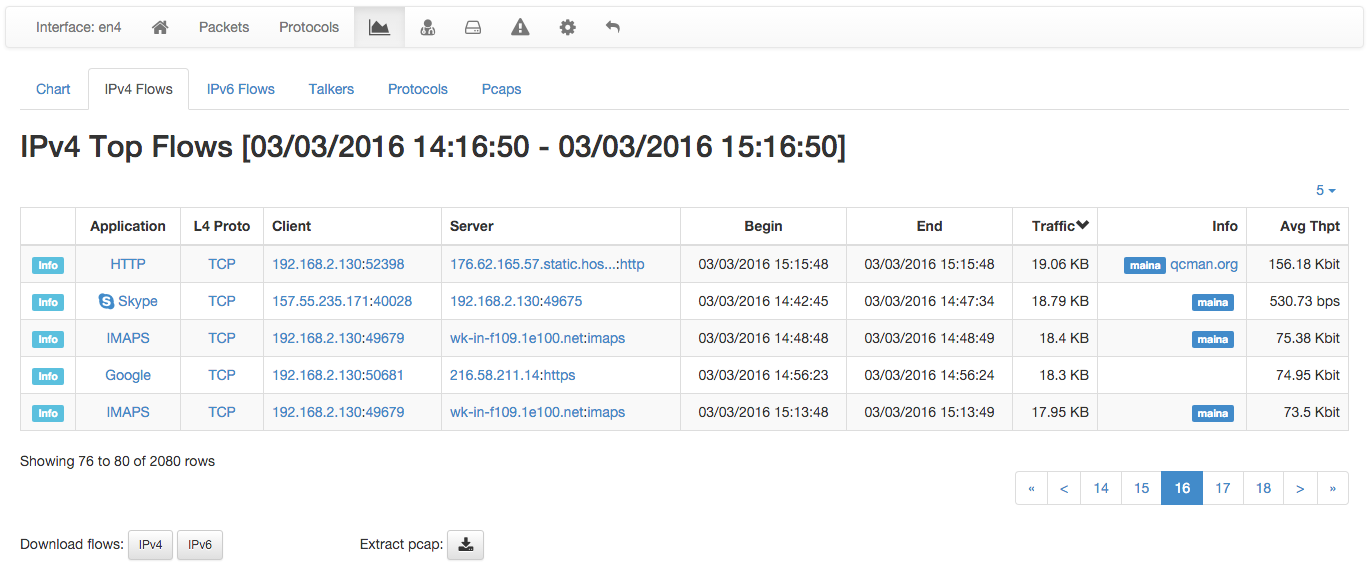
IPv4 and IPv6 Flows Tab
On the right of the Chart tab there are four additional tabs. The first two visualize monitored flows in the selected time-span. If no IPv4 (IPv6) flows are present in the observation period, then the corresponding tab will be automatically hidden. And handy download button is available to fetch a pipe-separated txt file with all the flows.
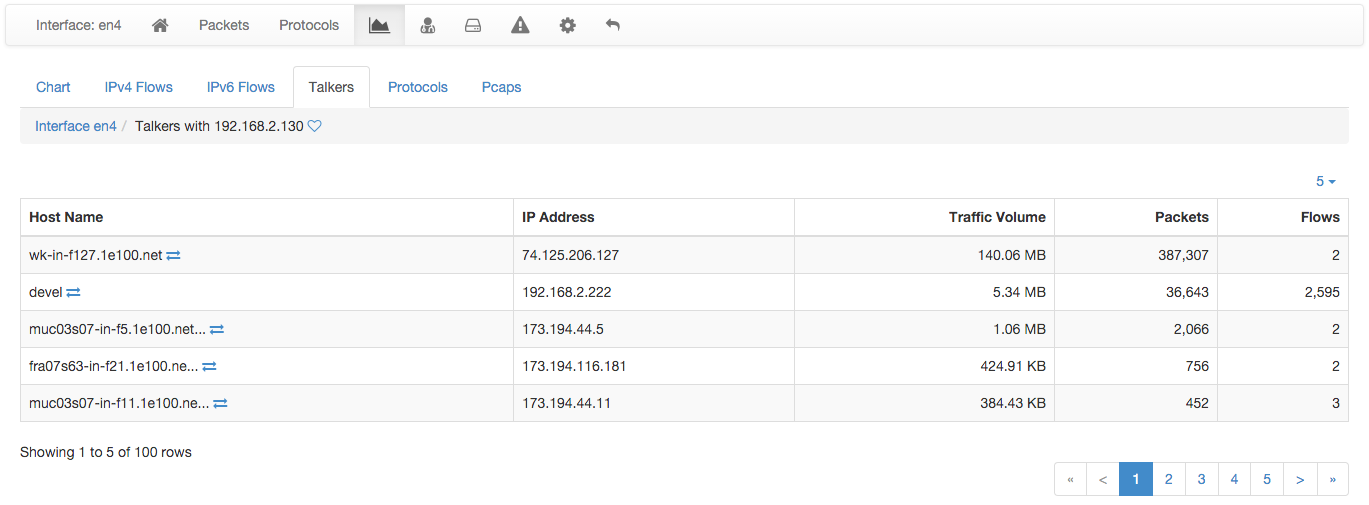
Talkers Tab
As soon as the Talkers tab is selected, a dynamic table with the talkers of the selected time-span is automatically loaded. By default, talkers are sorted based on the amount of traffic generated. Table columns are clickable to specify a custom sort order.
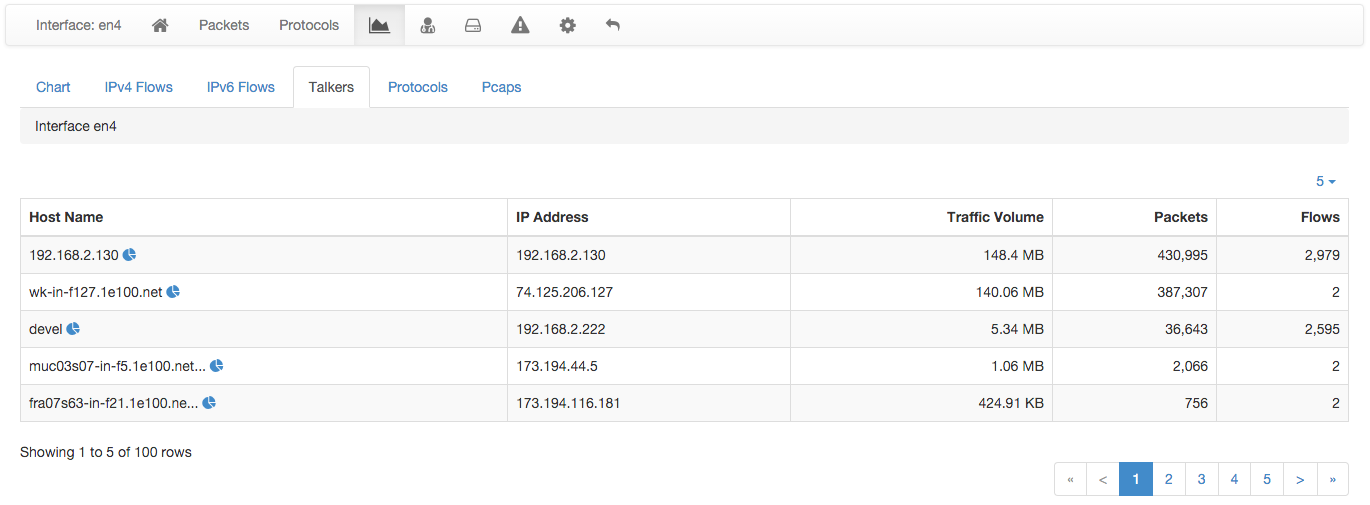
Next to each talker there is an icon that can be clicked to inspect the peers that have exchanged traffic with the talker in the selected time period. The peers list loaded is sorted, by default, in a decreasing order of traffic exchanged.
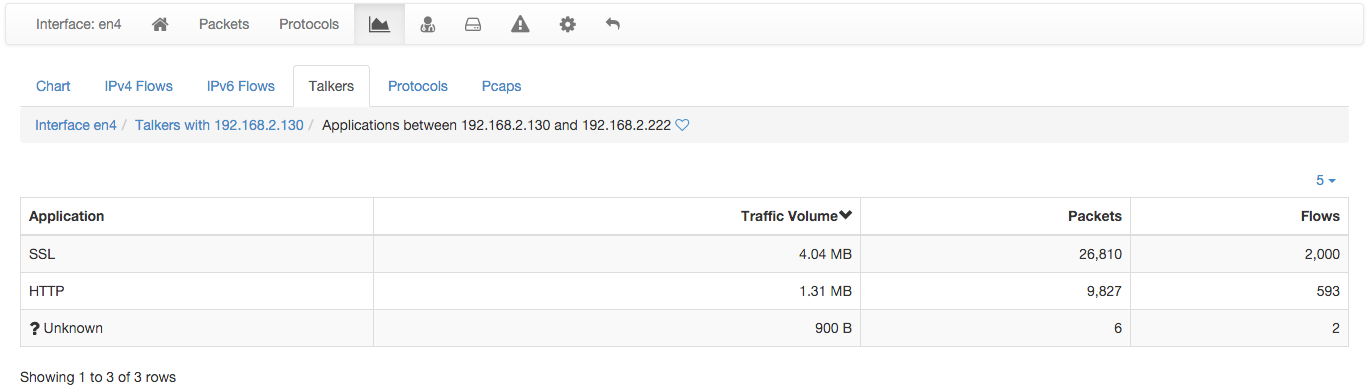
The icon on the right of each peer can be clicked to inspect the Layer-7 application protocols that were used by the talker and the selected peer.
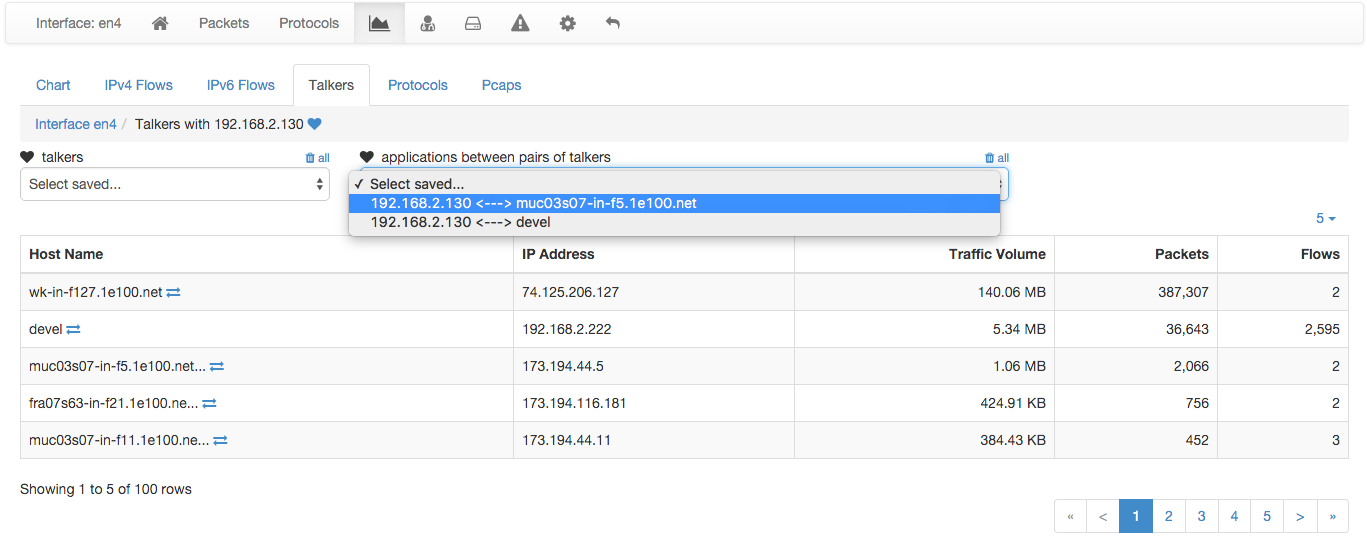
Both the talker itself and the application protocols between any of its peers can be saved simply by clicking on the heart shown in the top breadcrumb. Saved items will be readily available in dropdown menus for future quick selections.
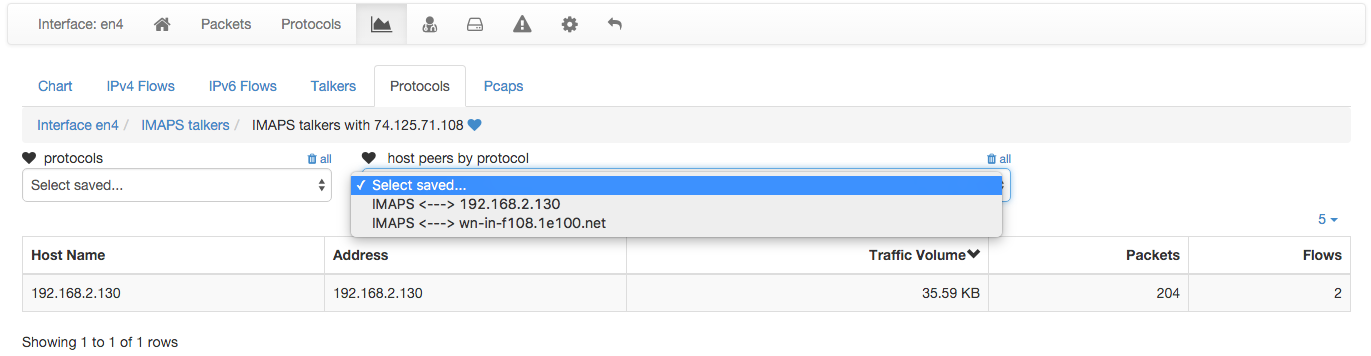
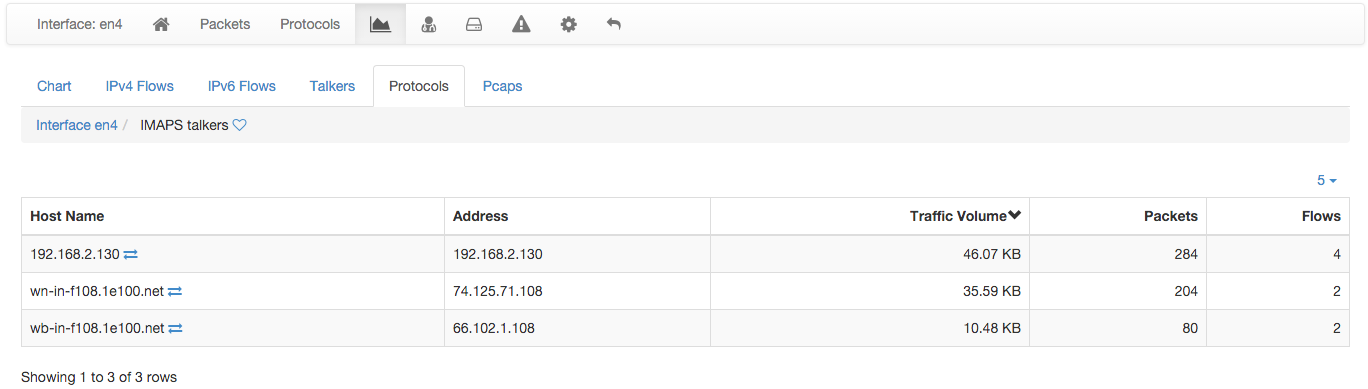
Protocols Tab
A dynamic table showing Layer-7 application protocols, sorted by traffic volume, is loaded and shown as soon as the Protocols tab is selected. Different sort criteria can be selected by clicking on column headers.
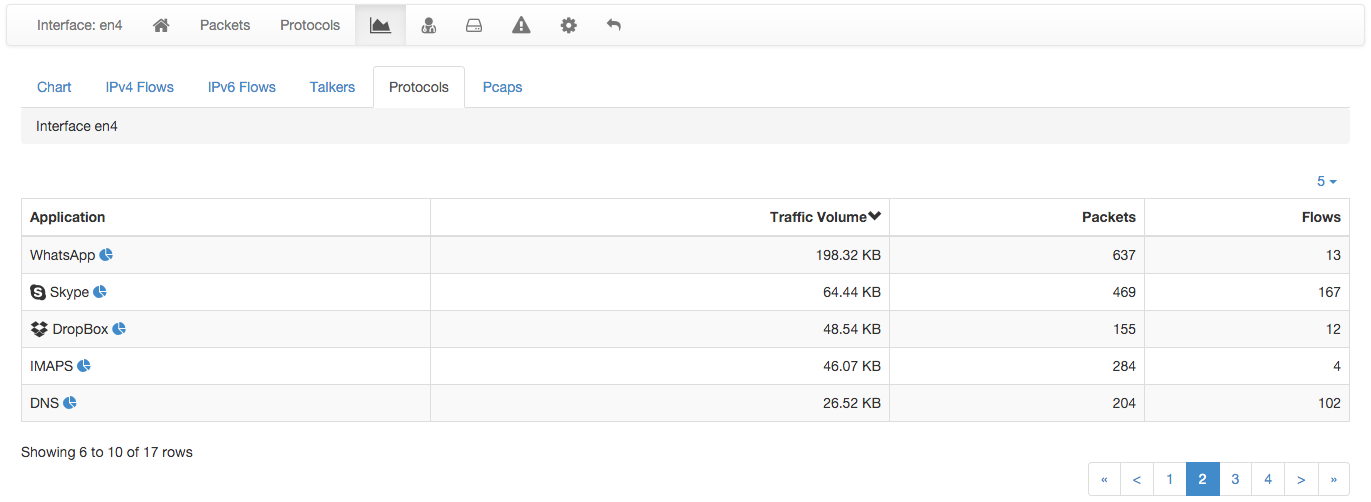
An icon it is shown on the right of every application protocol and can be clicked to drill-down the talkers that have used the application protocol. The resulting talkers list is shown in a table that, by default, is sorted according to the traffic volume.
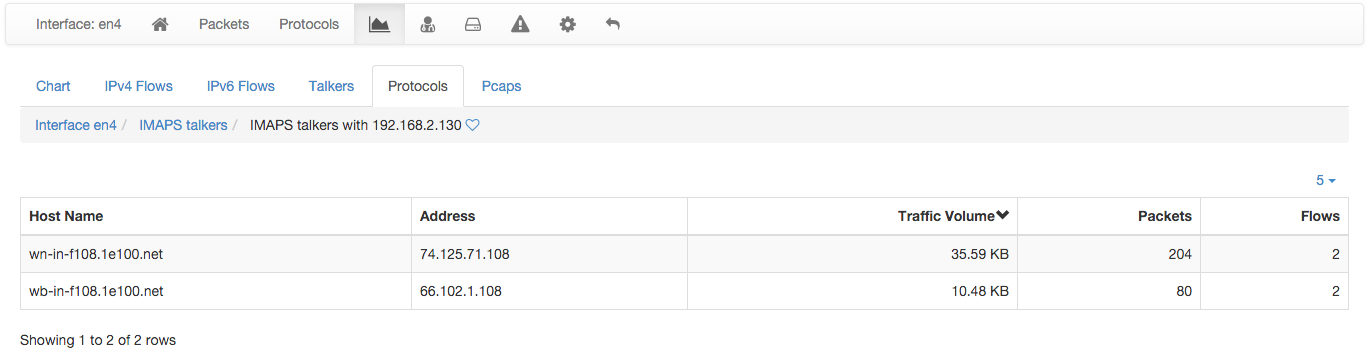
In order to go deeper and browse the list of peers that interacted with a talker using a given protocol, it suffices to click on any ‘double-arrow’ icon next to each talker. A new table with the peers list is shown.
Layer-7 application protocol talkers and their peers lists can be saved by clicking on the heart icons shown in the navigation breadcrumb. Saved items will be shown in two dropdown menus.