Today we are glad to announce the new 3.2 stable release of ntopng. Among the most important new features available in this release, there is without any doubt an advanced network devices discovery functionality. Historically, ntopng has always been a fully passive monitoring tool. This release aims at complementing the information gathered from a purely passive packet capture with precious extra bits of data obtained by actively searching for devices. Network devices discovery glues together multiple techniques and heuristics, including ARP pinging, SNMP querying, SSDP discovery and MDNS names resolution. By opportunely combining the pieces of information obtained by actively probing network devices, ntopng is not only to discover them, but also to understand the services they provide as well as the operating system they run.
This is what the outcome of a active network device discovery looks like in ntopng.
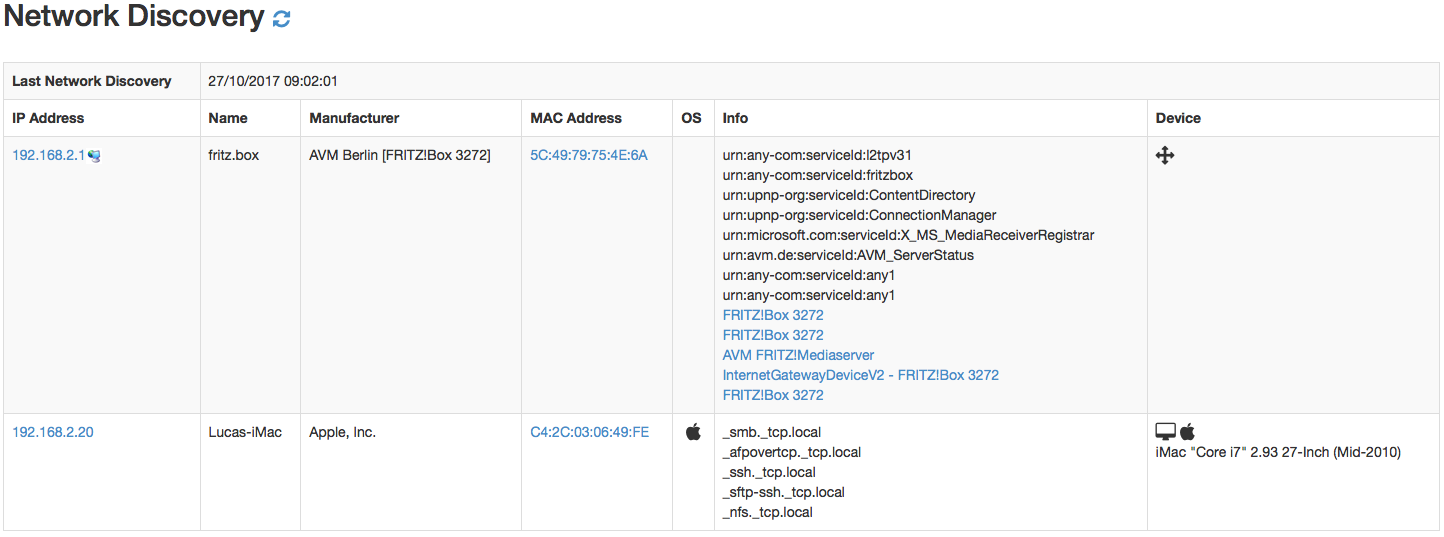
For a detailed explanation of all the techniques and heuristics implemented, we refer the interested reader to this article.
ntopng release 3.2 is also incredibly more efficient when it comes to handling big traffic volumes. Indeed, I/O operations have been reduced to a great extent, thus alleviating the pressure on disks and, at the same time, making the software running faster. In addition, all the periodic activities that crunch hosts and interfaces traffic into time series data are now run by a thread pool that orchestrates their execution in parallel to fully leverage any modern multi-core system. The benefits of reduced I/O and parallel periodic activities execution together make ntopng sensibly more responsive also when browsing the web user interface.
As usual, ntopng installation instruction can be found at packages.ntop.org.
The complete list of changes introduced in this release is the following:
New features
- Support for the official ntopng Grafana datasource plugin
- Plugin available at: https://grafana.com/plugins/ntop-ntopng-datasource
- Newtork devices discovery
- Discovery of smartphones, laptops, IoT devices, routers, smart TVs, etc
- Device type and operating system detection
- ARP scan, SSDP dissection, Multicast DNS (MDNS) resolution
- DHCP fingerprinting
- Adds an active flows page to the AS details
- Bridge mode
- Enforcement of global per-pool time and byte quotas
- Support of per-host traffic shapers
- Added support for banned sites detection with informative splash screen
- Implement per-host/mac/pool flow drop count
- nDPI traffic categories and RRDs
- Implements MySQL database interoperability between ntopng and nProbe
Improvements
- Flows sent by nProbe over ZMQ
- Batched, compressed ZMQ flow format to optimize data exchange
- Use of post-nat src/dst addresses and ports
- Handles multiple balanced ZMQ endpoints
- Periodic tasks performed by a thread-pool to optimize cores utilization
- Hosts and devices are walked in batches to greatly reduce Lua VM memory
- Full systemd support for Debian, Ubuntu, Centos, and Raspbian
- Extended sFlow support to include sample packet drops and counter stats in interface views
- Stacked applications and categories charts for ASes, Networks, etc
Security Fixes
- More restrictive permissions for created files and directories
- Fix of a possible dissectHTTP reads beyond end of payload