sFlow, short for sampled Flow, is a sampling technology designed to export network devices information, namely:
- Interface counters (à la SNMP MIB-II);
- Traffic packets (à la ERSPAN).
sFlow agents run on switches, routers, firewalls and other devices, and periodically export interface counters and traffic packets via UDP towards one or more sFlow collectors. sFlow, relying on sampling processes to periodically counters and packets, is scalable and ultra-lightweight and has been embedded into network devices by tens of vendors and manufacturers.
Contrary to NetFlow (please note that in sFlow parlance the word ‘flow’ has a totally different meaning with respect to what ‘flow’ means in NetFlow), which requires a stateful representation of all the network flows packets to operate, sFlow merely sample packets and counters and thus its impact on network devices memory and CPU is much lower. For this reason, is should be the technology of choice when carrying out certain network monitoring tasks. ntop team members have discussed in detail this technology during a couple of SharkFest conferences (SharkFest Europe, SharkFest US). The interested reader can download the presentation slides to gain a deeper understanding of sFlow, or even watch the youtube video of the presentation:
ntop software tightly integrates with sFlow:
- nProbe acts as an sFlow collector and can collect sFlow from tens or even hundreds of network devices, simultaneously;
- ntopng receives collected sFlow data from nProbe and is in charge of providing visualizations and actionable insights from this data.
Hence, using ntop software nProbe and ntopng, it is possible to easily and quickly setup a monitoring architecture for multiple sFlow-capable network devices in minutes.
Let’s see an example. Let’s say there are sFlow agents exporting sFlow on port 6343 of an host running nProbe. Let’s also say and ntopng running on the same host is used for the visualization and analysis. Configuring nProbe and ntopng is a breeze and it merely boils down to:
nprobe -i none -n none --collector-port 6343 --zmq tcp://127.0.0.1:5556
ntopng -i tcp://127.0.0.1:5556
Commands above have the following meaning:
nprobeis neither collecting from a physical interface (-i none) nor exporting flows towards a downstream NetFlow collector (-n none); it’s just collecting incoming sFlow on port 6343 (--collector-port 6343). Collected data is then exported to an ntopng running on localhost port 5556 via ZMQ (--zmq tcp://127.0.0.1:5556).ntopngis listening on port 5556 for incoming collected sFlow data (-i tcp://127.0.0.1:5556).
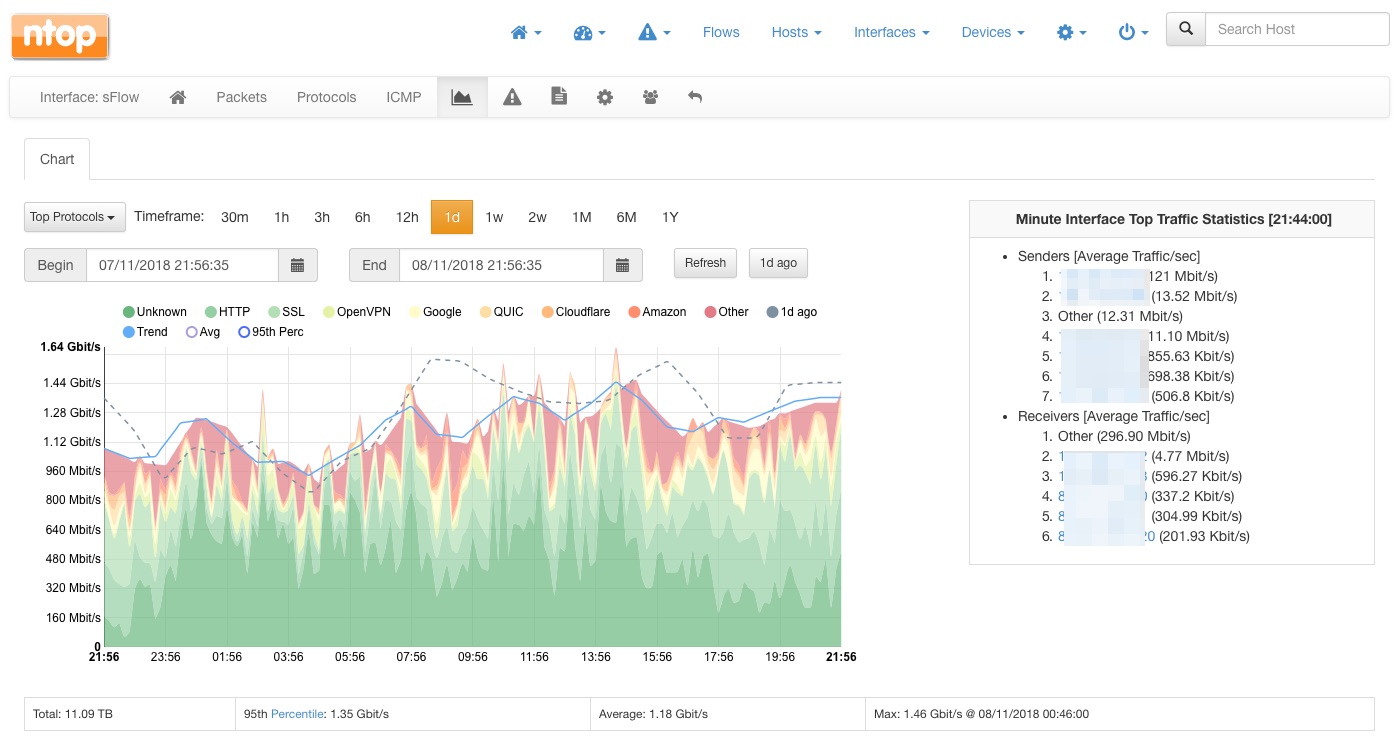
The ntopng web dashboard will shortly populate with collected data, including top senders and top destinations, as well as the top layer-7 application protocols detected from the traffic. Similarly, all the other ntopng pages will populate with rich data. For example, one can visualize the top layer-7 application protocols by visiting the interface page:
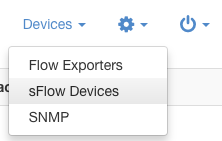
Nevertheless, ntopng not only provides visibility on the traffic that is traversing the network devices, it also provides visibility into the devices per se. To access the list of sFlow devices that are currently actively exporting sFlow, select the “sFlow Exporters” entry from the “Devices” dropdown.
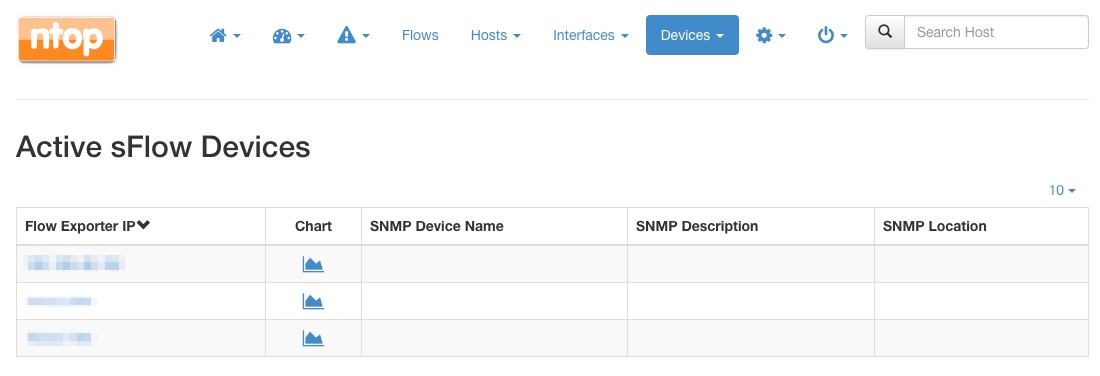
The devices list will be shown, along with a chart link as well as data obtained via SNMP (when available). SNMP data shows up automatically when SNMP monitoring is configured in ntopng and there is a match between the IP address of the SNMP and the sFlow device.
The address of every device listed can be clicked to access a summary of all the device interfaces, including their status and total traffic:
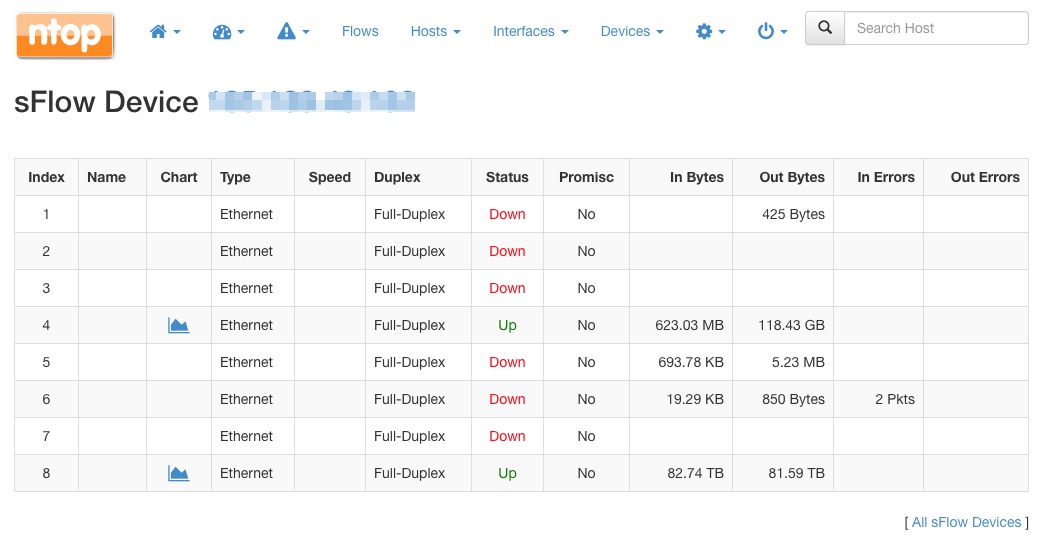
Similarly, the chart link provides visibility into the traffic of every interface of the selected network device. An handy stacked view will provide a useful summary of the interfaces activity:
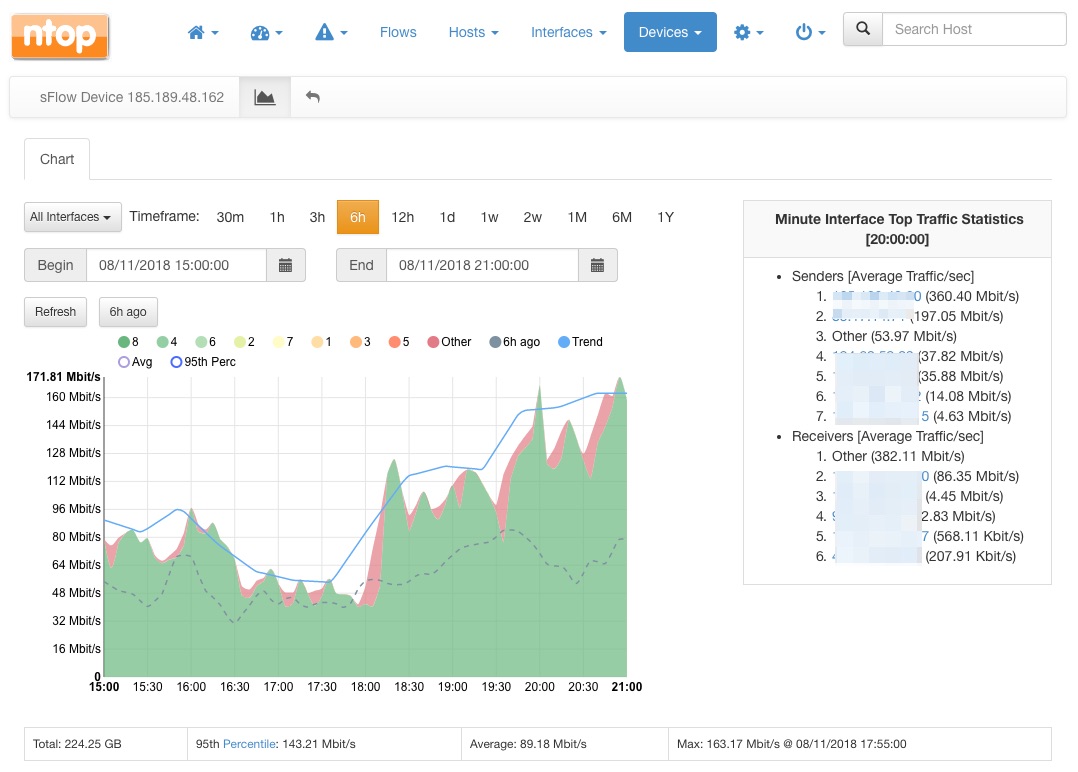
For example, from the chart above, it is clear that interface with id 8 is accounting for most of the device traffic over the 6-hour time interval selected.
Happy sFlow collection!