Use Cases: SOC Analysts
Case 1: Investigate Suspicious DNS Queries
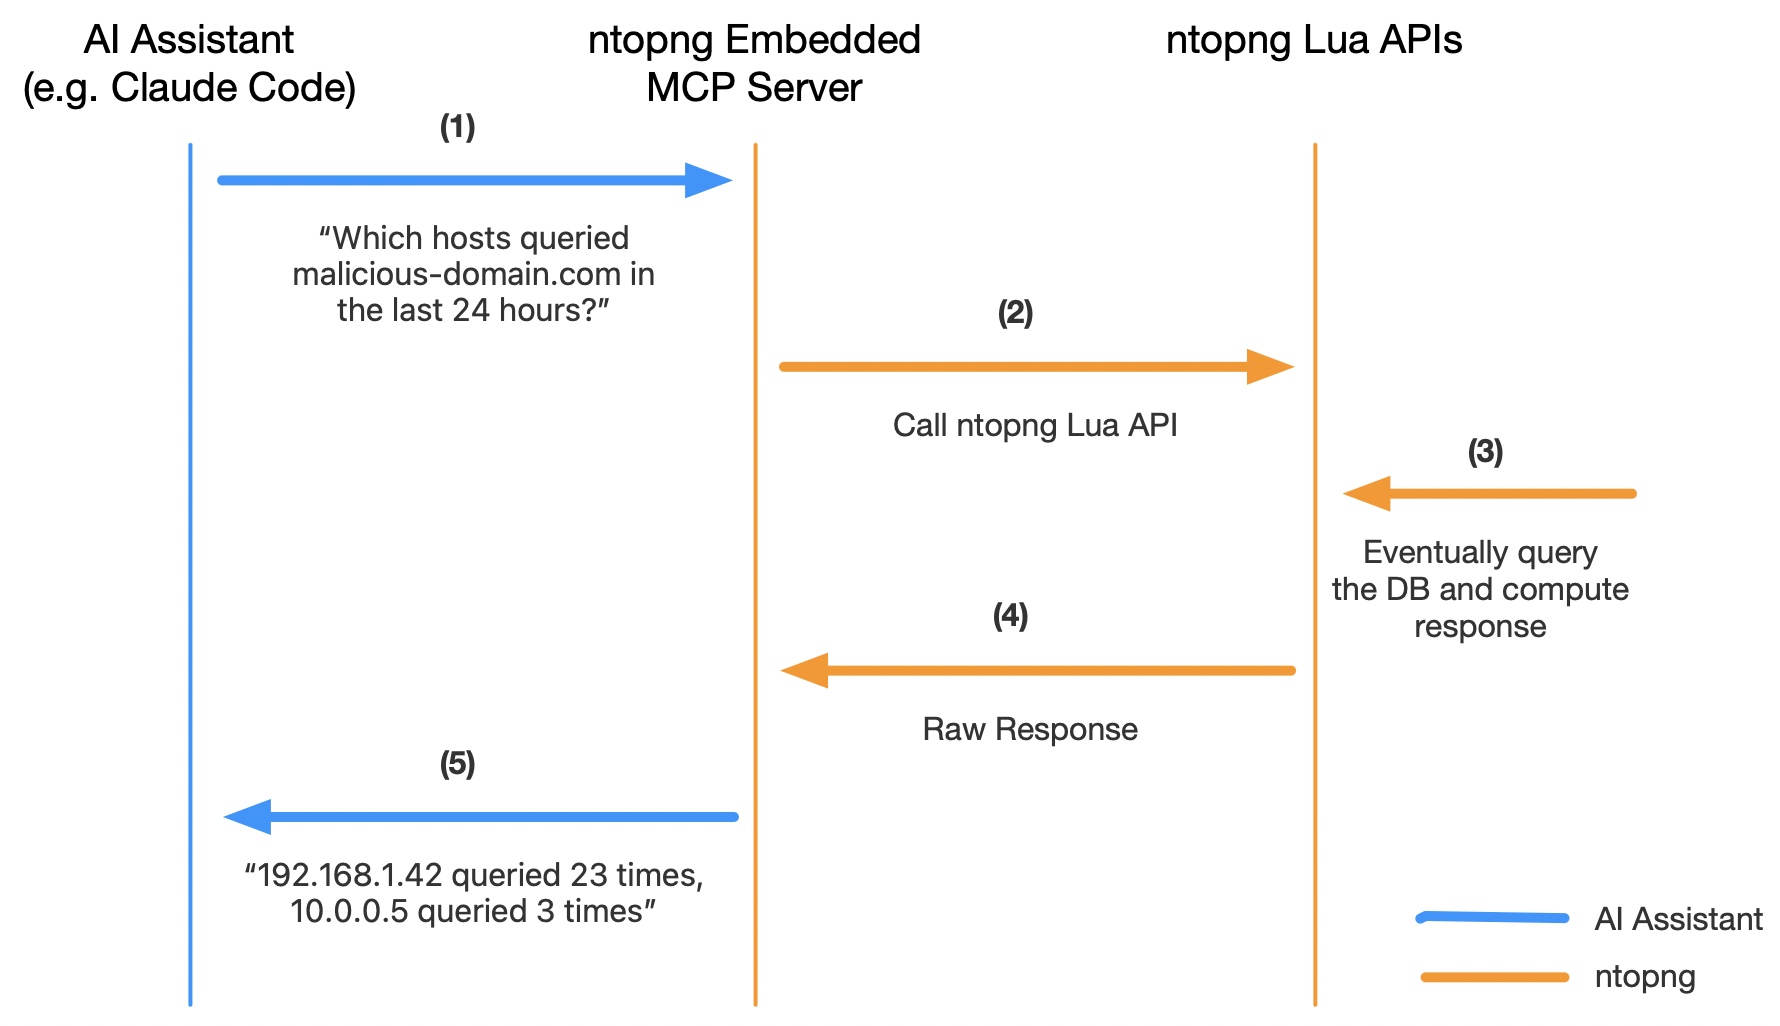
Scenario: Your SIEM flagged unusual DNS queries to known malware C2 domains.
Analyst: “Which hosts queried malicious-domain.com in the last 24 hours?”
Claude:
- Calls
query → ClickHouse: SELECT src_ip, count() FROM flows WHERE L7_PROTO='dns' AND DOMAIN_NAME LIKE '%malicious%' AND FIRST_SEEN >= now() - INTERVAL 1 day GROUP BY src_ip - Returns: “192.168.1.42 queried 23 times, 10.0.0.5 queried 3 times”
- Analyst checks: “Get live stats on 192.168.1.42”
- Claude:
get_host_info -> Shows active server ports, recent flows, alert history - Result: Analyst has full context to decide: block host, isolate, or monitor
Time to decision: sub 1 minutes (vs. 10-15 min of manual investigation)
Case 2: Detect Data Exfiltration
Scenario: Large data transfer to external IP during off-hours.
Analyst: “Show me the top 5 outbound flows to non-local IPs in the last hour by bytes transferred”
Claude:
- Calls
query -> SELECT src_ip, dst_ip, dst_port, SUM(bytes) FROM flows WHERE dst_ip NOT IN (192.168.0.0/16, ...) AND FIRST_SEEN >= now() - INTERVAL 1 hour GROUP BY src_ip, dst_ip ORDER BY SUM(bytes) DESC LIMIT 5 - Returns: 10.0.0.8 → 203.0.113.50:443 = 500 MB (suspicious)
- Analyst: “What’s the protocol and domain for that flow?”
- Claude: “HTTPS to known CDN (Akamai). Likely legitimate unless that host shouldn’t access external”
- Analyst: “Add alert exclusion for that host-domain pair”
- Claude: Calls
add_domain_alert_exclusion → Suppresses future alerts for that flow
Outcome: Differentiate data exfil from legitimate cloud access in 3 minutes
Case 3: Track Botnet Command & Control
Scenario: Multiple hosts contacting same external IP on non-standard port.
Analyst: “Find all hosts contacting 45.142.222.50:8443 in the last 7 days”
Claude:
- Calls
query → SELECT DISTINCT src_ip, dst_ip, dst_port, COUNT() as flow_count, SUM(bytes) FROM flows WHERE dst_ip='45.142.222.50' AND dst_port=8443 AND FIRST_SEEN >= now() - INTERVAL 7 day GROUP BY src_ip - Returns: 12 hosts found (192.168.1.x, 10.0.0.x ranges)
- Analyst: “Get asset info on each host”
- Claude: For each IP → OS, device model, first/last seen, network segment
- Analyst: Correlates with alerting system → Confirms C2 beaconing
- Decides: Quarantine all 12 hosts, capture PCAP for forensics
Outcome: Lateral movement detection and containment in 5 minutes
Use Cases: Network Managers
Case 1: Identify Bandwidth Hogs
Scenario: Interface utilization at 80%. Need to find culprits.
Manager: “Show me the top 10 conversations consuming bandwidth on eth0 in the last 6 hours”
Claude:
- Calls
query → SELECT src_ip, dst_ip, L7_PROTO, SUM(bytes) FROM flows WHERE src_port != 0 AND FIRST_SEEN >= now() - INTERVAL 6 hour GROUP BY src_ip, dst_ip, L7_PROTO ORDER BY SUM(bytes) DESC LIMIT 10 - Returns table: Server-to-Server (HTTP/S), Backup Traffic (SMB), Video Streaming (QUIC)
- Manager: “Which of these are scheduled vs. anomalous?”
- Claude: Suggests normal patterns (backup 2–4 AM, traffic during business hours)
- Manager: Decides to upgrade backup schedule, monitor video traffic
Outcome: Data-driven capacity planning decision in 10 minutes
Case 2: Monitor VPN Concentrator Health
Scenario: Remote workers report slow VPN connections.
Manager: “Get SNMP stats on VPN-gateway-01 (192.168.255.1)”
Claude:
- Calls
get_snmp_device_info → Shows all interfaces, CPU 45%, Memory 78%, Link status - Manager: “Which interface has highest traffic?”
- Claude: eth1 (WAN): 500 Mbps inbound, 200 Mbps outbound
- Manager: “How many active VPN sessions connected right now?”
- Claude: Calls
query → SELECT COUNT(DISTINCT src_ip) FROM flows WHERE L4_PROTO='UDP' AND dst_port=1194 - Result: 250 active sessions (expected max 200)
- Manager: Triggers capacity alert, schedules gateway upgrade
Outcome: Identify bottleneck, justify capacity expansion in 5 minutes
Case 3: Verify Monitoring Coverage
Scenario: Need to confirm all critical devices are monitored.
Manager: “List all SNMP devices we’re monitoring”
Claude:
- Calls
list_snmp_devices → Returns 47 devices - Manager: “Which ones haven’t reported in the last hour?”
- Claude: Identifies 3 unreachable devices
- Manager: “Get asset info on those IPs”
- Claude: Returns OS, model, last known config
- Manager: Checks firewall rules, restarts those devices, confirms reachability
Outcome: Proactive monitoring gap discovery, 3-minute fix
Read vs. Write Tools
Read-only (safe to call): query, chart, describe_table, get_host_info, get_asset_info, list_snmp_devices, get_live_flows_for_host, get_live_flows_summary, search_docs
Write (requires confirmation): add_host_alert_exclusion, add_domain_alert_exclusion, add_certificate_alert_exclusion, add_active_monitoring_script, create_ai_policy. Claude will always ask before executing.
Troubleshooting
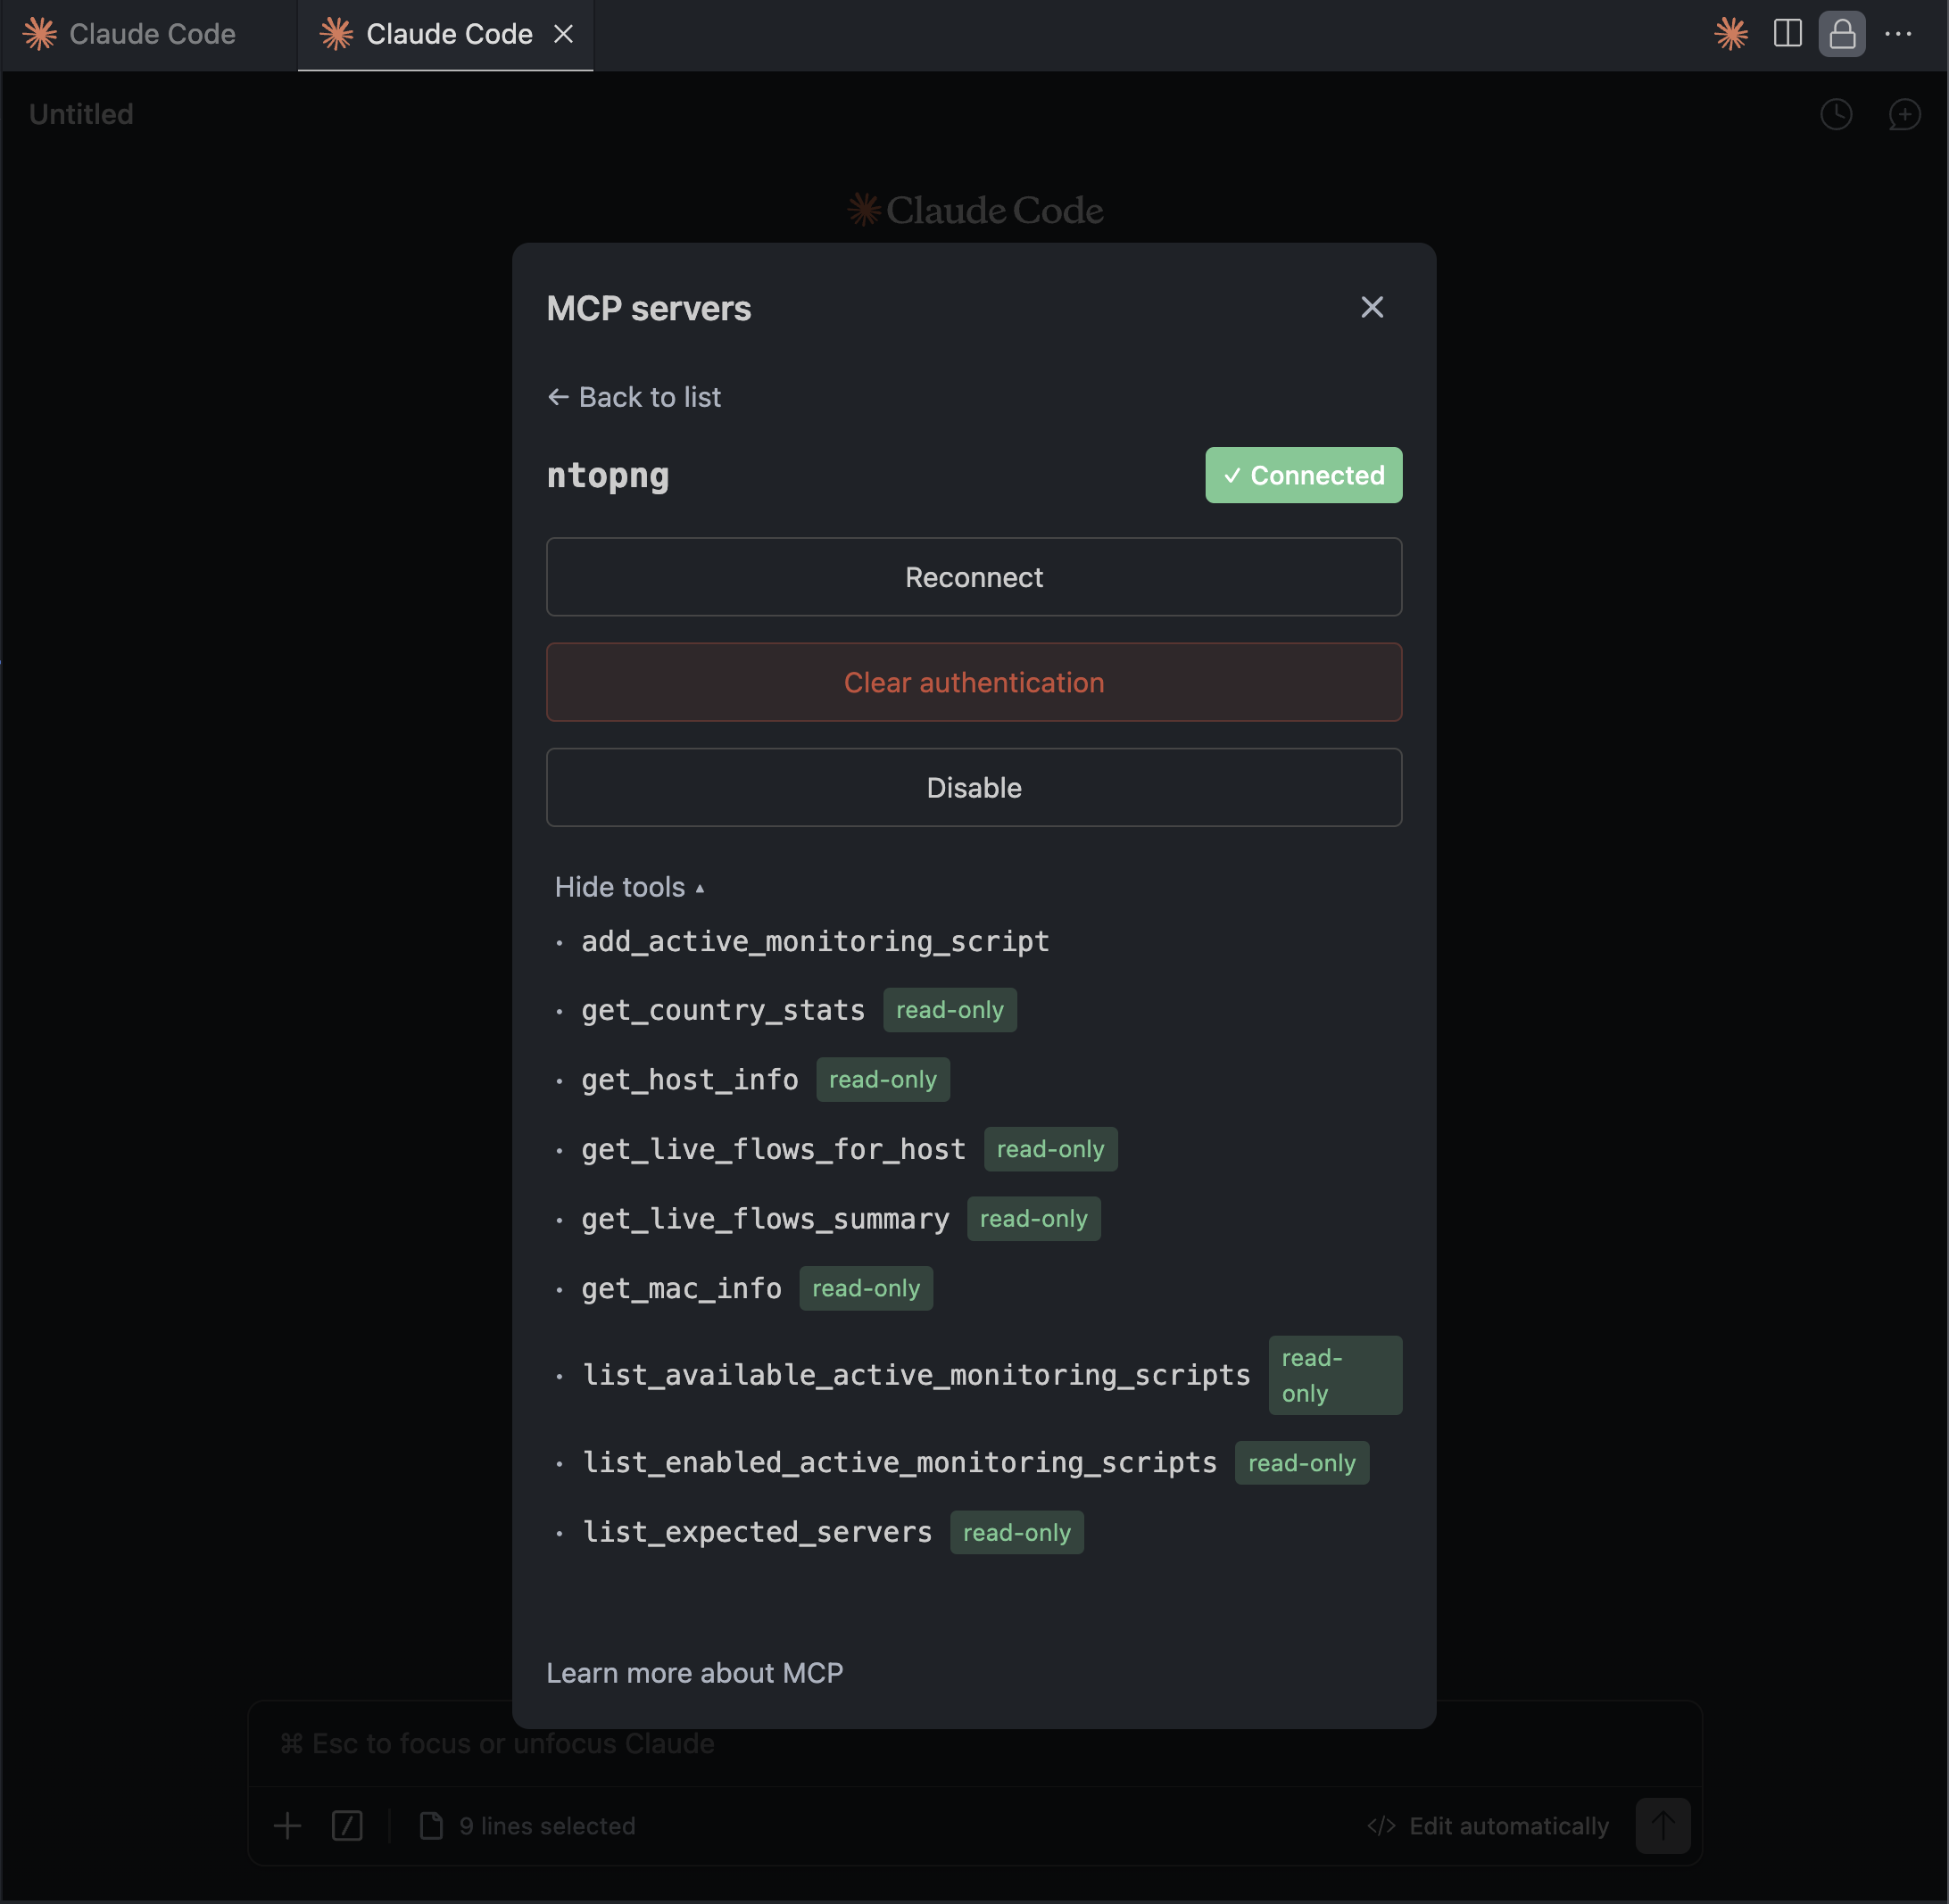
No tools available (ntopng pro LLM tools not available)
Cause: Running ntopng Community edition (Pro module missing).
Fix: Use free community tools (9 tools listed above). Or upgrade to Enterprise for full toolset.
ClickHouse queries fail (table not found)
Cause: ClickHouse export not enabled.
Empty response from get_host_info
Cause: Host aged out of in-memory cache.
Fix: Use query tool for historical data. Use get_asset_info for persistent device inventory.
FAQ
Is MCP free?
Yes. Community tools and MCP protocol are free. Pro/Enterprise customers access all 20 tools.
Can I use this with remote ntopng?
Yes. Provide full URL and ensure network connectivity. Use HTTPS for security.
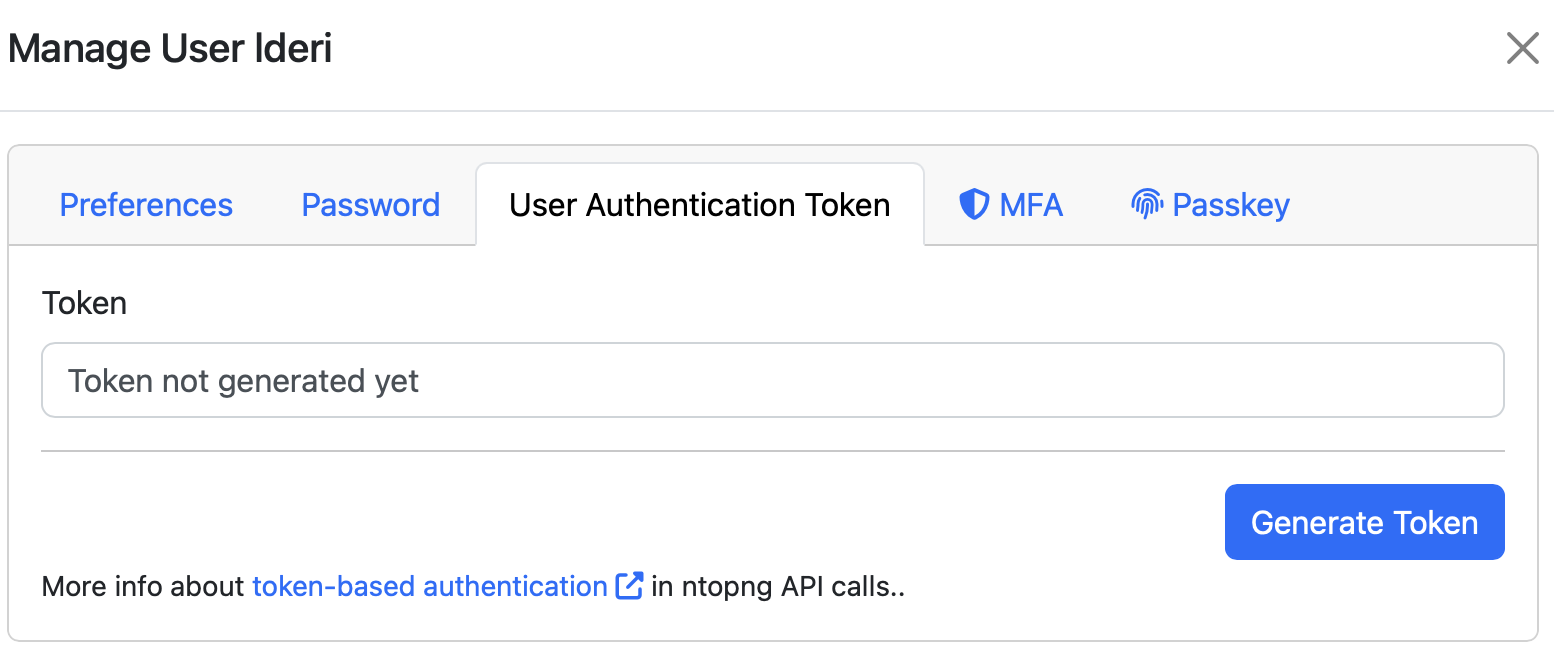
What if I lose my token?
Generate a new one in Settings → Generate Token.
Can multiple users share one token?
Yes, but use separate tokens per user for audit trail accountability.
Does MCP work with Cursor or other clients?
Yes. MCP is a standard protocol. Configure the same HTTP endpoint in Cursor, VS Code, or custom Python agents.
What data does Claude see?
Only what tools return: flow query results (IPs, ports, bytes, protocols), host stats (CPU, memory, interface speeds), device inventory, alert configs. No raw packet data.
Enjoy and contribute to the MCP tools list !