A few months ago, with ntopng 3.8, we introduced support for continuous traffic recording, that allows you to drill down historical data from the timeseries level up to raw packets. This is useful when troubleshooting a network issue or analysing a security event, by combining traffic visibility with raw traffic analysis.
In order to record raw data ntopng leverages on the n2disk application, which is able to capture full-sized network packets at wire-speed up to 100 Gbps from a live network interface, and write them into pcap files without any packet loss. In a previous post we’ve seen how to build a (cheap) continuous packet recorder, providing instructions for configuring the storage to be able to match the expected performance and size it to get the desired data retention.
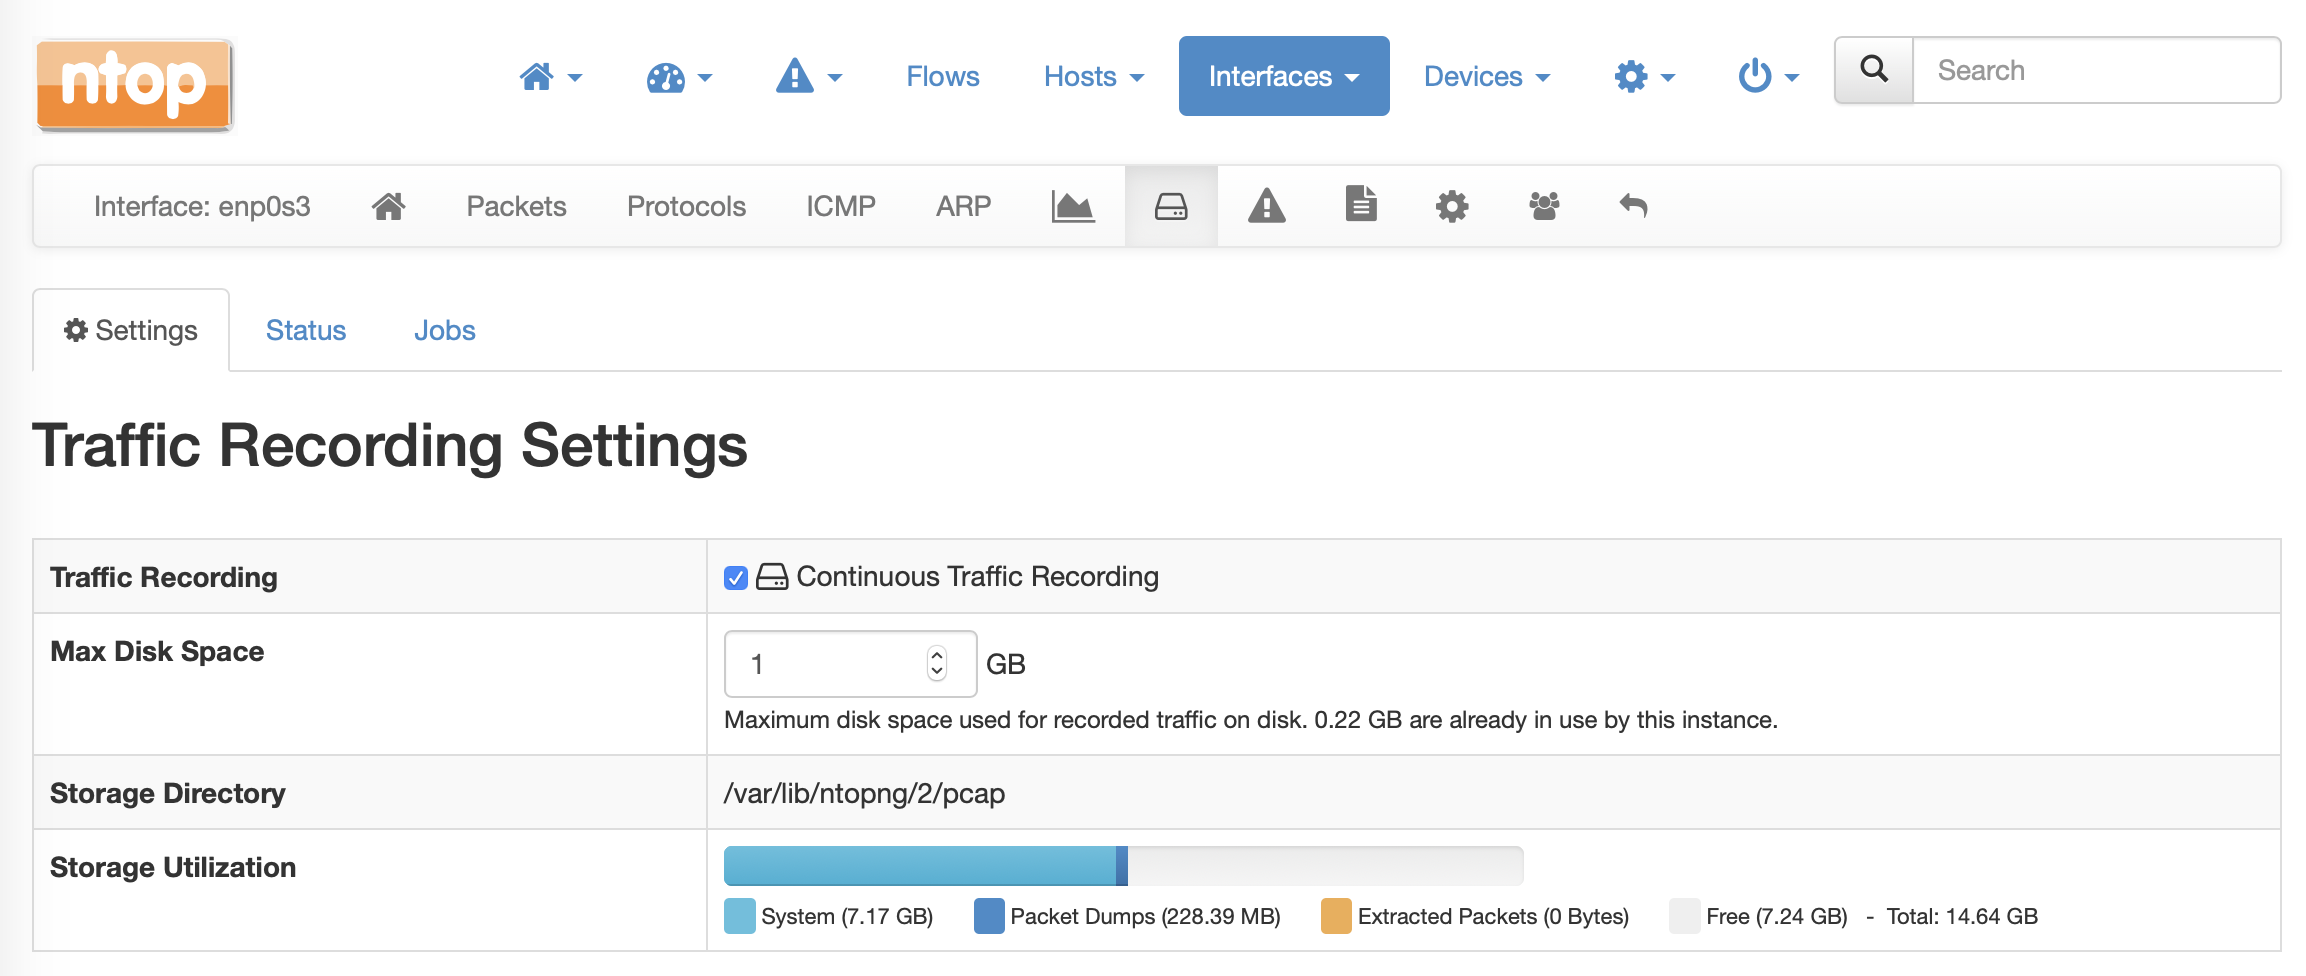
Enabling traffic recording in ntopng is really straightforward and requires just a few clicks in the Interface -> (Recording) page as you can see in the screenshot below and explained in the User’s Guide, this as long as you need to process traffic at low/mid rates (up to 1-2 Gbps) and the performance provided by commodity network adapters using standard drivers are fine. In this configuration, both ntopng and n2disk are able to capture traffic from the same interface by leveraging on the linux kernel for receiving a copy of the traffic.
However, if you need to process traffic at high rates (10/40Gbit and above), you should consider using capture technologies able to deliver higher performance, like PF_RING ZC for Intel adapters or specialised FPGA adapters. As both PF_RING ZC and FPGA adapters are based on kernel bypass technologies, the drawback is that they do not allow you to capture the same traffic from multiple applications at the same time: this means that you cannot run ntopng and n2disk at the same time on the same interface.
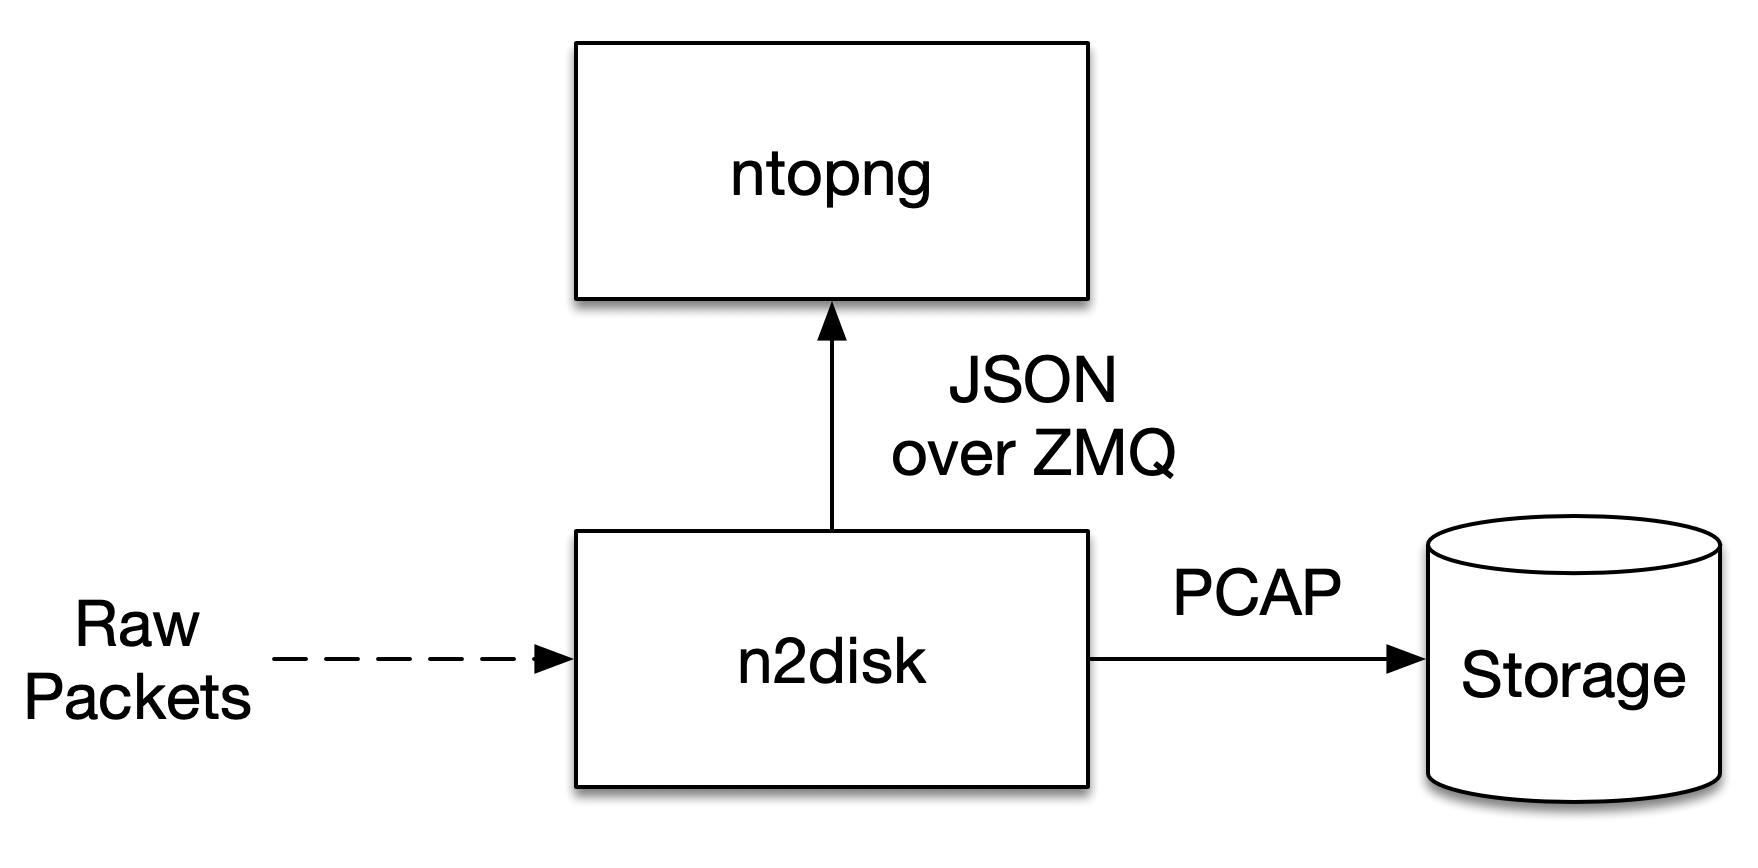
In order to overcome this limitation, n2disk has been extended with a new feature: the ability to export flow metadata to ntopng, similar to what nProbe does. In fact, n2disk can be configured to capture raw packets, dump PCAP data to disk, and export flow metadata through ZMQ to ntopng at the same time. n2disk can do this at high rates thanks to the internal multithreaded architecture and by leveraging on the optimized PF_RING FT flow processing library providing support for high-speed Layer 7 flow classification.
The n2disk service can be configured creating a configuration file /etc/n2disk/n2disk-<instance name>.conf and is controlled using the systemctl utility on operating systems based on the systemd service manager. For details about the n2disk configuration please refer to the n2disk User’s Guide. In order to configure n2disk to export flow metadata, a ZMQ endpoint should be added to the configuration file by using the –zmq <endpoint> and –zmq-export-flows options.
It is a good practice to run n2disk using the ntopng user (-u <user> option) in order to make sure that the ntopng process is able to access the PCAP data recorded by n2disk and run traffic extractions. Such user is created when installing the packaged version available at http://packages.ntop.org.
Please find below a sample configuration, let’s call it /etc/n2disk/n2disk-nt0.conf, which is tied to the n2disk service instance n2disk@nt0 according to the configuration file suffix. In this case n2disk is aggregating traffic from 2 ports of a Napatech adapter, building index and timeline, and exporting flow information through ZMQ.
--interface=nt:0,1
--dump-directory=/storage/n2disk/pcap
--timeline-dir=/storage/n2disk/timeline
--disk-limit=80%
--max-file-len=1000
--buffer-len=4000
--max-file-duration=60
--index
--snaplen=1536
--writer-cpu-affinity=0
--reader-cpu-affinity=1
--compressor-cpu-affinity=2,3,4,5
--index-on-compressor-threads
-u=ntopng
--zmq=tcp://127.0.0.1:5556
--zmq-probe-mode
--zmq-export-flows
This n2disk service can be started with systemctl as below. As it is likely you want to run the service after a reboot, you also need to enable it.
systemctl enable n2disk@nt0
systemctl start n2disk@nt0
In order to process flow metadata coming from n2disk to ntopng, you need to add a ZMQ collector interface in the ntopng configuration file /etc/ntopng/ntopng.conf. Please find below an example of a basic ntopng configuration with a ZMQ endpoint in collector mode:
-i=tcp://*:5556c
This ntopng service can be (re)started with systemctl as below:
systemctl restart ntopng
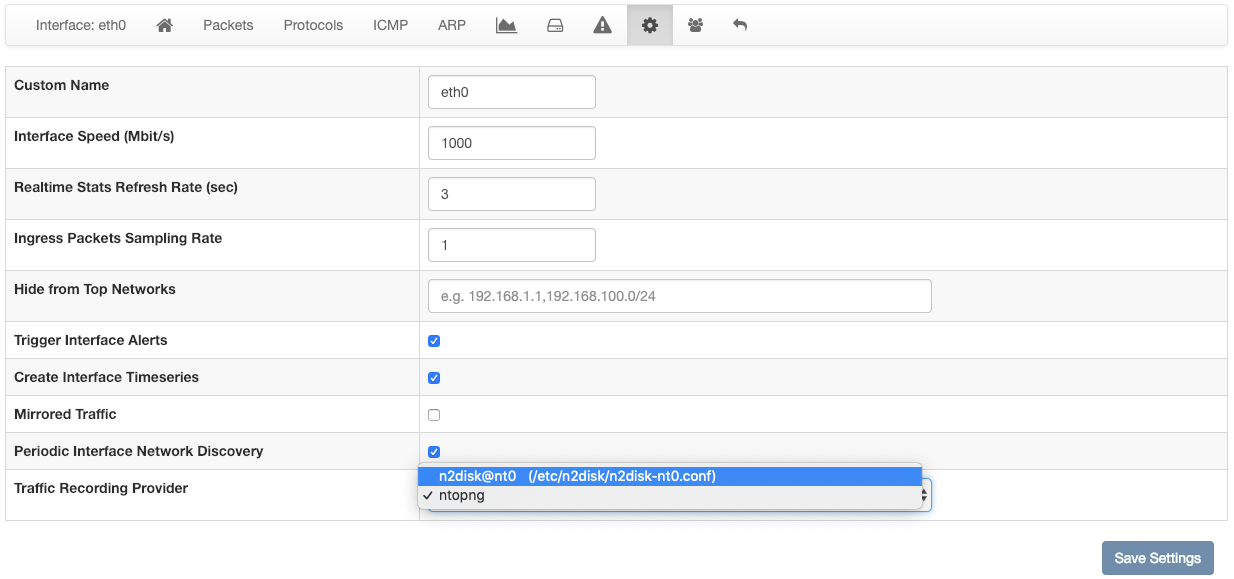
As last step, you need to set the n2disk instance as external PCAP source in ntopng in the Interface -> Settings page, to be able to check the n2disk service status and drill down up to the packet level in ntopng. In order to do this, you need to select the proper instance from the Traffic Recording Provider dropdown in the collector interface settings page as shown in the screenshot below.
At this point it’s all set and you should be able to drill-down from charts and activities, to flows and packets, while processing 40/100 Gbps! In fact we’ve been able to process full 100 Gbps using “bulk” capture mode (n2disk is able to work in this mode when used in combination with Napatech or Fiberblaze adapters) and multithreaded dump writing to 8 NVMe disks in parallel on an Intel Xeon Gold 12 cores 3Ghz, while sending flow metadata to ntopng. Please take a look at the Continuous Traffic Recording section to learn more about the integration of ntopng with n2disk.
Enjoy!