For a while we have investigated how to combine system and network monitoring in a simple and effective way. In 2014 we have done a few experiments with Sysdig, and recently thanks to eBPF we have revamped our work to exploit this technology as well to be able to monitoring containerised environments. Months ago we have shown how to detect, count and measure the network activity which is taking place at a certain host just by leveraging certain functionalities of the linux operating system, without even looking at the traffic packets. Our seminal work has been published in the paper ” Combining System Visibility and Security Using eBPF“. Since then, we have given the talk “Merging System and Network Monitoring with BPF” at FOSDEM 2019 and co-authored the article “IT Monitoring in the Era of Containers: Tapping into eBPF Observability” with our friends at InfluxDB, among with other activities.
In this post, we would like to show you how to get started with containers and network visibility, that is, what tools you need to end up in having new fancy metrics delivered straight to your instance of InfluxDB, metrics which will support you in observing, understanding and troubleshooting containerized environments. In essence this is a guide that highlights what you need to install and run in order to combine system and network monitoring.
The Tools
Three lightweight tools are needed, namely:
nprobe-agent, formerly known as nProbe Mini, a small application which is responsible for performing system introspection. If you prefer a pure opensource solution (yet more limited) you can have a look at libebpfflow.ntopng, a visualization tool which receives introspected data from thenprobe-agent, and slices and dices it for producing metrics and sending them to InfluxDB. This article assumes that you are using the latest ntopng version available at the date of this blog post.InfluxDB, the popular timeseries database to store metrics generated byntopng.
The top-right part of the following picture shows graphically how they work together. The other parts of the picture show also how they relate to the overall ntop visibility ecosystem.
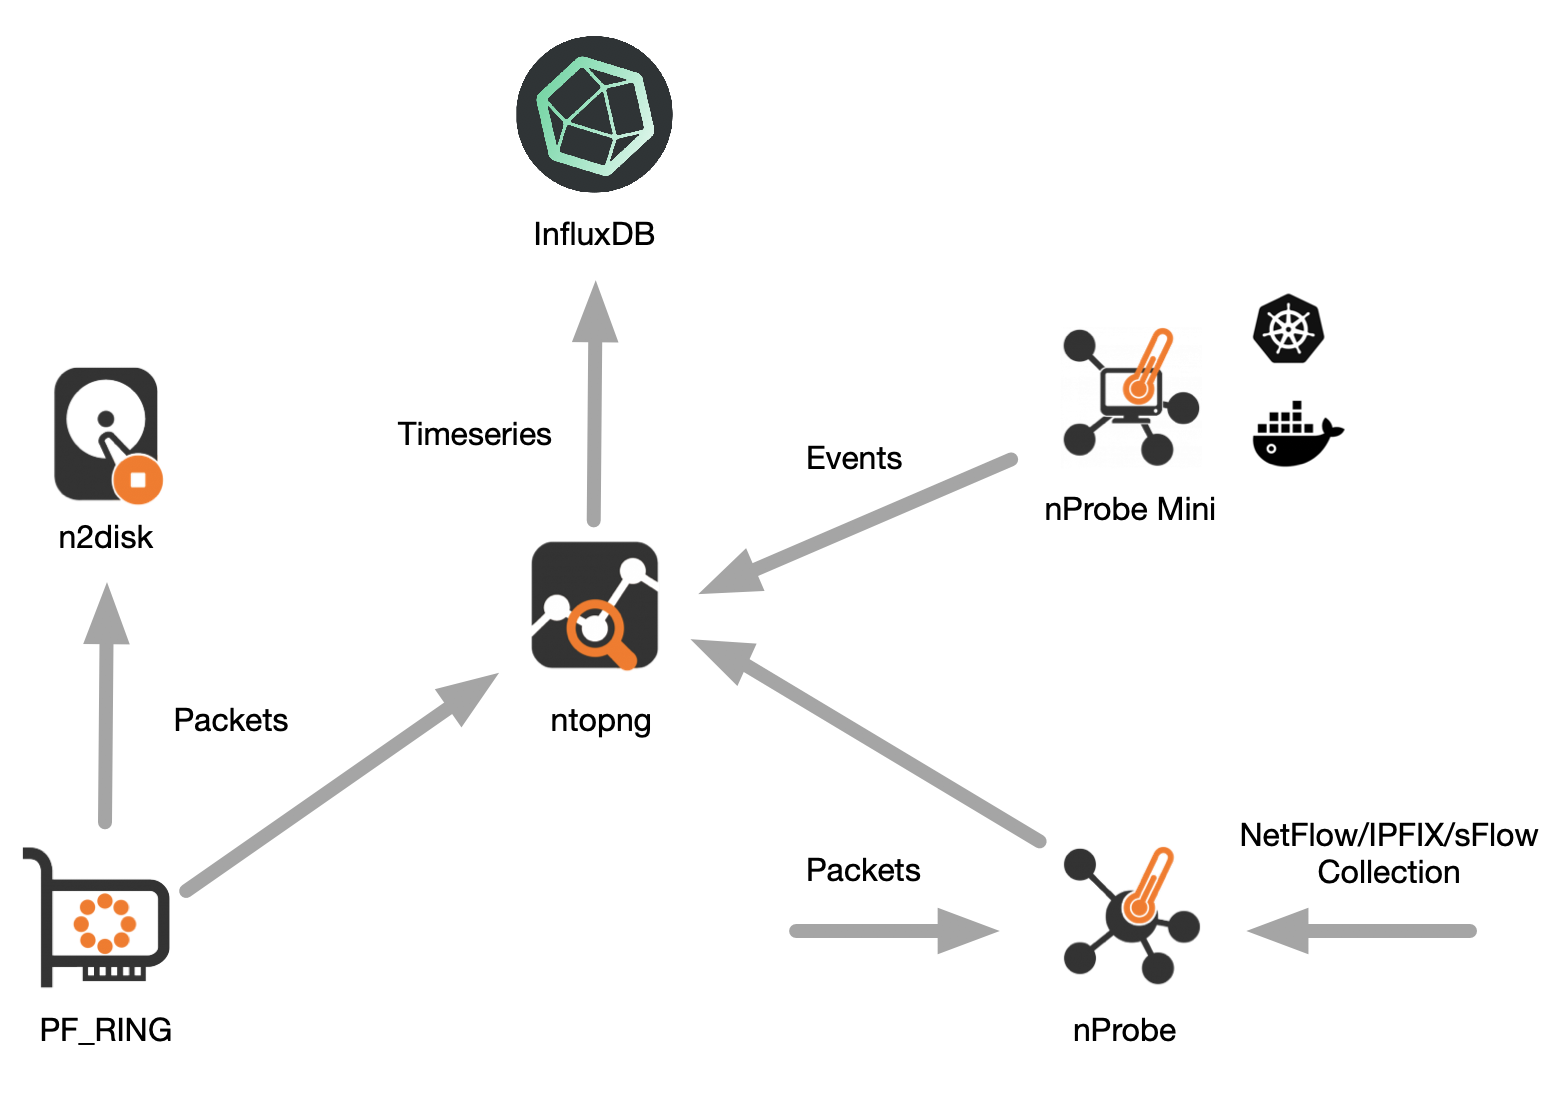
The tools can run on the same host or on three different and physically independent hosts, it does not matter as they all communicate each other using the network. For simplicity, in the remainder of this post we assume the tools are installed and run on the same host.
Installation
nprobe-agent and ntopng are distributed by ntop. Follow the instructions at https://packages.ntop.org to add the ntop repositories so that you can use the package manager of your distro to do the installation, which is a one-liner
$ sudo apt-get -y install nprobe-agent ntopng
InfluxDB installation instructions are available at https://docs.influxdata.com/influxdb/latest/introduction/installation/.
Configuration
To configure nprobe-agent copy its default configuration file into /etc/nprobe-agent/nprobe-agent.conf
$ sudo cp /etc/nprobe-agent/nprobe-agent.conf.example /etc/nprobe-agent/nprobe-agent.conf
The default configuration file contains a single -z=tcp://127.0.0.1:1234c which instructs nprobe-agent to export introspected data on localhost port 1234. As we want ntopng to consume such data, we have to add line -i=tcp://*:1234c to the ntopng configuration file /etc/ntopng/ntopng.conf so it will listen for incoming data on port 1234.
Now that the configurations are done, we can safely start our tools as follows
$ systemctl restart ntopng
$ systemctl restart nprobe-agent
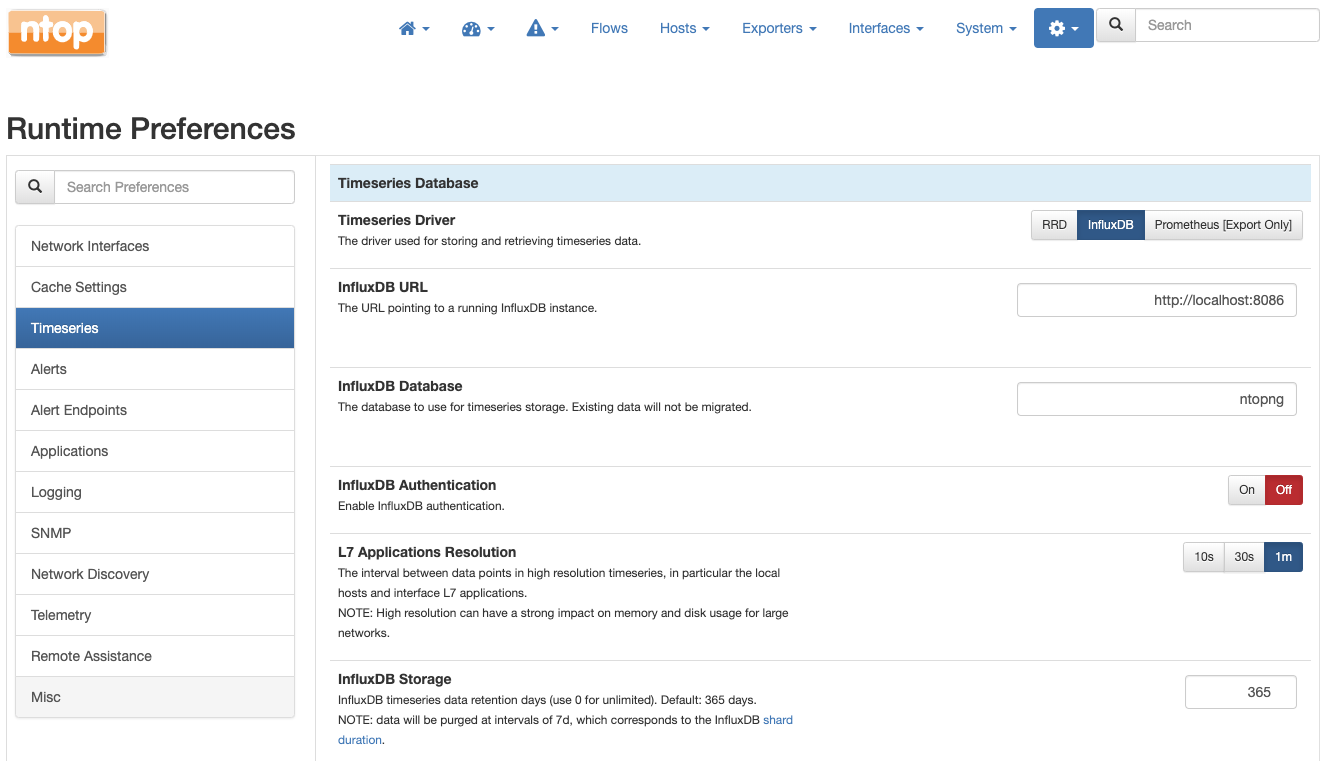
The final step is to tell ntopng to export metrics to InfluxDB, which basically consists in changing a preference as described in the documentation
Getting the licenses
nprobe-agent requires a license to work. ntopng does not require a license but you may want to consider its Professional or Enterprise versions for a richer set of features. Similarly, InfluxDB works without license but an Enterprise version is featured as well.
Metrics Metrics Metrics!
As all the pieces are working together now, you’ll start seeing all the network communications which are taking place on the monitored host, including information on users, processes, pods, containers, round trip times, and so on. We have already discussed how this rich information becomes available for browsing within ntopng in an earlier post System-Introspected Network and Container Visibility: A Quick Start Guide of this series.
In this post we would like to focus more on the metrics which are produced by ntopng and inserted into InfluxDB. Metrics which are not only produced by but also consumed from ntopng. Indeed, ntopng transparently query InfluxDB to produce any of the charts you’ll see when browsing its graphical user interface.
Wait, but what if you already have your dashboarding solution such as Grafana or Chronograf in place? Well, this is perfect and it is going to work seamlessly. You don’t have to stick with the ntopng graphical user interface. You are free to use your favourite solution just by connecting it to InfluxDB which safely stores metrics and will happily serves them as well – InfluxDB implements out-of-the-box datasource plugins for Grafana and Chronograf.
Let’s go back to the ntopng graphical user interface for a moment to have a look at some charts produced by (transparently) querying InfluxDB metrics.
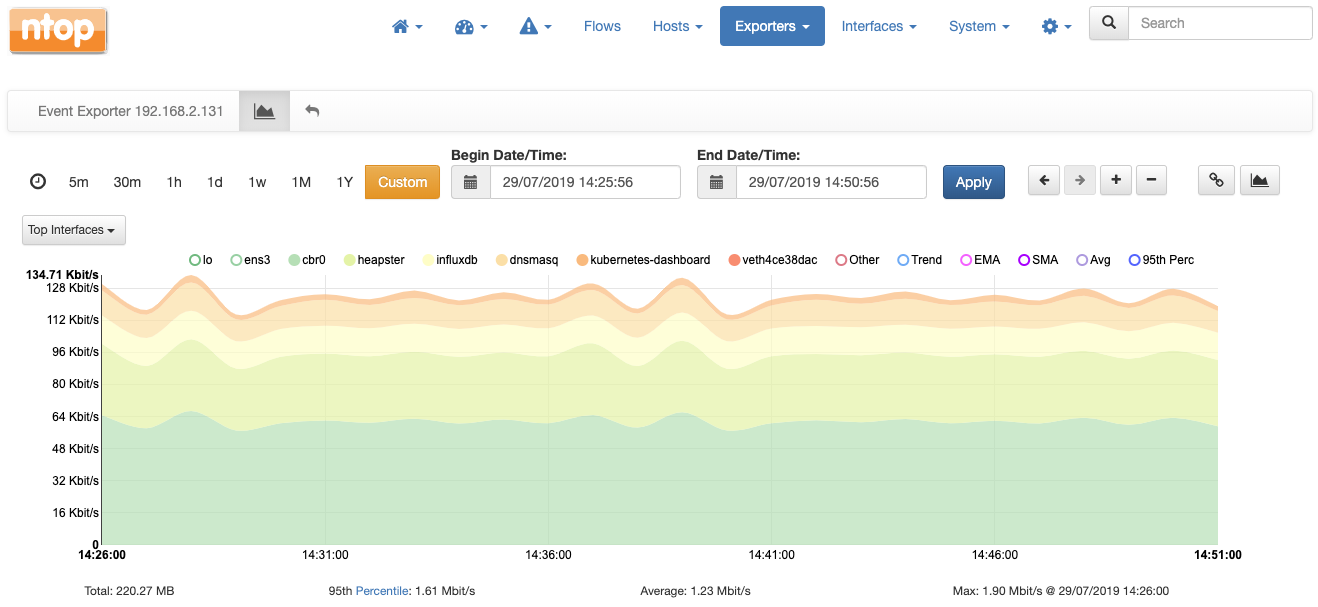
The following is a stacked chart of all the network interfaces traffic on the host. Interfaces are physical as well as virtual (see for example the veth… which stands for virtual ethernet…).
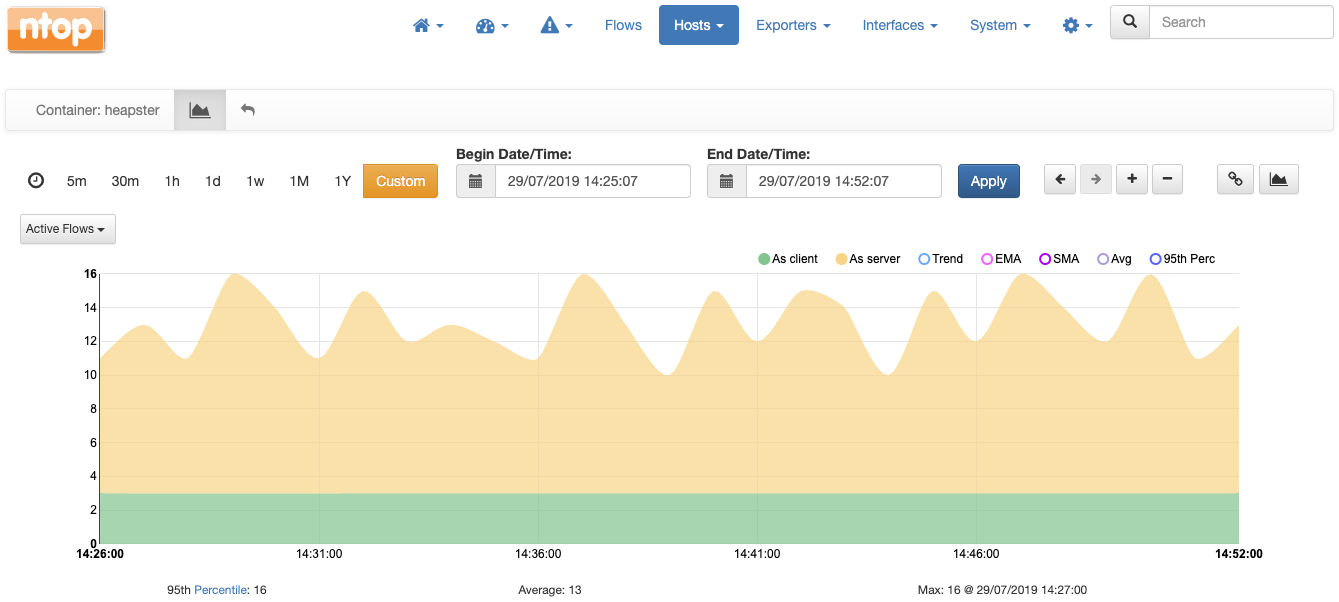
This is a chart which tells the number of active flows (i.e., network communications) active at a certain container (named heapster) over time, both as client and as server.
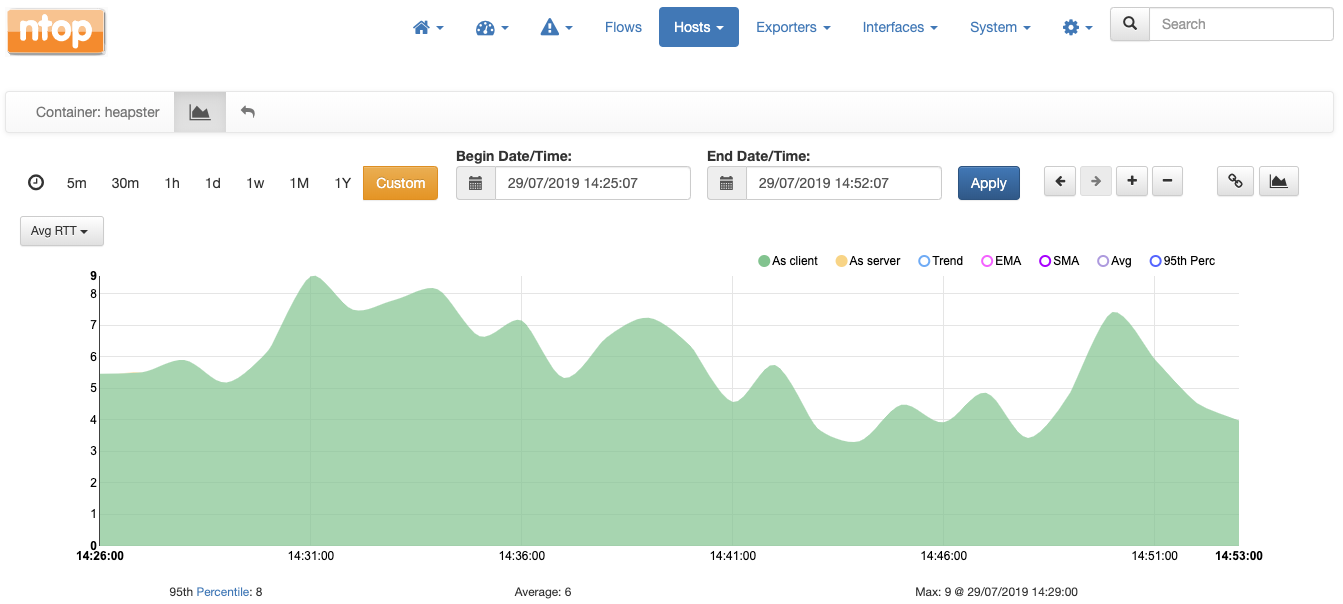
For the same heapster container it is possible to chart the average round trip time in milliseconds over time.
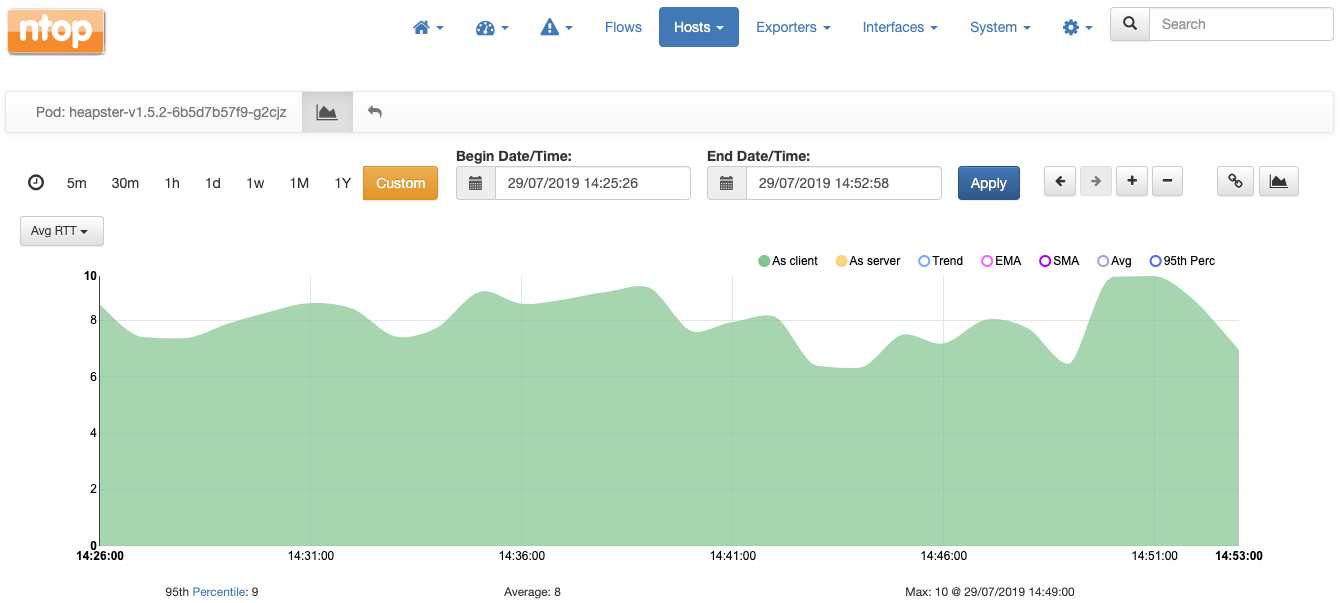
Charts are also available at the level of pod, where values are averages of all the containers of the pod. For example, this is the chart with the average round trip time of pod heapster:
Again, all the charts shown above can be obtained with any other dashboarding solution, it is absolutely not necessary to use ntopng.
Metrics in Detail
Let’s have a closer look at the metrics pushed by ntopng into InfluxDB. An exhaustive list of metrics is available here. With reference to the container visibility, it is worth mentioning the following:
- Number of flows per Container and POD
- RTT/RTT-Variance per Container and POD
- Number of containers per POD
Once in InfluxDB, each metric becomes a timeseries as its values are written into the database periodically. In the remainder of this post we discuss the details of the metrics and how they are stored in InfluxDB.
Name
All metrics are identified with a name. This name is what is also referred to as measurement in the InfluxDB parlance. The convention <prefix>:<suffix> is used by ntopng for metric names:
<prefix>is the subject of the metric, e.g., an host a container, or an interface<suffix>is what the metric represents, e.g., the traffic, the round trip time or the number of flows.
Examples of names are:
pod:rttpod:num_flowscontainer:num_flowshost:ndpi
Tags
Each metric has one or more tags associated. Tags are used to filter a metric as explained here. ntopng uses tags to enrich metrics with the name or the identifier of an interface, the IP address of a host, the identifier of a pod or container, and so on.
Examples of tags are:
ifid=0subnet=192.168.2.0/24container=89b0acbdba4bpod=heapster-v1.5.2-6b5d7b57f9-g2cjz
Resolution
ntopng pushes each metric into InfluxDB at regular intervals of time, as low as 10 sec. Hence, each metric has a resolution associated. The higher the resolution, the shorter the regular interval of time the metric is pushed into InfluxDB. Resolution is configurable for certain metrics and is documented here.
Type
Metrics are of two types, namely gauges and counters.
- Counters are metrics which always increase in time, such as for example the traffic of a certain network interface.
- Gauges are metrics such as the number of active flows or active hosts at a certain point in time and can have any value without any constraint.
The documentation indicates the type of each metric generated.
Examples
Now that we have seen all the details behind the metrics, it’s time to use the influxdb cli influx to execute some queries to give a better idea of how easy it is to query and operate on metrics
Let’s connect to InfluxDB and select database ntopng:
$ influx -precision rfc3339
Connected to http://localhost:8086 version 1.7.4
InfluxDB shell version: 1.7.4
Enter an InfluxQL query
> use ntopng
Using database ntopng
>
To list all the measurements involving a container we can do
> show measurements with measurement =~ /^container*/
name: measurements
name
----
container:num_flows
container:rtt
container:rtt_variance
>
We have 3 measurements (3 metrics), one for the number of flows and two for the round trip time and its variance, respectively.
To select the 10 most recent metric values for container:num_flows we can do
> select * from "container:num_flows" order by time desc limit 10
name: container:num_flows
time as_client as_server container ifid
---- --------- --------- --------- ----
2019-07-29T15:42:00Z 1 11 f427db2c87ac 6
2019-07-29T15:42:00Z 1 0 0a7f0bfa1a2b 6
2019-07-29T15:42:00Z 0 2 7c983b788320 6
2019-07-29T15:42:00Z 4 48 4a32234f6c35 6
2019-07-29T15:42:00Z 2 0 ceaa16daddd5 6
2019-07-29T15:42:00Z 138 34 1edb6c16e3d2 6
2019-07-29T15:42:00Z 19 121 f1e6f2b128e9 6
2019-07-29T15:42:00Z 1 0 a2a9c82c759f 6
2019-07-29T15:42:00Z 3 12 8a74af30d974 6
2019-07-29T15:41:00Z 1 0 a2a9c82c759f 6
>
As we see, there are multiple containers. To filter results for a certain container we can use the container tag as follows
> select * from "container:num_flows" where "container" = '1edb6c16e3d2' order by time desc limit 10
name: container:num_flows
time as_client as_server container ifid
---- --------- --------- --------- ----
2019-07-29T15:44:00Z 136 24 1edb6c16e3d2 6
2019-07-29T15:43:00Z 142 40 1edb6c16e3d2 6
2019-07-29T15:42:00Z 138 34 1edb6c16e3d2 6
2019-07-29T15:41:00Z 142 28 1edb6c16e3d2 6
2019-07-29T15:40:00Z 140 21 1edb6c16e3d2 6
2019-07-29T15:39:00Z 139 38 1edb6c16e3d2 6
2019-07-29T15:38:00Z 136 23 1edb6c16e3d2 6
2019-07-29T15:37:00Z 132 36 1edb6c16e3d2 6
2019-07-29T15:36:00Z 137 21 1edb6c16e3d2 6
2019-07-29T15:35:00Z 143 26 1edb6c16e3d2 6
>
Now we believe we have given you the basics to start playing with InfluxDB and system introspection. Don’t forget to drop us an email or use our official github page for any question!
Enjoy!