ntopng
High-Speed Web-based Traffic Analysis and Flow Collection
ntopng is a network traffic probe that provides 360° Network visibility, with its ability to gather traffic information from traffic mirrors, NetFlow exporters, SNMP devices, Firewall logs, Intrusion Detection systems.
ntopng has been written in a portable way in order to virtually run on every Unix platform, including Linux, FreeBSD, pfSense, OPNsense, MacOS and on Windows as well. ntopng captures traffic from SPAN/mirror ports or TAP devices using libpcap or PF_RING (on Linux) for best performance. Or you can use it in combination with nProbe to collect NetFlow/sFlow from routers and switches, or nProbe Cento to analyze 100 Gbit links at full rate.
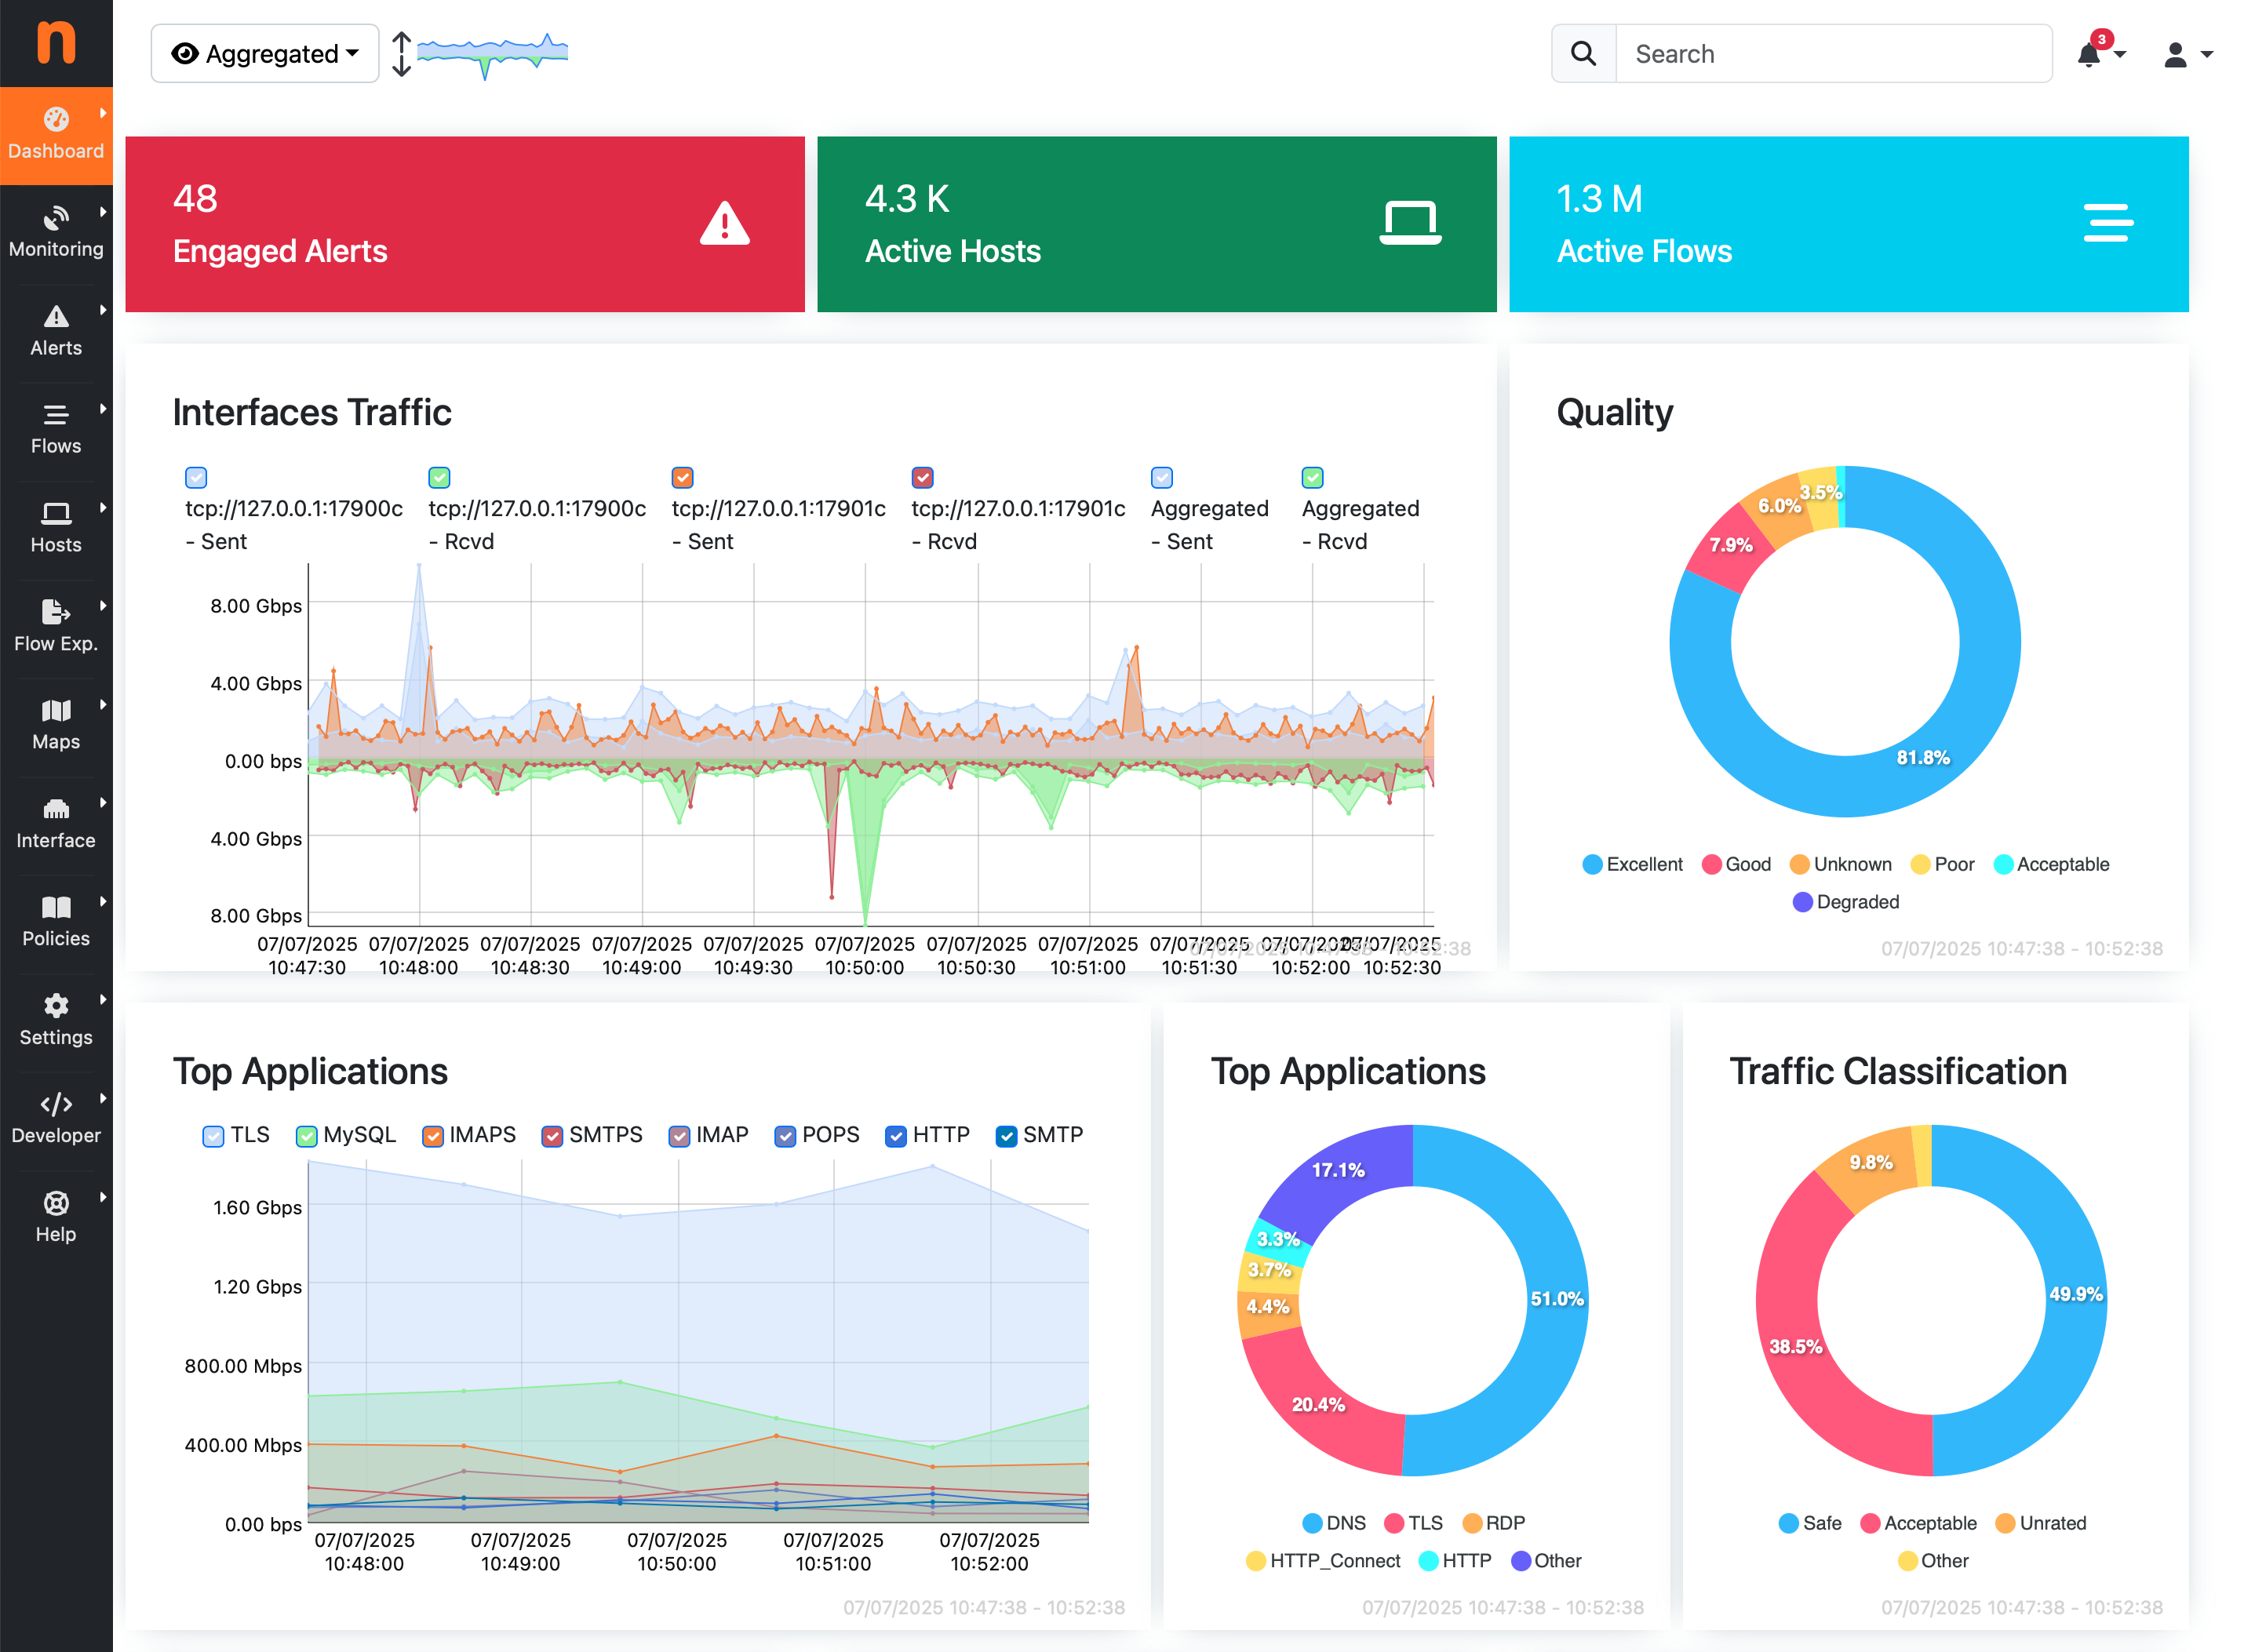
ntopng – yes, it’s all lowercase – provides a intuitive, encrypted web user interface for the exploration of realtime and historical traffic information.

at a glance
Key Features
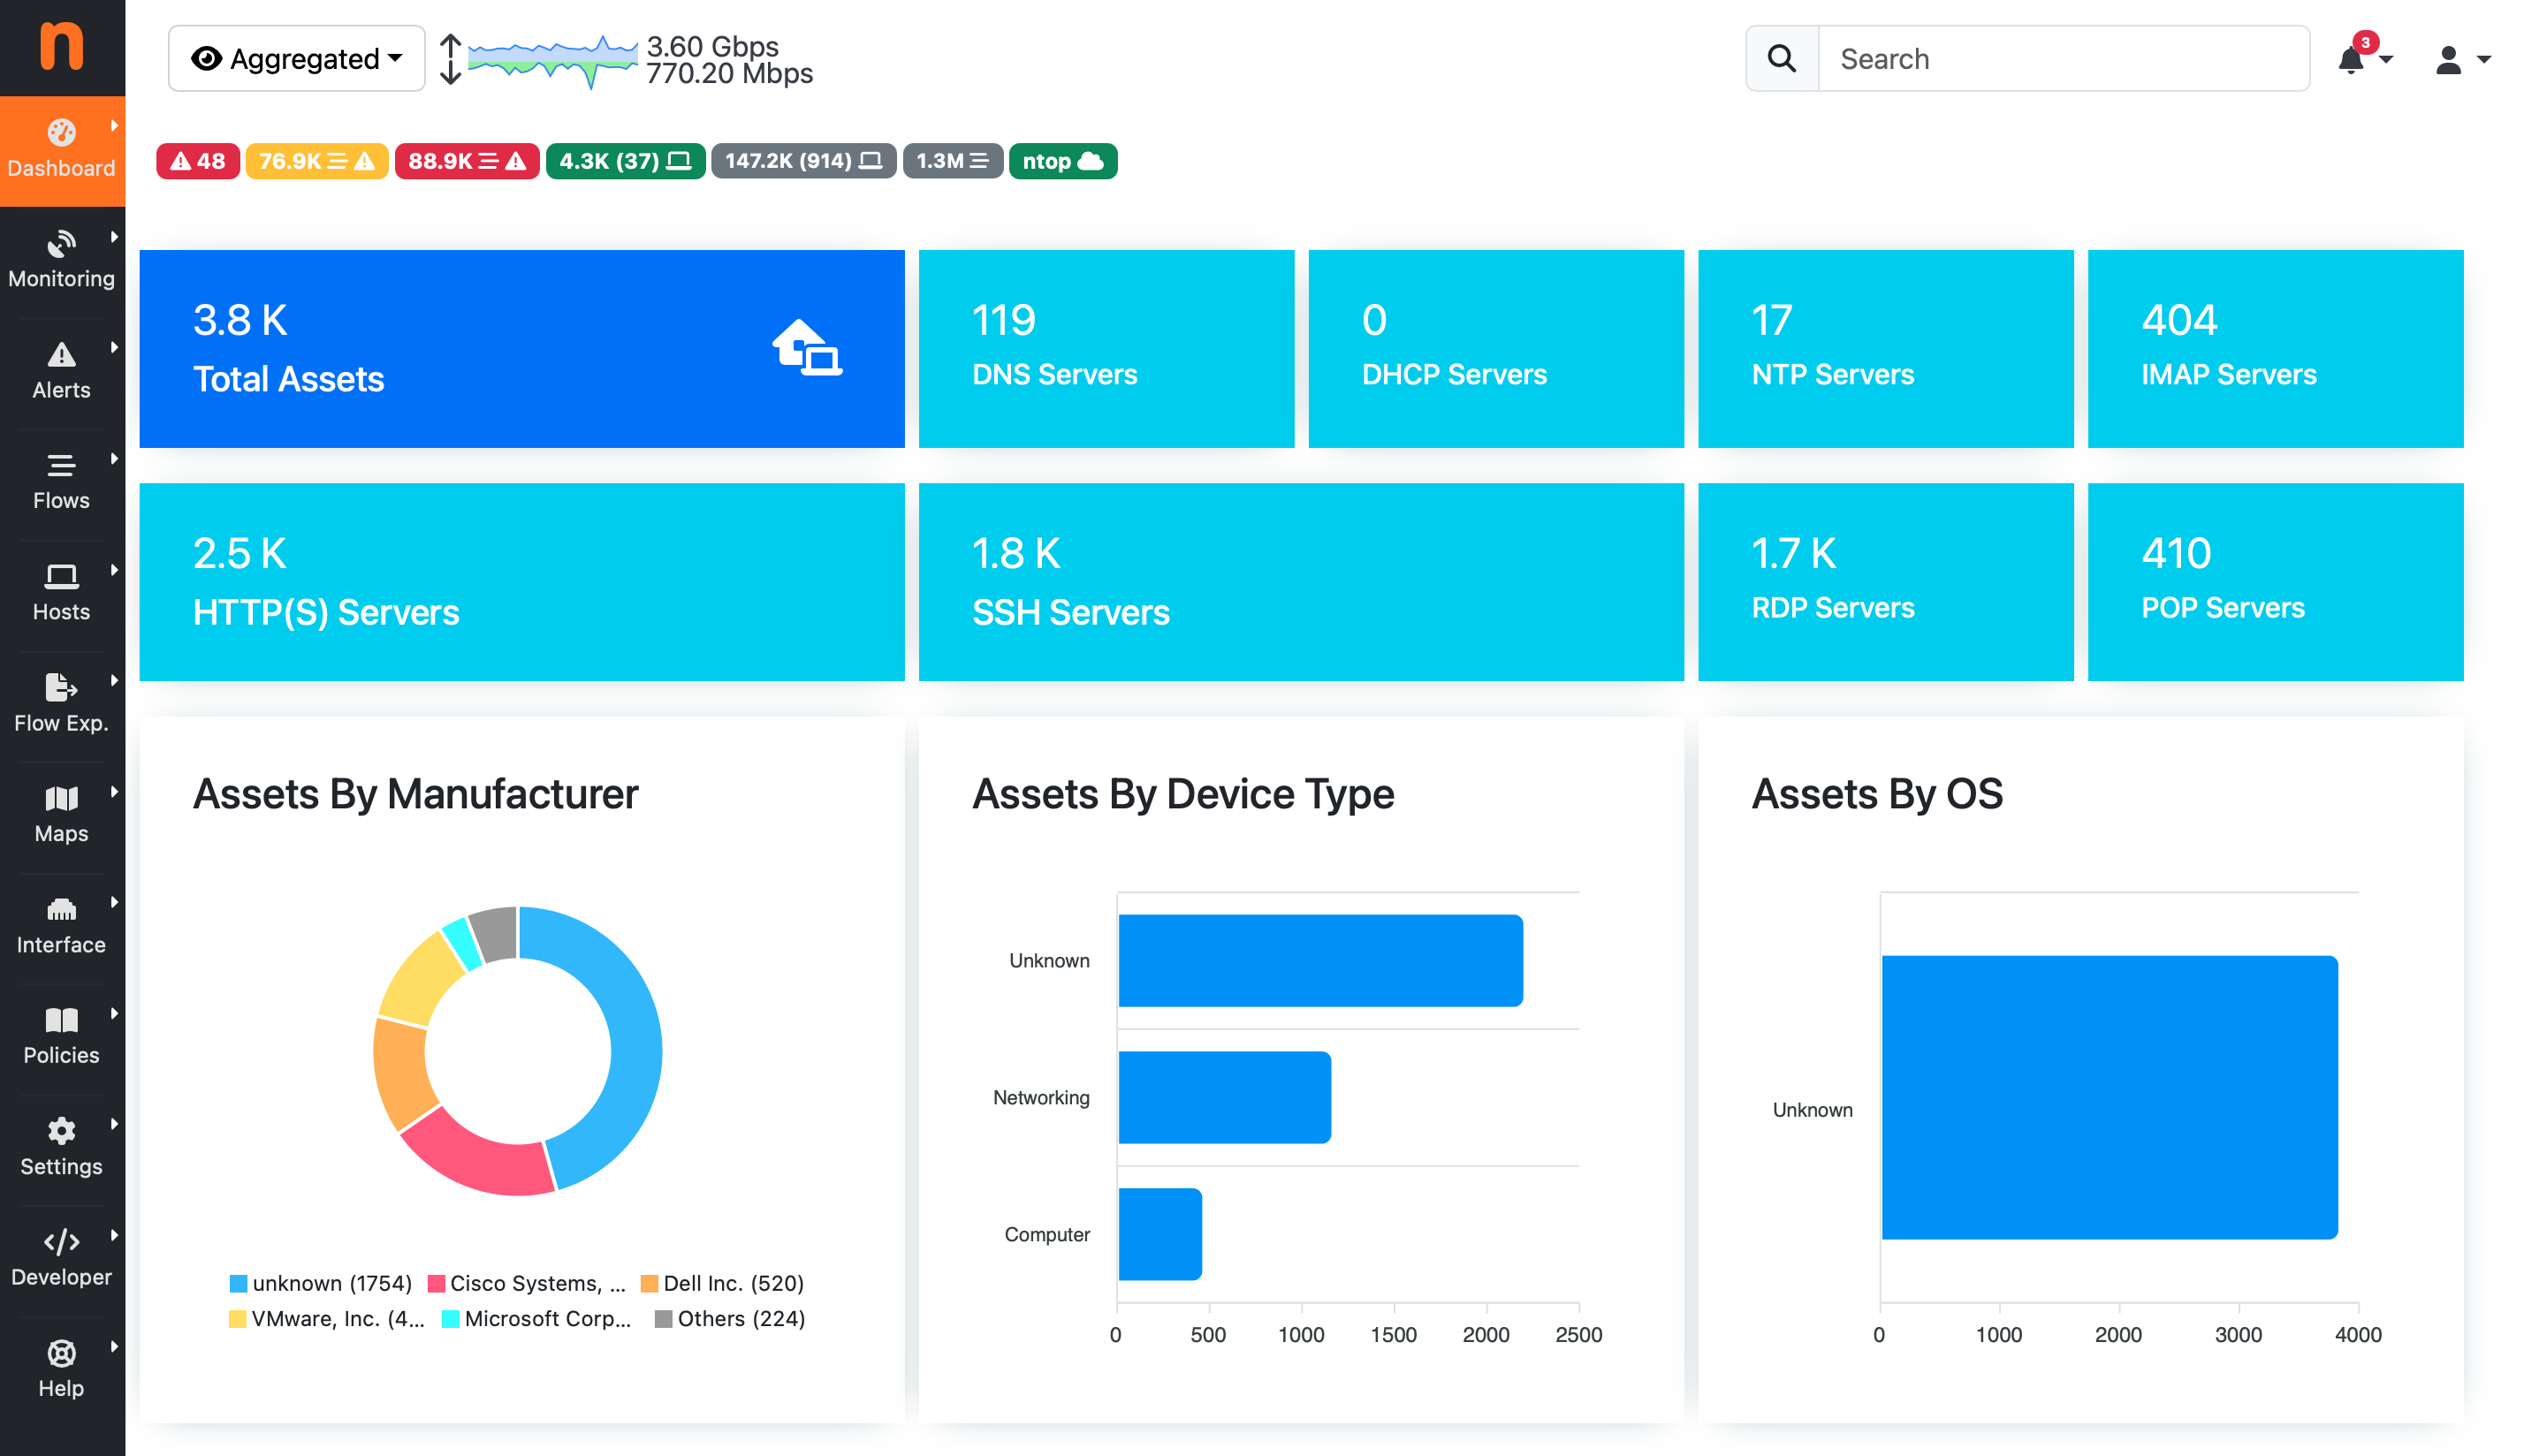
- Realtime network traffic, active flows and hosts
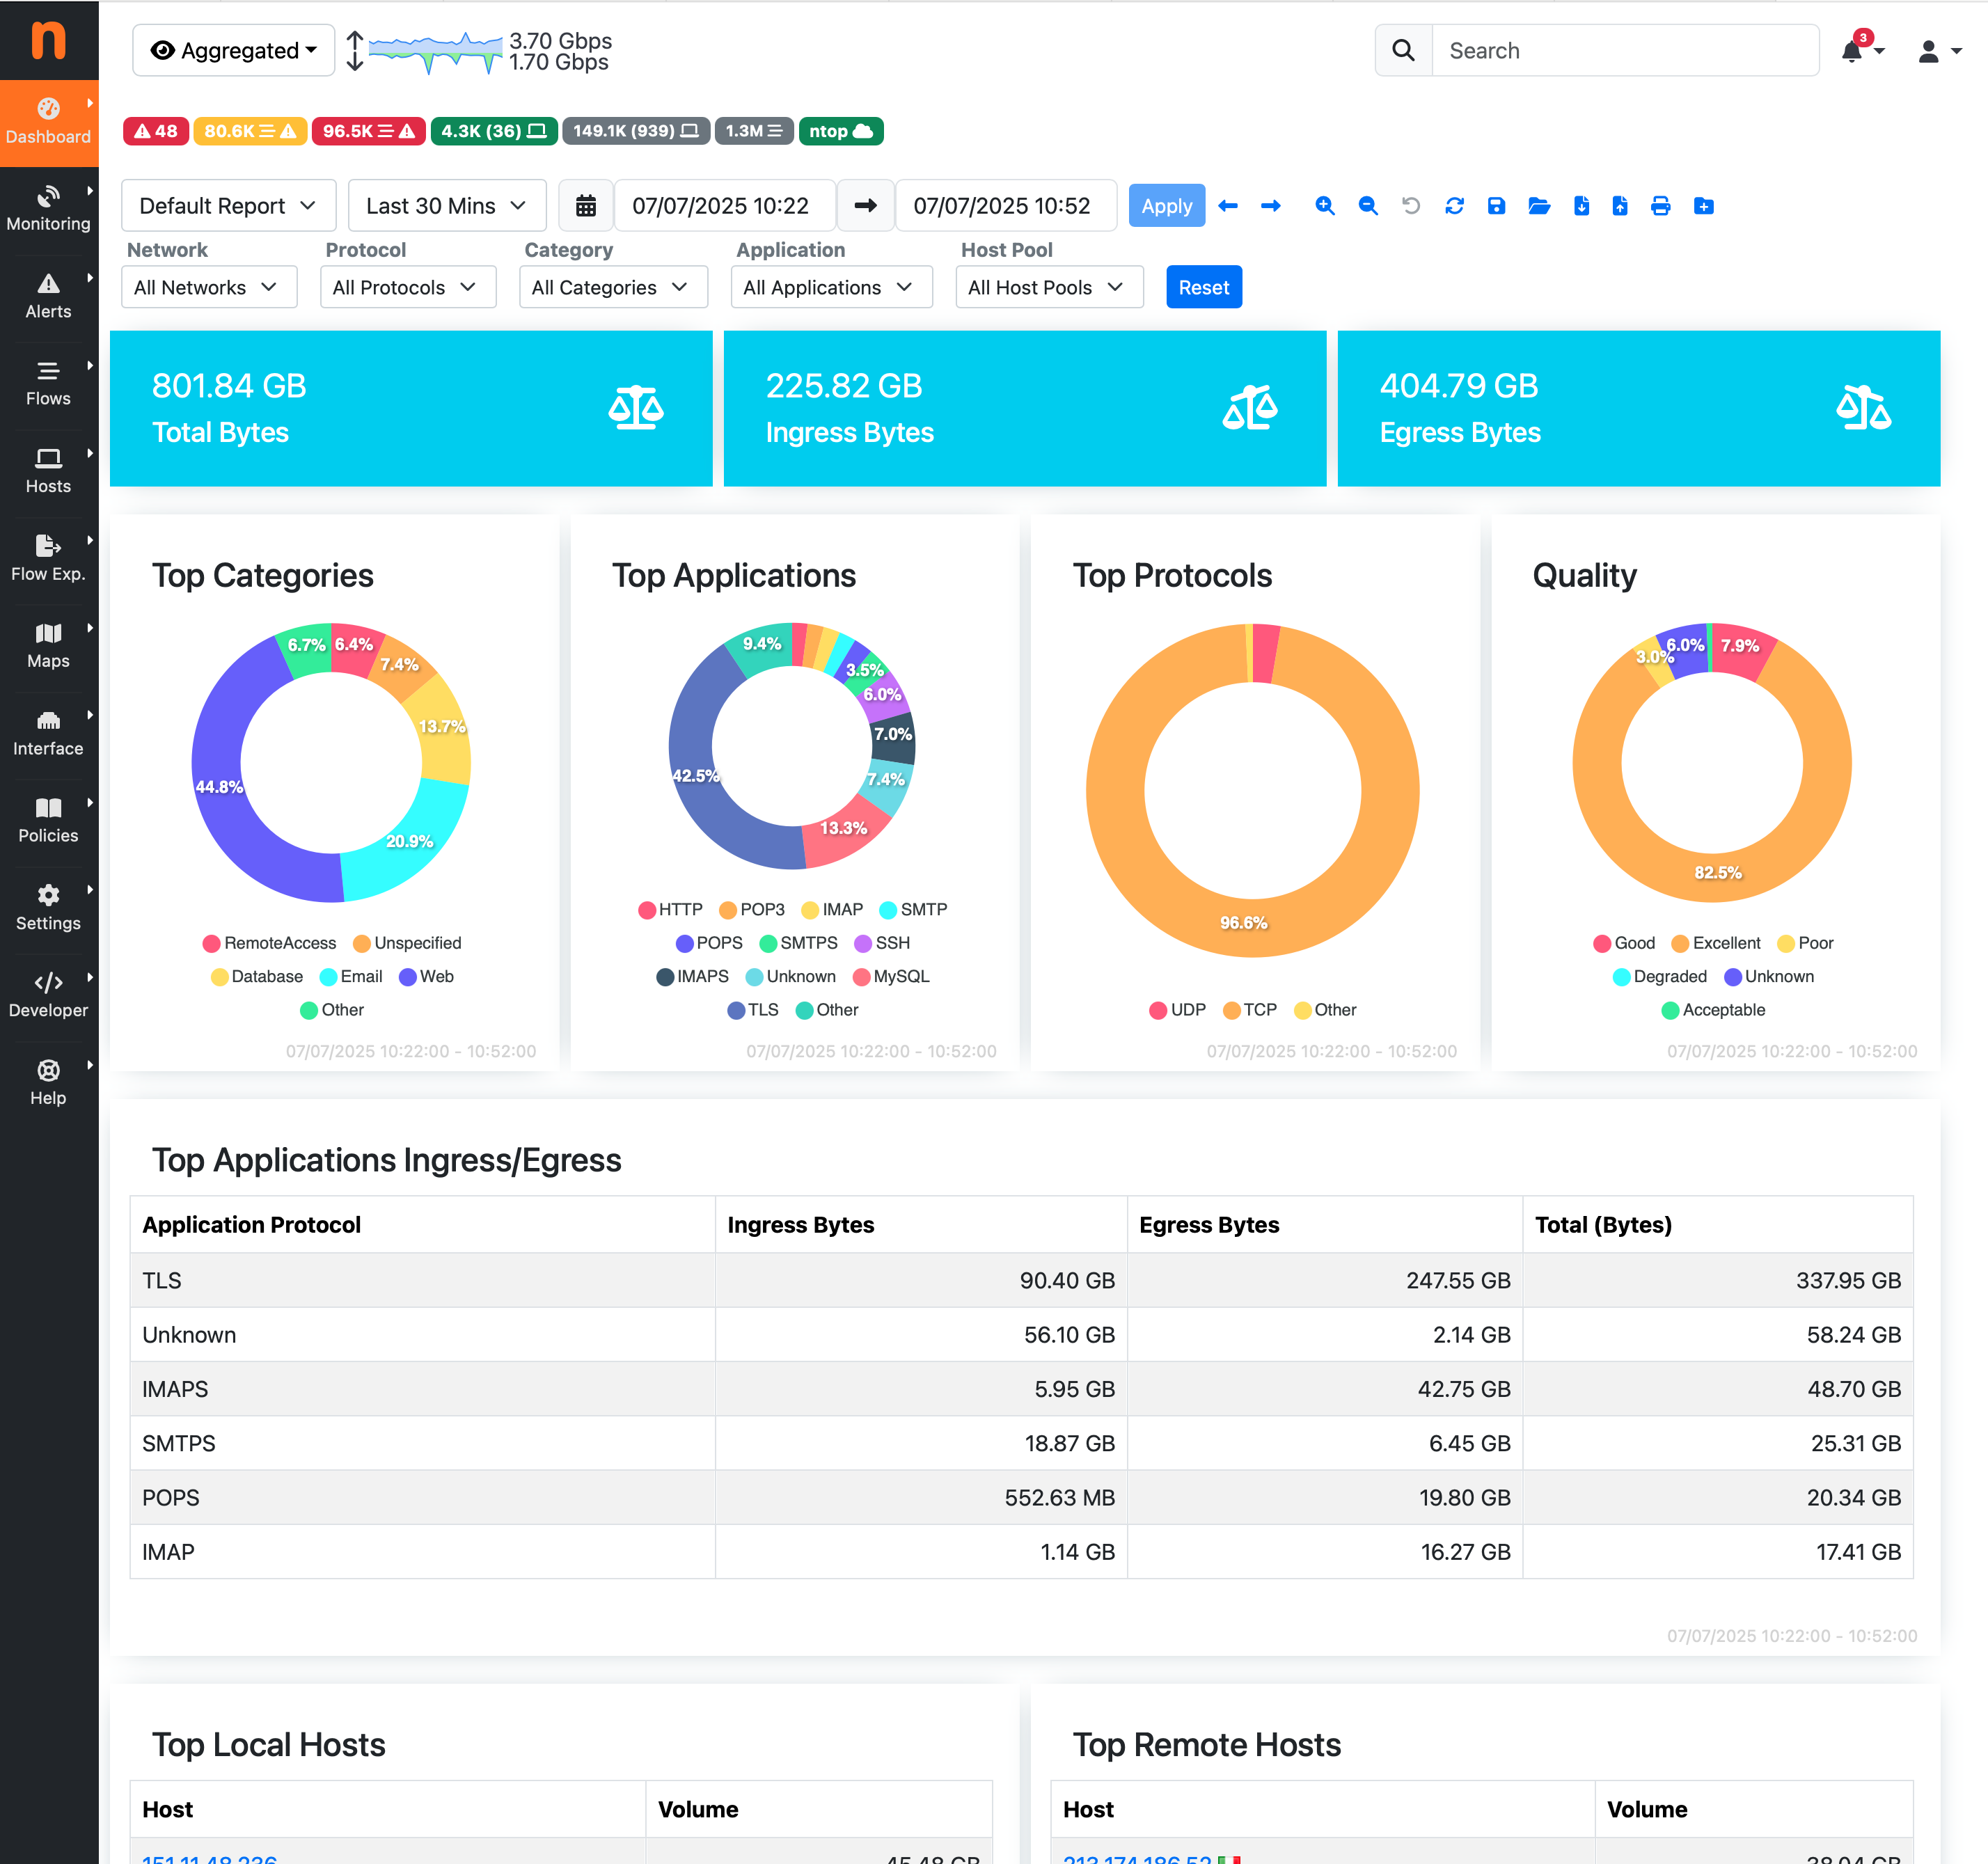
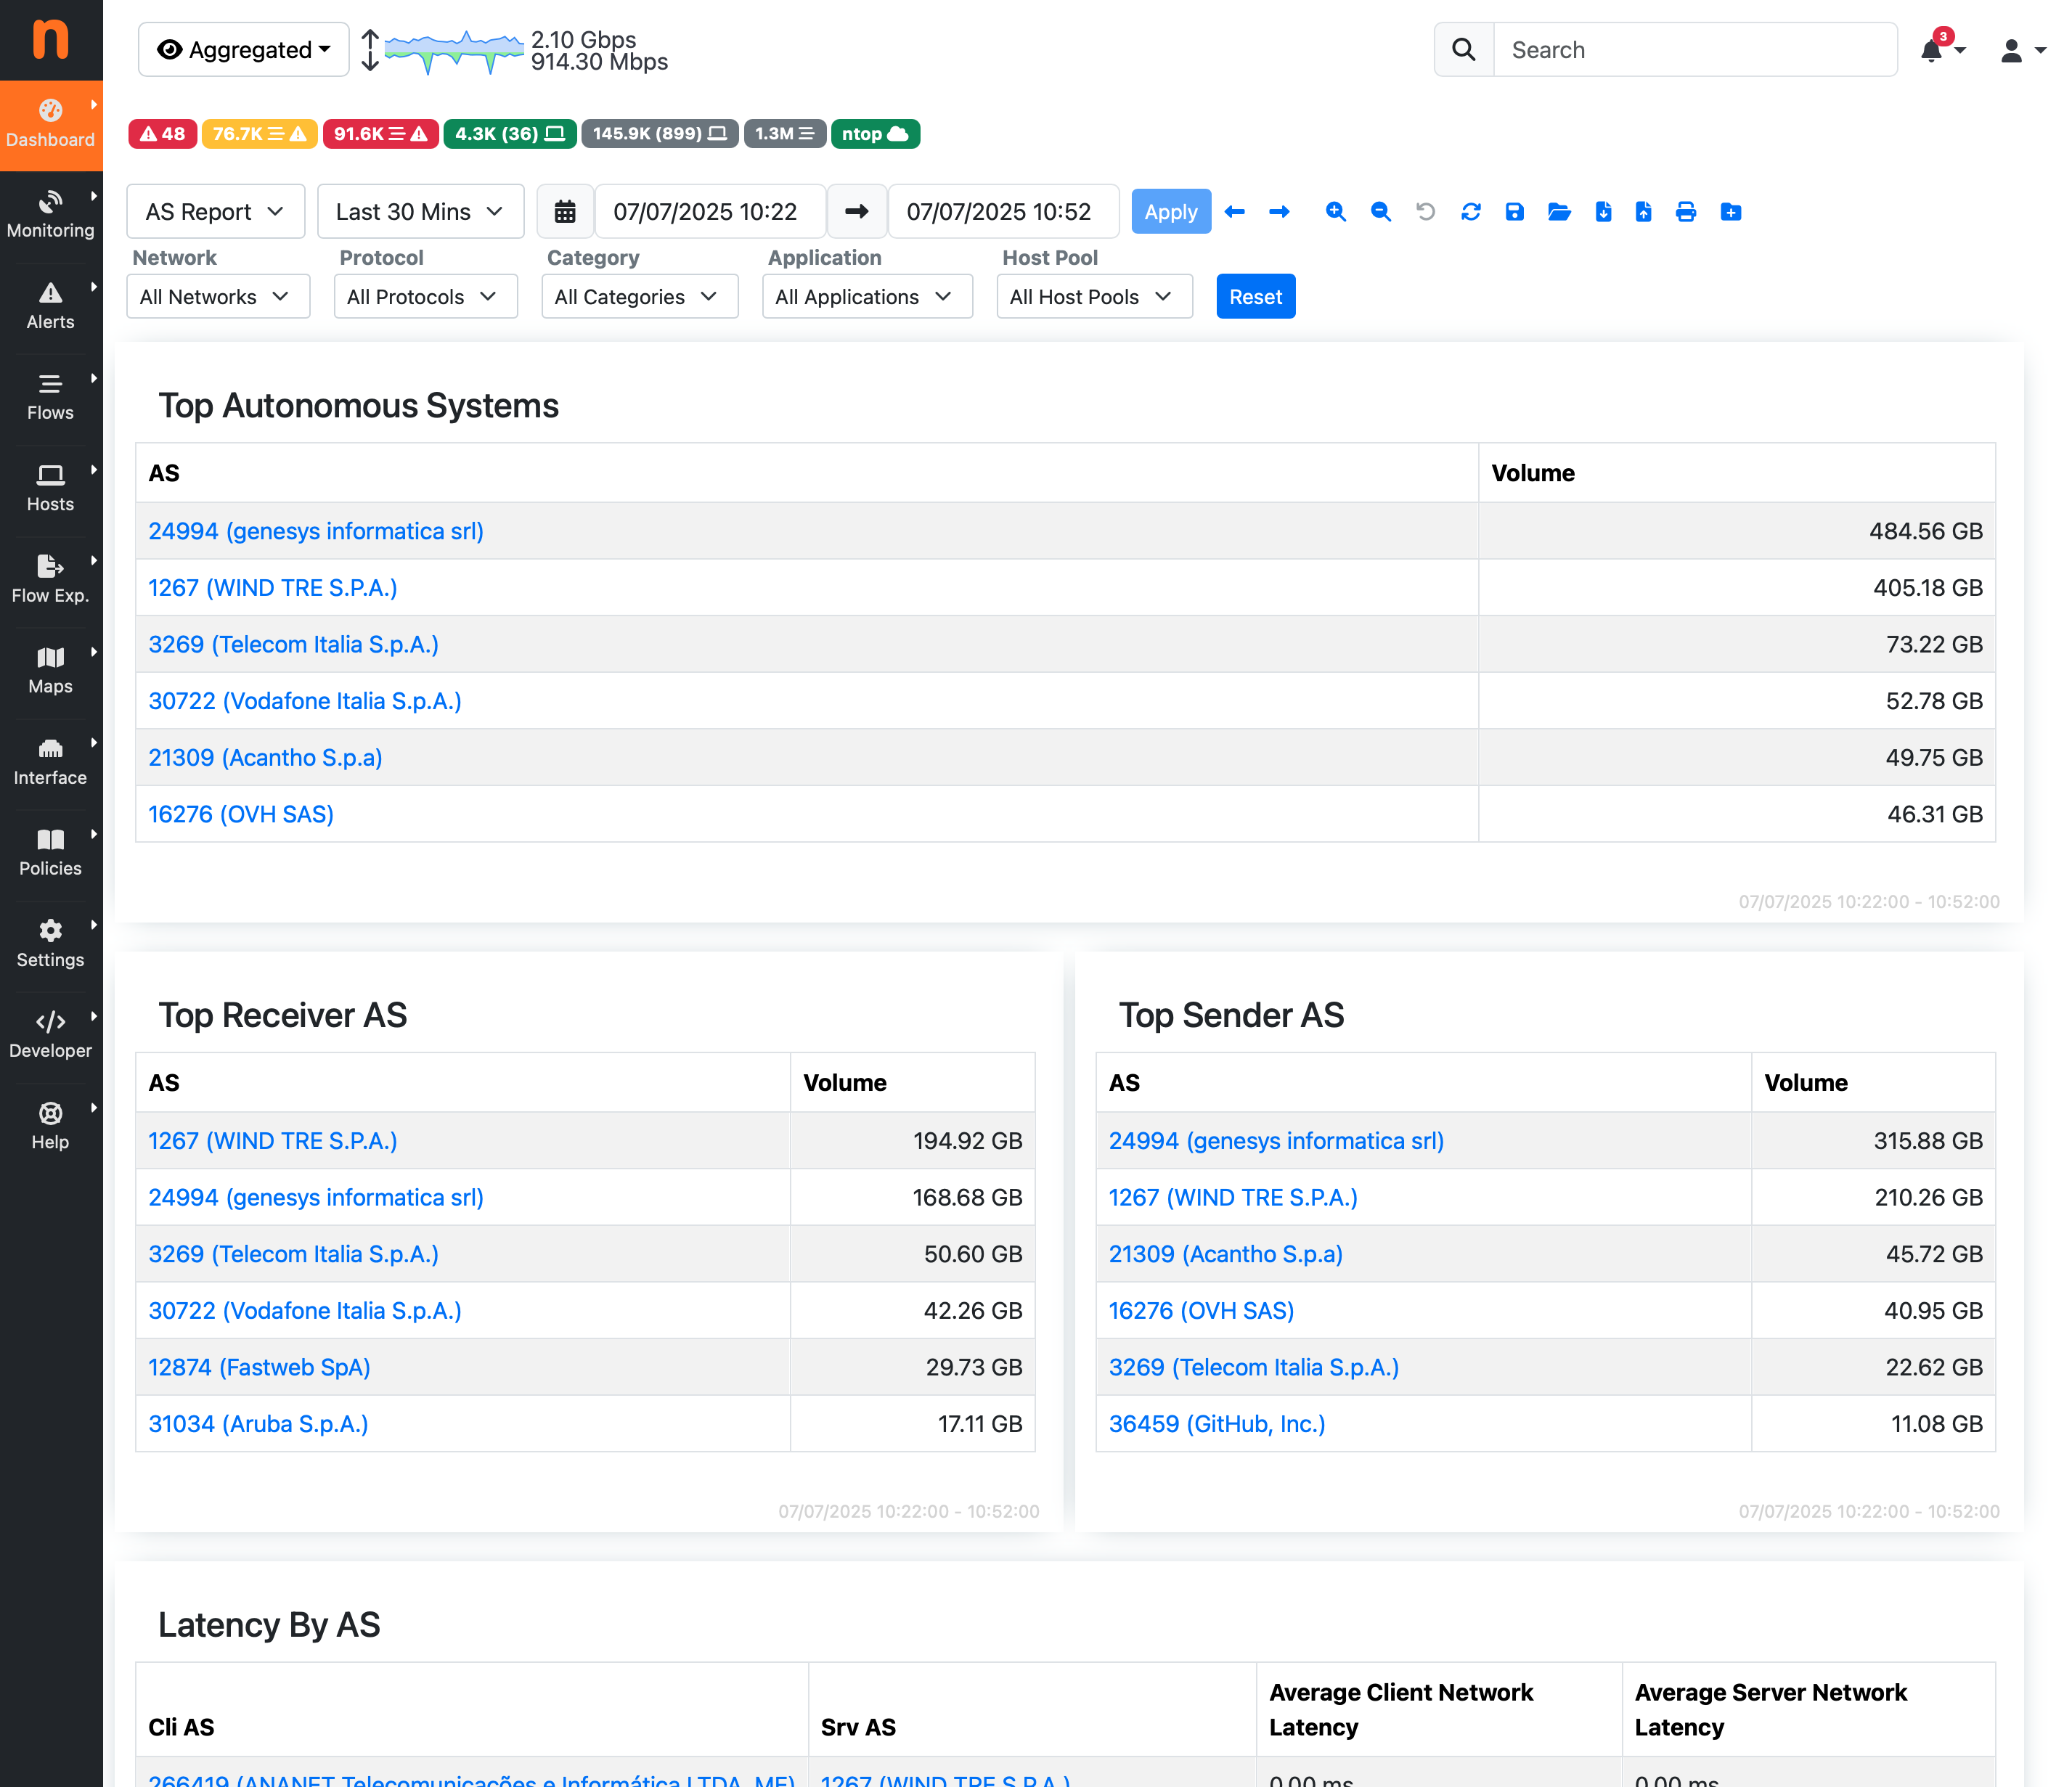
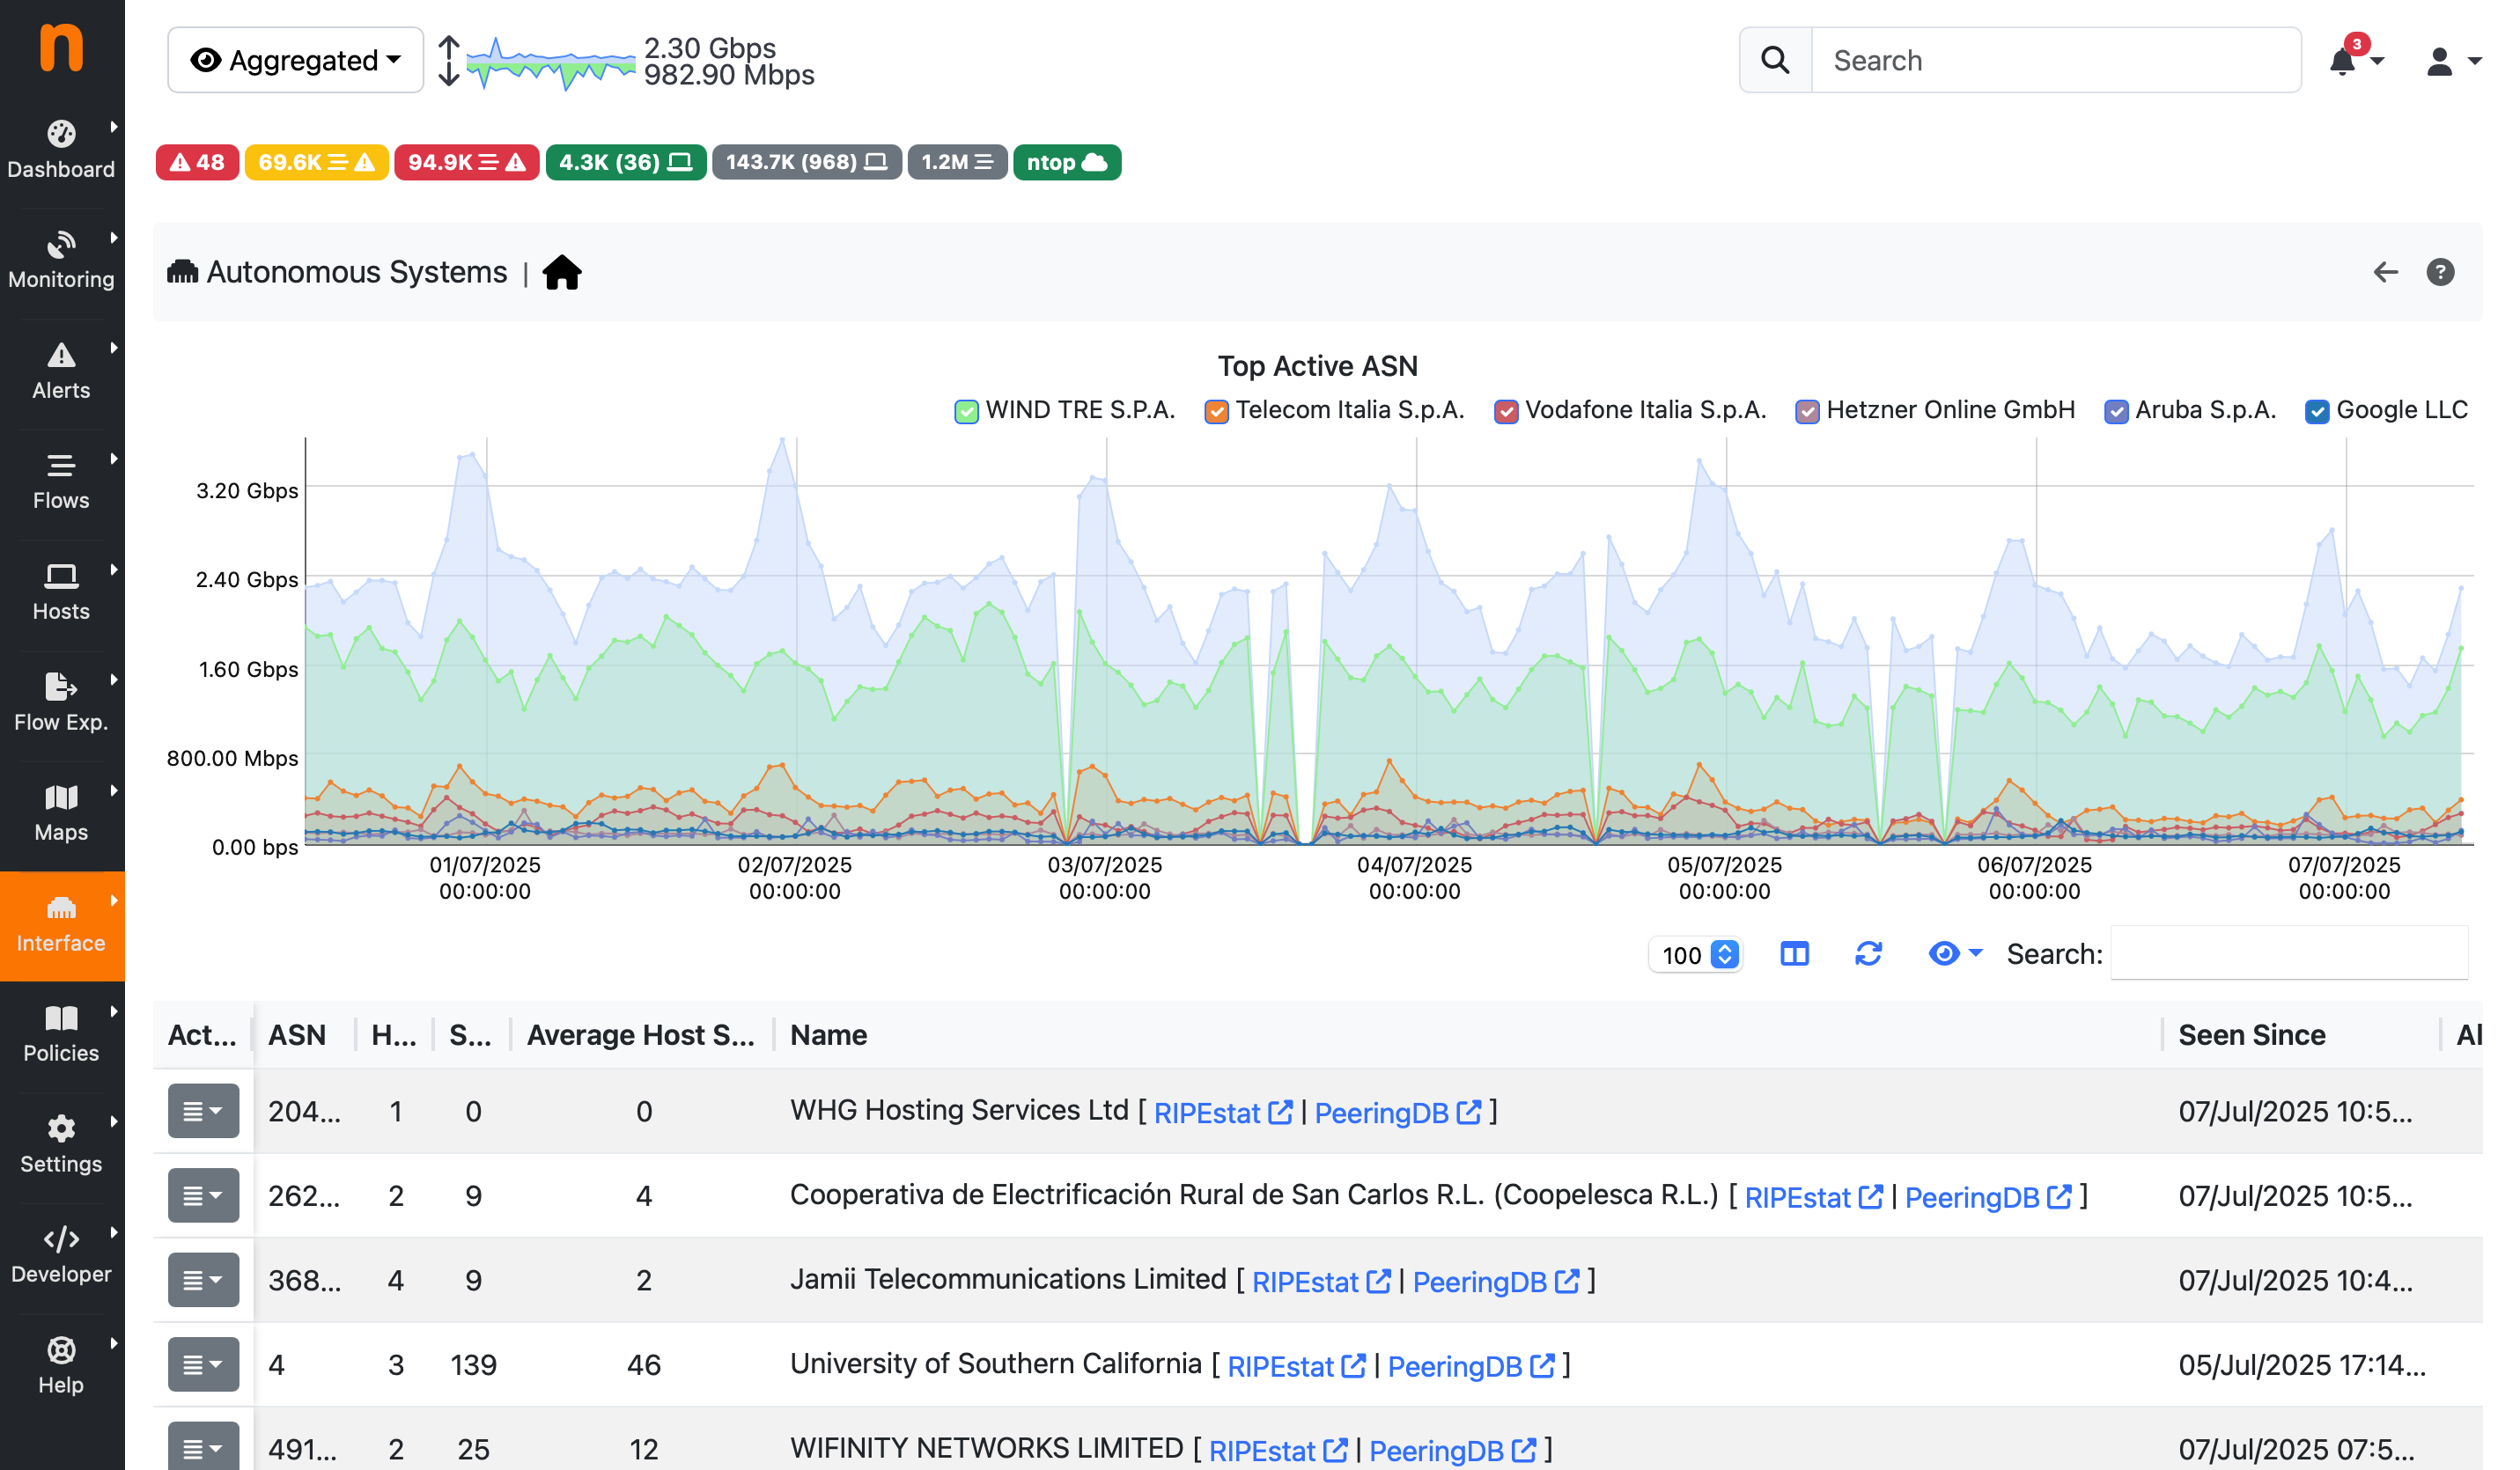
- Top talkers, AS, L7 application protocols, categories
- Protocol and application detection powered by nDPI
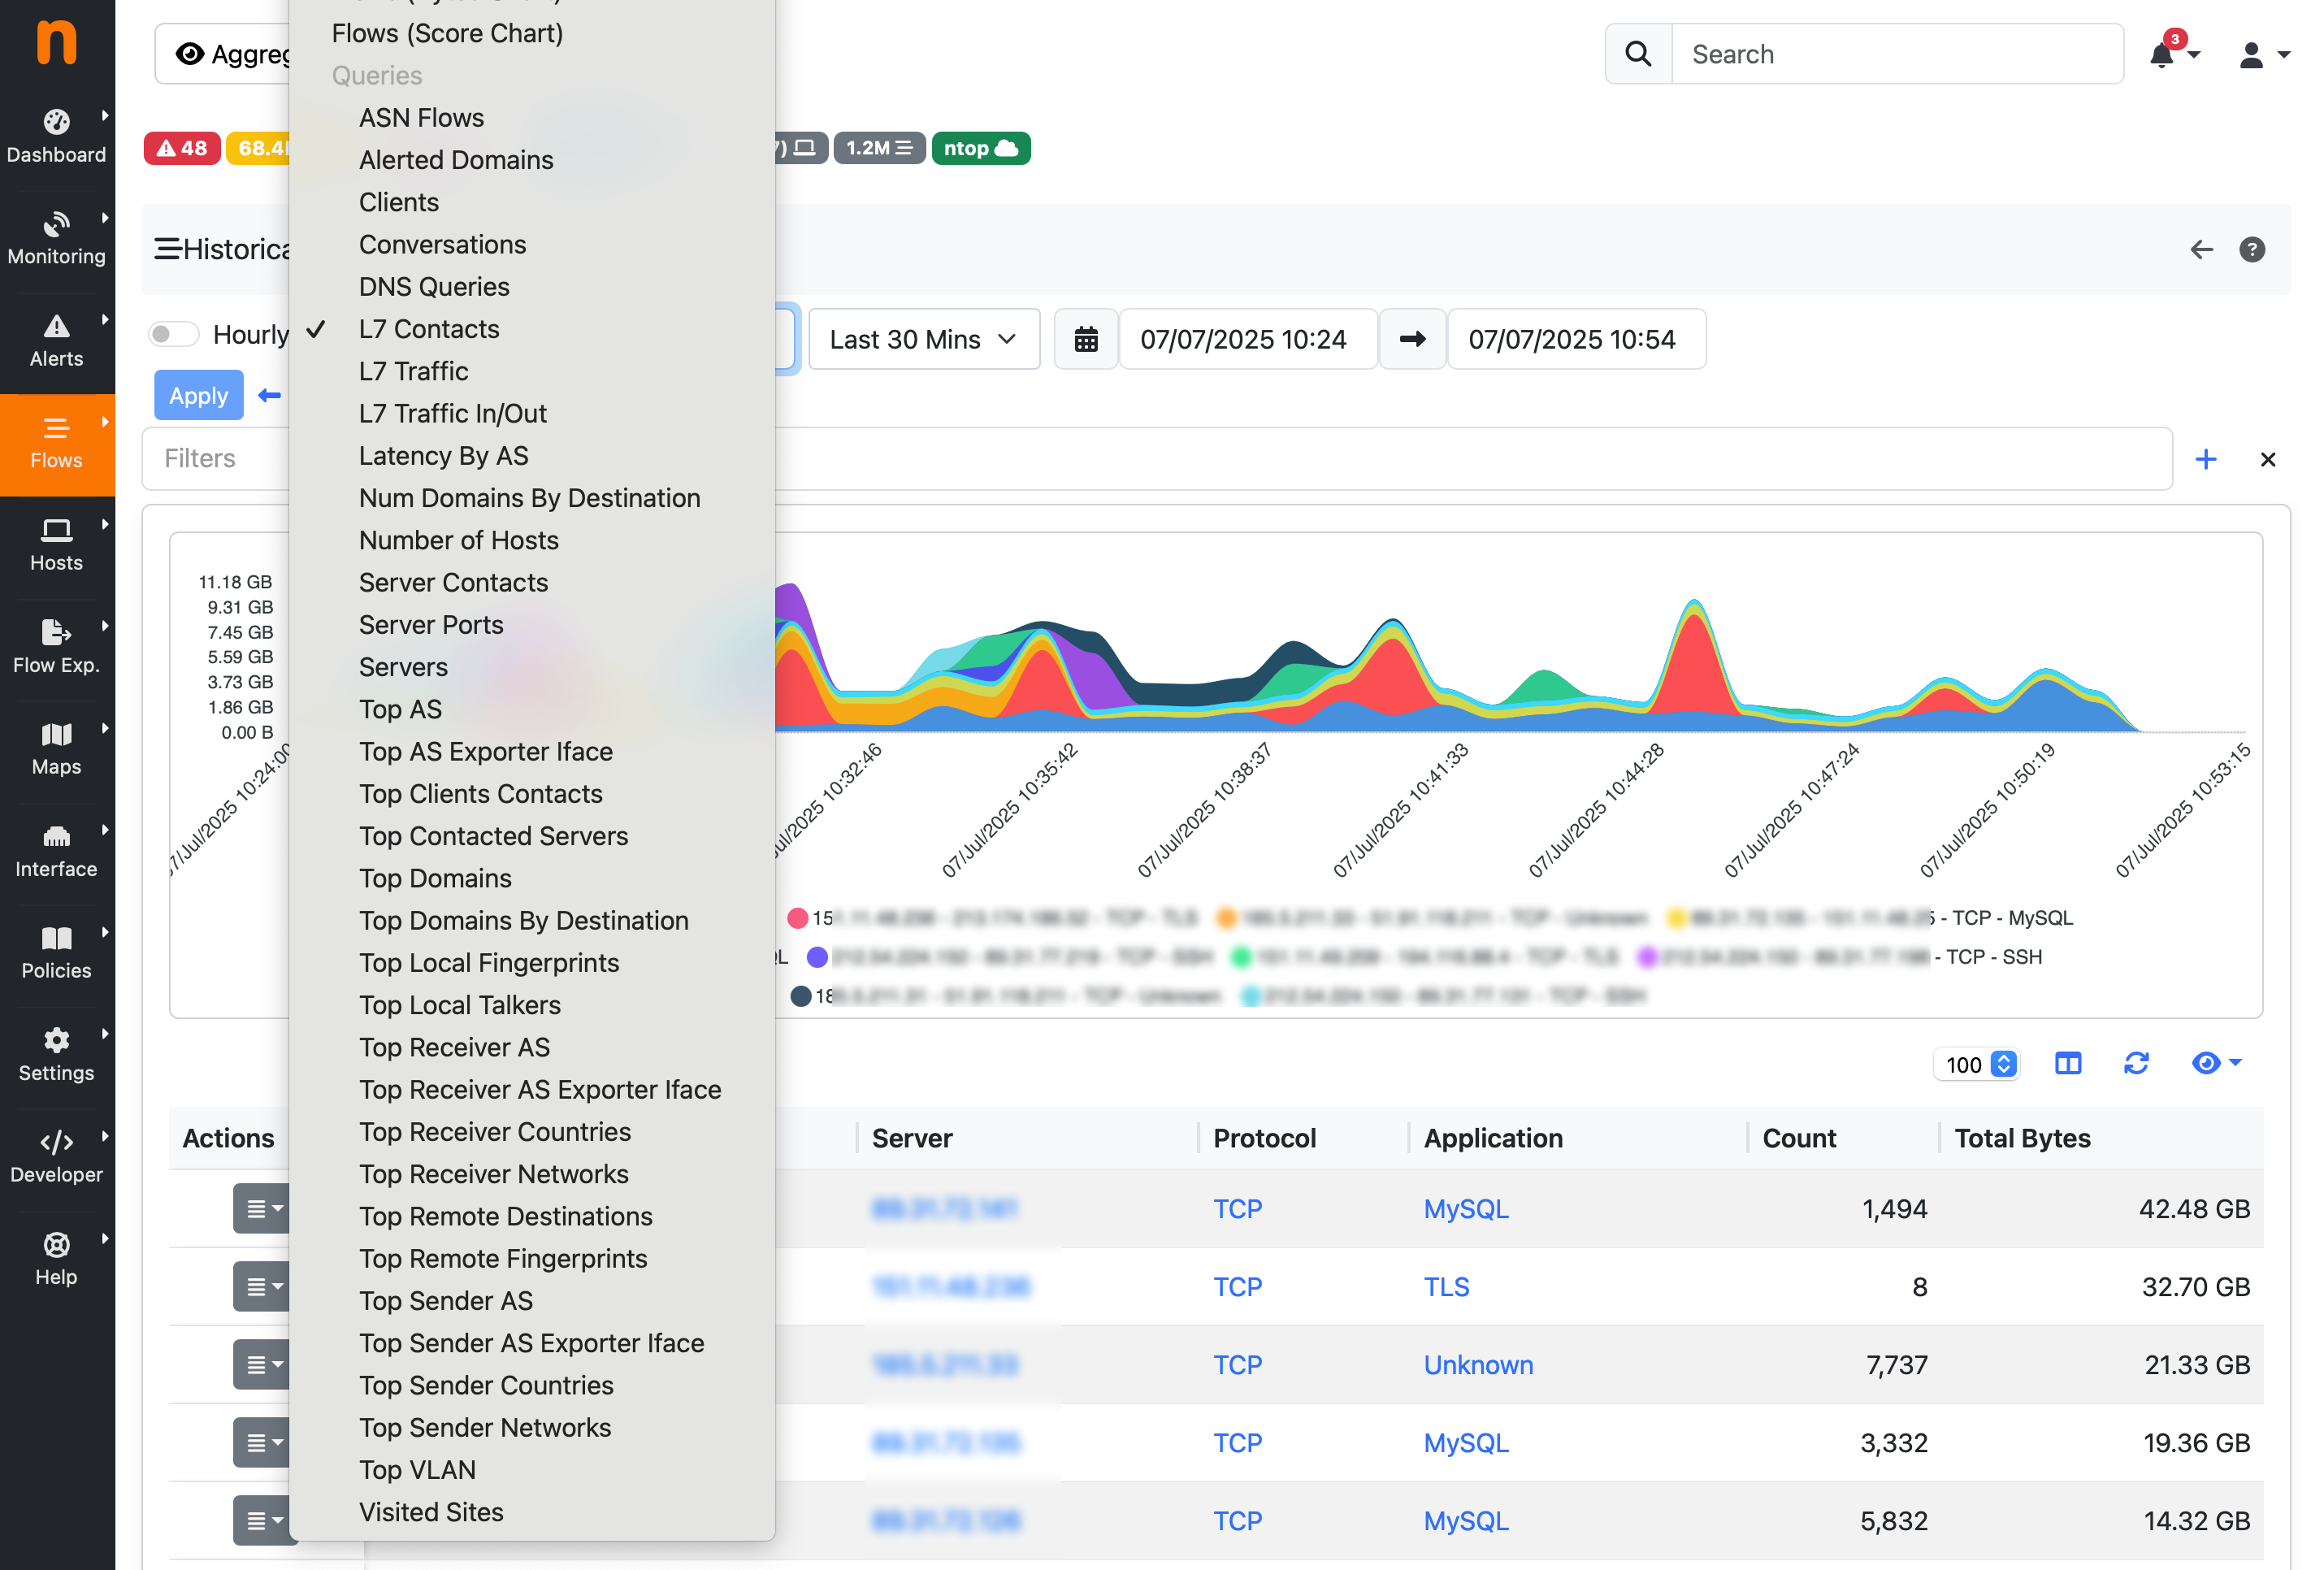
- Custom reports on historical data with metrics and trends
- Application latencies, Round Trip Time (RTT), throughput
- TCP metrics including retransmissions, out of order, packet loss
- Multimedia and VoIP metrics including jitter, MOS
- Hosts geolocalisation
- Multi‑interface support: mirror, TAP, flow collection
- Packet capture via libpcap and PF_RING
- Flow collection from nProbe, NetFlow and sFlow exporters
- HTML5 web user interface
- REST API to ease integrations with third-parties
- Full Layer-2 support and statistics
- Tunnel decapsulation including GTP andGRE
- Export to ElasticSearch and bigdata systems
- Interactive exploration of historical data exported (ClickHouse)
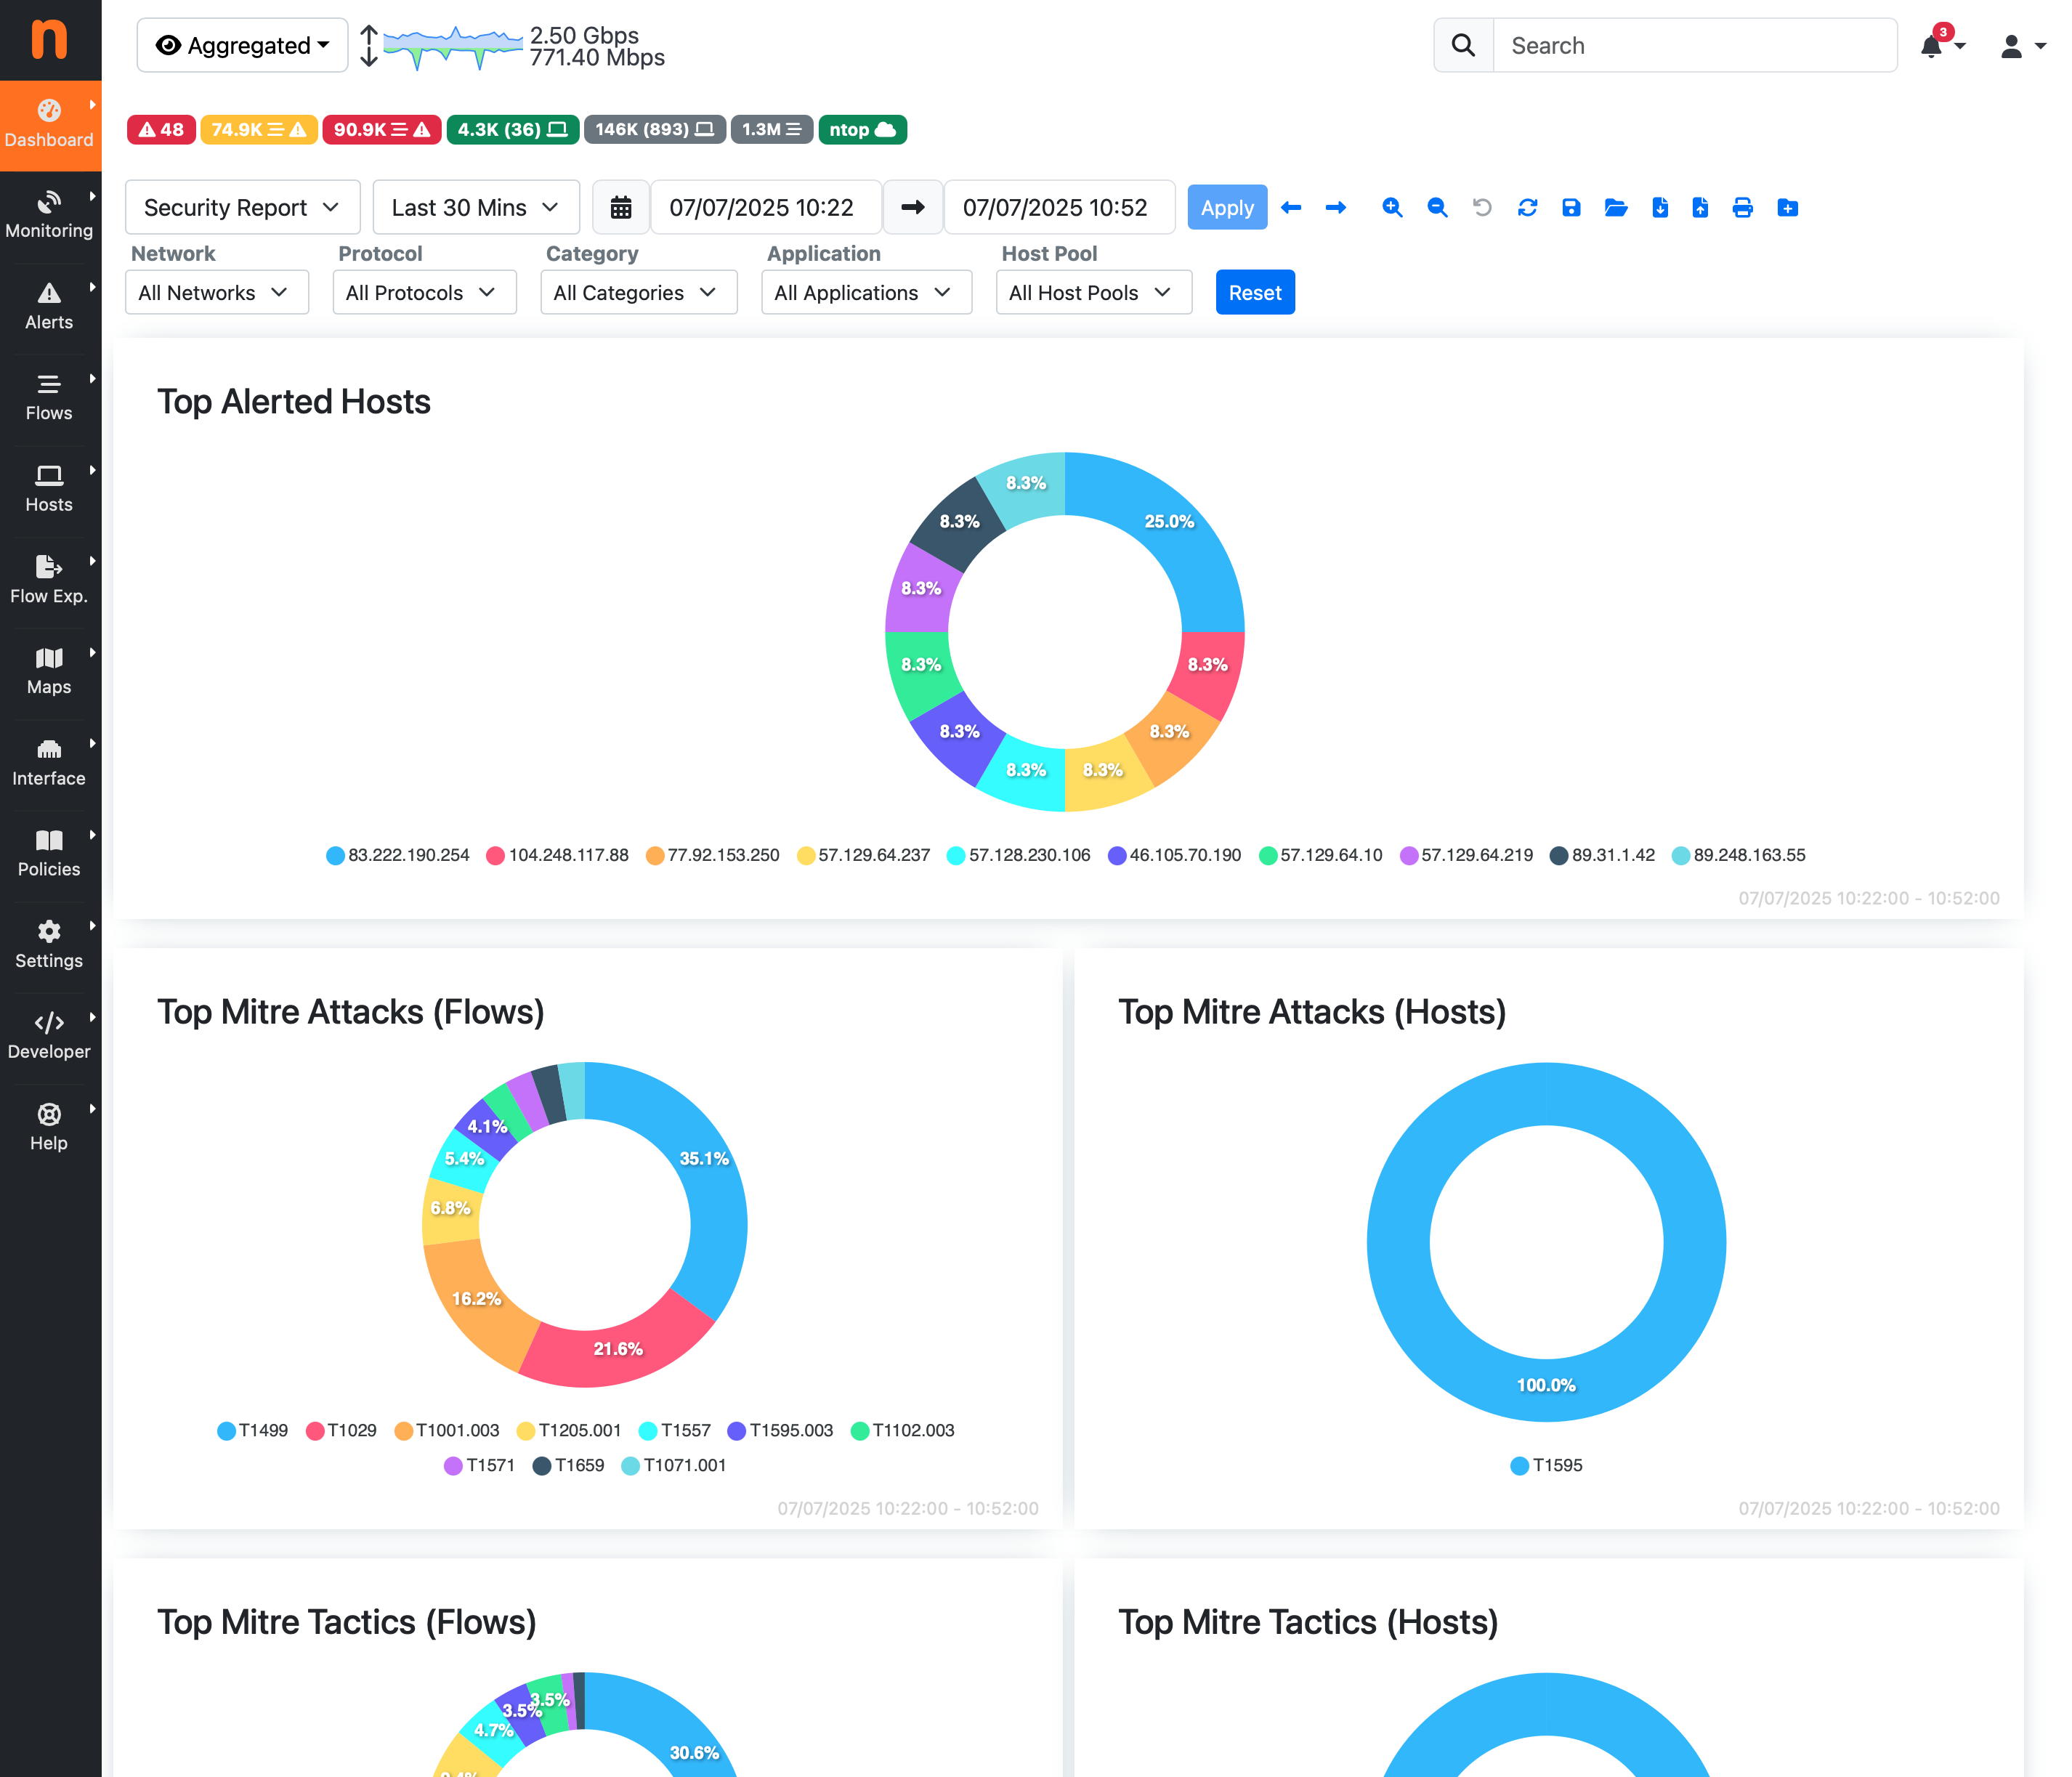
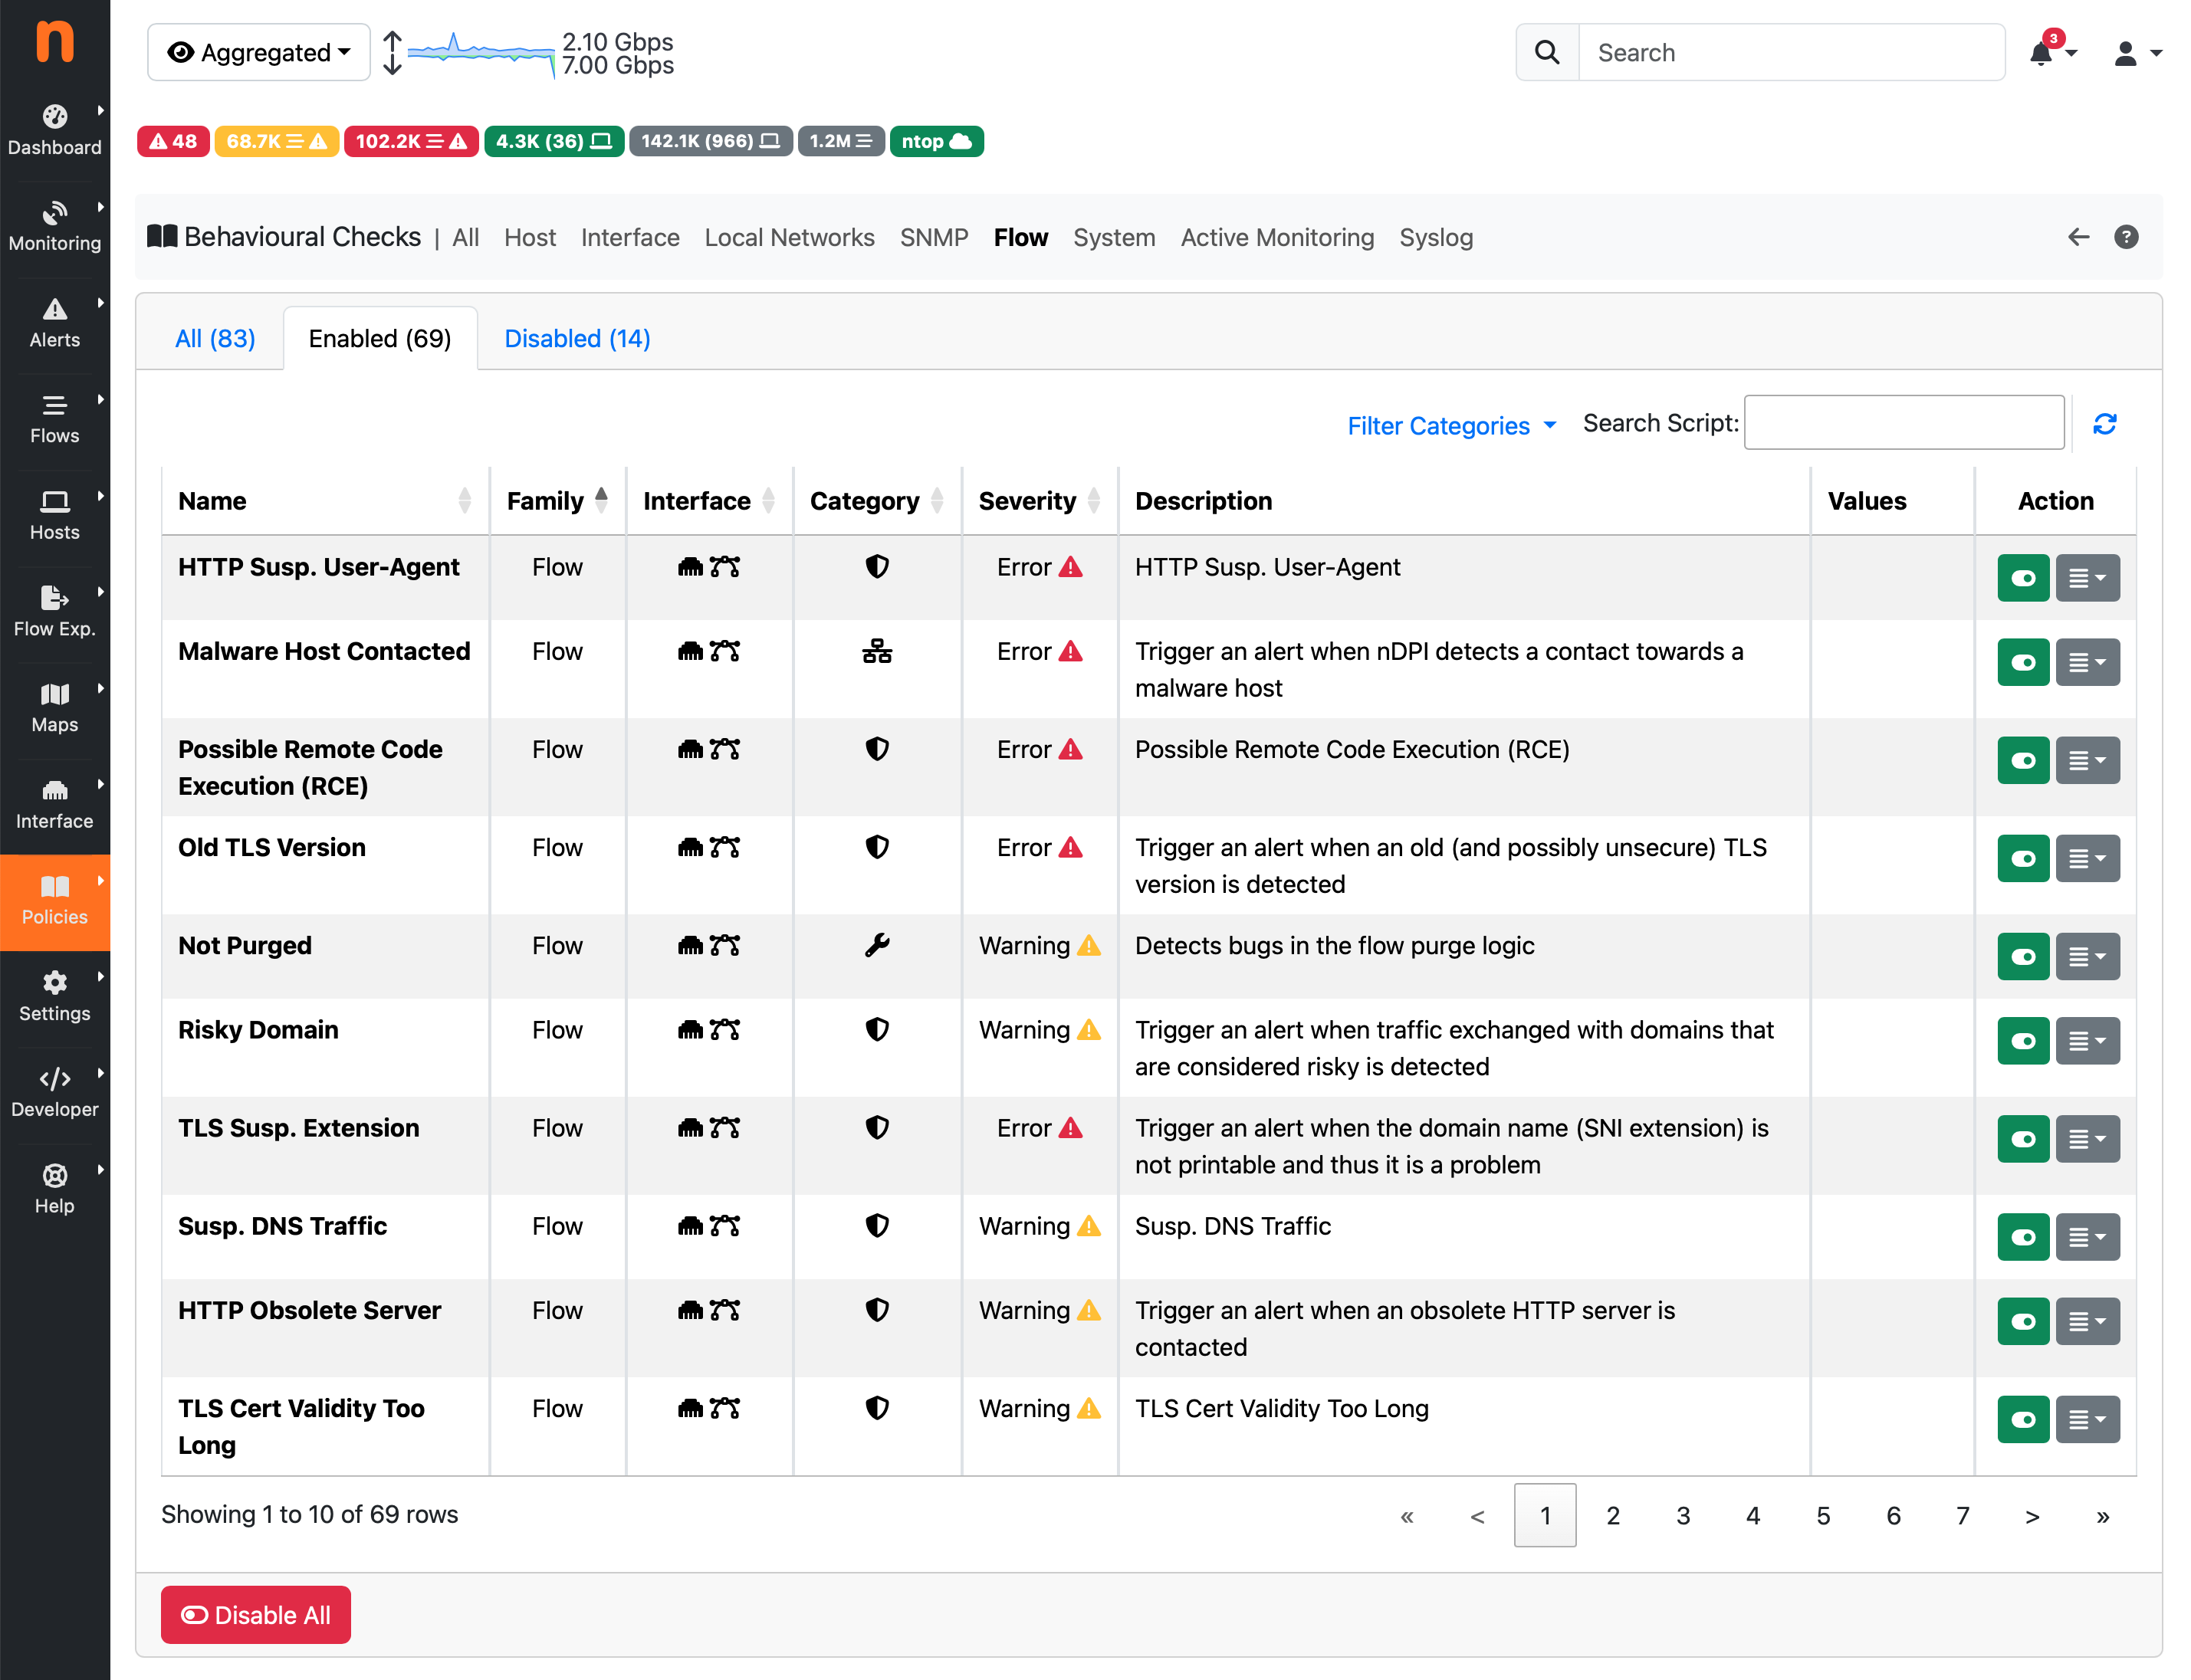
- Behavioural checks and alert notifications
- SNMP v1/v2c/v3 support
- Identity Management and VPN correlation
- Native nTap support for remote capture on cloud, VMs, containers
- Active monitoring and SLA reporting
Works great with nProbe!
ntopng works even better in distributed networks or high-speed links when paired with nProbe or nProbe Cento!
Ideal for Every Environment
Use Cases
Flow Collection in Enterprise Networks
Monitor hundreds of thousands of hosts with zero‑delay traffic analysis on high‑speed uplinks.
Flow collection requires ntopng to be used in conjunction with nProbe which can act as probe/proxy.
The communication between nProbe and ntopng takes place over ZeroMQ, a publish-subscribe protocol that allows ntopng to communicate with nProbe.
A remote nProbe is physically monitoring a mirror from a NIC and sending monitored flows to ntopng, or is collecting NetFlow v5/v9/IPFIX or sFlow from one or more exporters (routers or switches). nProbe Cento allows you to monitor even 100 Gbit links when processing packets from a mirror port, yet providing application protocol information by running nDPI.
Capture Packets from a Mirror/TAP
Mirror (SPAN) ports or TAP devices allow network monitoring tools to observe all packets flowing through the network for for network visibility, troubleshooting, threat detection, and capacity planning, without generating traffic or altering the data path.
- Mirror Port (SPAN): available on most managed switches, duplicates traffic from selected ports or VLANs to a dedicated monitoring port.
- TAP Device: transparently copies all network traffic at the physical layer, acting as a bump-in-the-wire and providing a fail-safe method for capturing traffic.
A physical NIC card connected to a mirror can be monitored by ntopng itself by simply specifying its interface name. This configuration can be used to monitor a mirror port from a switch, or in conjunction with a TAP device by aggregating two directions from two network interfaces. Alternatively, it is possible to use ntopng in combination with nProbe or nProbe Cento to scale up to 100 Gbit.
IDS Integration and Security Operations
Combine L7 visibility, IDS integration, syslog ingestion and alerts for full awareness. ntopng, in addition to behavioral checks able to detect traffic anomalies, can ingest events from IDS systems like Suricata enriching traffic analytics with security insights for faster threat detection and response.
Specifications
Tech Specs
- Linux
- FreeBSD
- Windows x64 (including Windows 10/11)
- macOS
- RaspbianOS
- Web GUI available through any HTML5-ready browser
- HTTP-based RESTful API
- TLS/HTTPS support
- Lua scriptability
| Small Network | Medium Network | Large Network | |
| Traffic | 100 Mbps | 1 Gbps | 10 Gbps and above |
| Processor | 2 cores | 4 cores | 8+ cores |
| Memory | 2 GB | 4 GB | 16+ GB |
For further information please check the Hardware Sizing notes.
- Ethernet
- IPv4/IPv6
- TCP/UDP/ICMP
- GTP/GRE/MPLS/VXLAN
- DHCP/BOOTP/NetBIOS/DNS…
- 450+ Layer-7 application protocols supported by nDPI
ntopng Community is distributed under the GNU GPLv3 license. Professional and Enterprise versions are subject to the EULA terms as well.
versions
Choose Your Version
Did you already install the software?
Select the ntopng version that fits your needs. Different versions unlock different features and capacity.
Check the comparison table for the features set about the various versions.
Community (Open Source)
- Reatime visibility and top talkers
- Layer-7 application detection
- Historical timeseries for hosts
- VLAN, OS, Country and AS stats
- Alerts and notifications
- Active monitoring and network discovery
- Designed for home and network practitioners
- Small networks
Pro
- All Community features included
- Interfaces aggregation in a unified View
- LDAP authentication
- Exterprise-level alert notifications
- Extended behavioral checks and alerts
- Network matrix timeseries
- Designed for offices and small enterprises
- Small/medium networks
Enterprise M/L/XL/XXL
- All Pro features included
- Historical data and reports
- Extended SNMP support
- NetFlow/sFlow exporters statistics
- Identity management with VPNs
- Infrastructure monitoring
- Designed for large organisations, HSPs, ISPs, ...
- Large networks
Screenshots
Gallery