
Introduction
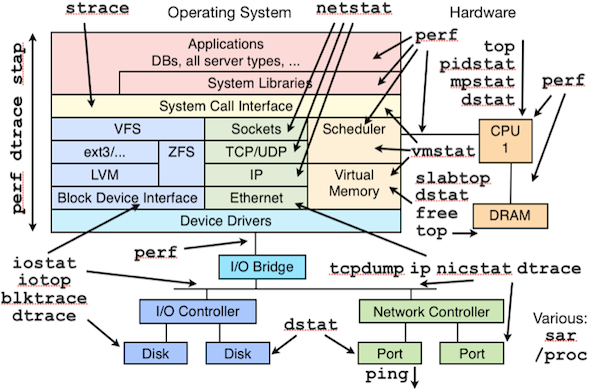
When in 1998 we have started the development of the original ntop, there were many Unix tools for monitoring network traffic: ping, tcpdump, netstat, and many others. Nevertheless we have decided to develop ntop, because there was no tool able to show on a simple way what was happening on our network. Early this year we have started the development of some experimental PF_RING kernel module extensions able to give ntop applications visibility of process activities, this in order to bind network traffic with a process name. We have lived once more the early ntop days when last May our friends at Draios have introduced sysdig and made all this mess below history.
We have therefore put our experimental code in the trash and started hacking on top of sysdig.
Our Vision: Combine System with Network Information
The idea is very simple: we want to associate a process name with every network activity, and monitor the process resources (CPU, memory and I/O) used to carry on such activity. With flow-based paradigm what we see is depicted below.
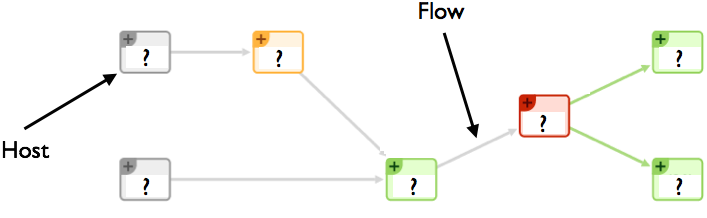
In essence we see hosts, ports, protocols and flows, but we lack visibility on the process that did all that. This has been the driving force to combine system with network monitoring, so that when system administrators see an increase in HTTP application response time, they can:
- Get the list of all the processes that were running when such HTTP request was served.
- Know what system resources were used by the process that served such request while serving such request (and not since process startup).
In essence we want empower system administrators and let them know what is happening on their system, also from the security point of view. You can finally know what is the name of the process that sent the packet-of-death so that you can find it on the system and neutralise it. As we’ve been playing with network flows for more than a decade, we believe that we can apply the same principle to system processes, by modelling them similar to flows.
In order to achieve all this we have extended our flow probe nProbe with sysdig, by developing a new process monitoring plugin that implements new information elements that can be exported via NetFlow/IPFIX or JSON to ntopng and other applications. The big challenge has been to monitor the system while keeping the CPU utilisation low, as busy systems can produce a lot of system events; for this reason we have implemented event filters so that nProbe analyses only those events that are necessary to carry on the job, while discarding the others inside the kernel (i.e. they are not sent by sysdig to the user-space app at all). The new information elements include:
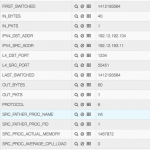
[NFv9 57640][IPFIX 35632.168] %SRC_PROC_PID                Src process PID
[NFv9 57641][IPFIX 35632.169] %SRC_PROC_NAME                    Src process name
[NFv9 57844][IPFIX 35632.372] %SRC_PROC_USER_NAME               Src process user name
[NFv9 57845][IPFIX 35632.373] %SRC_FATHER_PROC_PID              Src father process PID
[NFv9 57846][IPFIX 35632.374] %SRC_FATHER_PROC_NAME             Src father process name
[NFv9 57855][IPFIX 35632.383] %SRC_PROC_ACTUAL_MEMORY           Src process actual memory (bytes)
[NFv9 57856][IPFIX 35632.384] %SRC_PROC_PEAK_MEMORY             Src process peak memory (bytes)
[NFv9 57857][IPFIX 35632.385] %SRC_PROC_AVERAGE_CPU_LOAD        Src process avg load (% * 100)
[NFv9 57858][IPFIX 35632.386] %SRC_PROC_NUM_PAGE_FAULTS         Src process num pagefaults
[NFv9 57865][IPFIX 35632.393] %SRC_PROC_PCTG_IOWAIT             Src process iowait time % (% * 100)
[NFv9 57847][IPFIX 35632.375] %DST_PROC_PID                     Dst process PID
[NFv9 57848][IPFIX 35632.376] %DST_PROC_NAME                    Dst process name
[NFv9 57849][IPFIX 35632.377] %DST_PROC_USER_NAME               Dst process user name
[NFv9 57850][IPFIX 35632.378] %DST_FATHER_PROC_PID              Dst father process PID
[NFv9 57851][IPFIX 35632.379] %DST_FATHER_PROC_NAME             Dst father process name
[NFv9 57859][IPFIX 35632.387] %DST_PROC_ACTUAL_MEMORY           Dst process actual memory (bytes)
[NFv9 57860][IPFIX 35632.388] %DST_PROC_PEAK_MEMORY             Dst process peak memory (bytes)
[NFv9 57861][IPFIX 35632.389] %DST_PROC_AVERAGE_CPU_LOAD        Dst process avg load (% * 100)
[NFv9 57862][IPFIX 35632.390] %DST_PROC_NUM_PAGE_FAULTS         Dst process num pagefaults
[NFv9 57866][IPFIX 35632.394] %DST_PROC_PCTG_IOWAIT             Src process iowait time % (% * 100)
Thanks to this new plugin it is possible to know for each flow peer the process name/PID/father-PID/memory/IO/CPU used during the duration of the flow. As this information is exported on a standard format, all flow collectors on the market can use nProbe generated flow to enhance their monitoring experience. However we have decided to do something special in ntopng to make system information a first class citizen.
Running the System
You can find binary, ready-to-use packages at
- http://apt.ntop.org/ (Ubuntu Server)
- http://rpm.ntop.org/ (CentOS/RedHat Server)
that you can install via apt-get or yum depending on your platform: you need to install nprobe, pf_ring and ntopng. Also remember that the sysdig kernel module must be loaded prior to run the system (i.e. do “sudo modprobe sysdig_probe”).
In order to activate system+network monitoring, you can start nProbe v7 (flow probe) as follows
nprobe -T “%IPV4_SRC_ADDR %L4_SRC_PORT  %IPV4_DST_ADDR %L4_DST_PORT %IN_PKTS %IN_BYTES
%FIRST_SWITCHED %LAST_SWITCHED” %TCP_FLAGS %PROTOCOL @PROCESS@ %L7_PROTO --zmq “tcp://*:1234”
-i any --dont-drop-privileges -t 5 -b 2
then start ntopng (flow collector – you need to use 1.2.1 or the code currently in SVN) as follows (note that you can merge process information coming from various hosts onto the same ntopng interface so that it is automatically merged):
ntopng -i tcp://nprobe1.ntop.org:1234,tcp://nprobe2.ntop.org:1234 …
At this point ntopng is ready to combine system with network activities as shown below. Note that as nProbe has visibility restricted to local system events, you need to install it on each system on which you want to have system visibility.
-
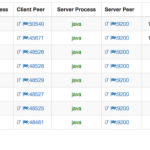
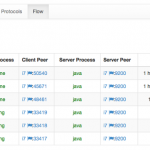
- Active Flows per Process
-
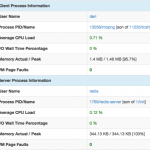
- Flow Process Drill Down
-
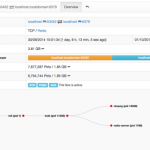
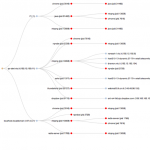
- Flow Process Hierarchy
-
- Host Network Processes
-
- Process Procol Drill Down
-
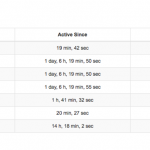
- Processes Timeline
-
- System and Hosts Network Interactions
-
- User Flows and Processes
Visualising Flows and Processes on ElasticSearch/Kibana
If all this is not what you are looking for, we have also integrated ntopng with ElasticSearch, a flexible big-data system, that allows you to store flows on a distributed and replicated environment for long term historical analysis (just start ntopng adding -F es).
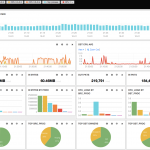
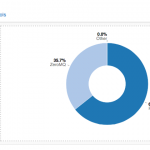
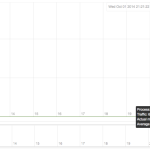
We are also developing custom dashboards built on top of Kibana, for letting you create in a few minutes your custom flow/process monitoring dashboard. Above you can find some sample dashboards.
What’s Next
At the moment we’re monitoring just processes that make network activities but the plan is to monitor all processes, regardless of them sending any byte on the wire. Furthermore we want to extend the ntopng process visibility with new reports to make processes/memory/users first class citizens.
Final Remarks
nProbe and the process plugin, as well ntopng are immediately available from http://packages.ntop.org packaged for CentOS and Ubuntu platforms. It is now time to really see what is really happening on your system going beyond the classic network flow monitoring paradigm.
If you want to learn more about this project, you’re welcome to attend the ntopng tutorial at the upcoming LISA 2014 conference that will take place next month in Seattle, WA.