On May 12th in Bolzano (I) at the Nagios World Conference Europe, I will give a speech about network and application latency monitoring using nProbe. This is an hot topic, in particular for those who think of NetFlow/IPFIX as just a way to count bytes and packets. NetFlow/IPFIX instead is (this is my opinion) an open protocol that can be used to carry monitoring data from observation points to monitoring systems. The fact that many probes export you just bytes ‘n packets info, it’s not a protocol limitation but a probe limitation.
In this respect nProbe supports many extensions such as latency monitoring, information about packets out-of-order, retransmitted, fragmented, average flow packet size and many more. In particular, latency is computed both as network and application latency:
| Network Latency (Network Delay on nProbe parlance) |
|---|
 |
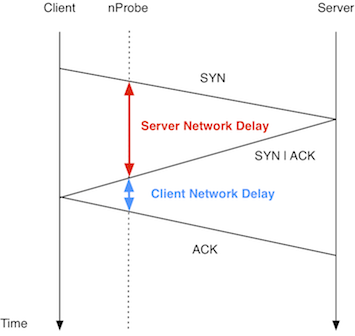
Network delay is computed observing (at the nProbe observation point that can be anywhere between the client and the server) the 3-way-handshake packets and computing the time difference between them. As these packets are processed in the IP protocol stack, we assume that there’s little (if any) delay added by client/server, and what we measure is basically the time taken by packets to traverse the network.
| Application Latency (Application Delay on nProbe parlance) |
|---|
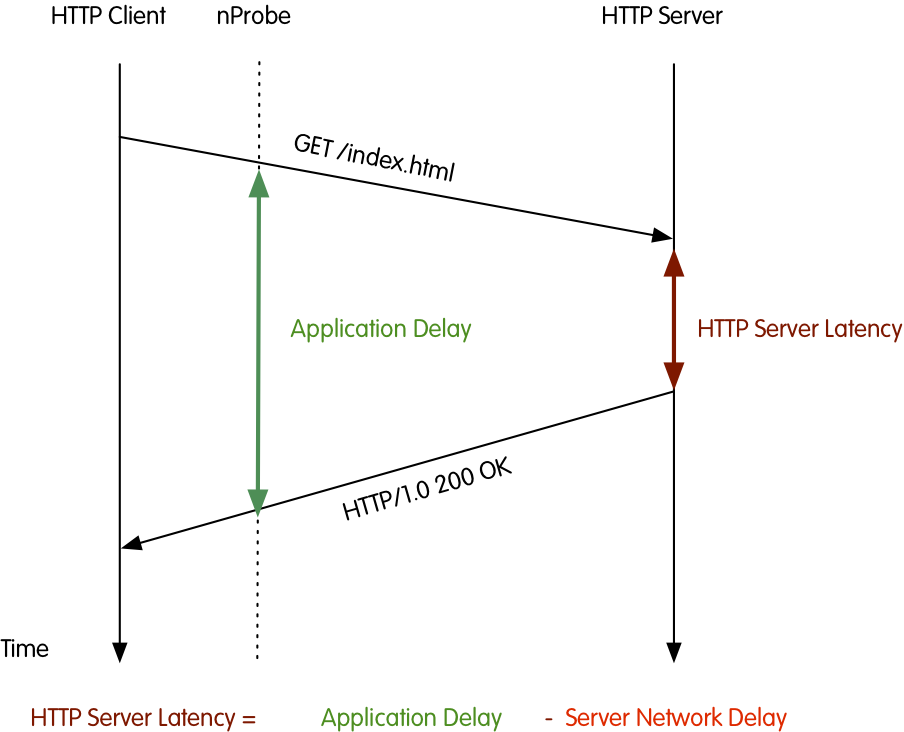
The application latency is the time taken by a server to process a request. nProbe computes it as the time from the first packet with payload sent by the client, and the time of the first response packet following client’s request. If you want to know the whole processing time (from first to last byte of request plus response) you can see it from the flow duration. In the above figure you can see how this works in the case of HTTP. Please note that for same protocols, application latency computation is meaningful (e.g. HTTP, DNS), whereas for others (e.g. SSH, FTP) is not.
Please note that if you enable the HTTP plugin in nProbe, you can get per-URL flow information as nProbe in that more will decode HTTP and follow requests, even if they are pipelined in HTTP/1.1 mode over the same TCP connection.
If you compute the difference between application and the total network delay, you can obtain the application latency as shown in the above figure.
If you come to the conference, you will hear more about this subject.
Hope to see you soon in Bolzano!

