
VoIP applications usually limit theirs monitoring capabilities to the generation of CDR (Call Data Records) that are used for the generation of billing/consumption data. In essence you know how many calls a certain user/number has made, the duration etc. While this information can be enough for basic monitoring, it is not enough for guaranteeing reliable call quality as these systems are essentially blind with respect to call quality. Wireshark can analyse both call signalling and voice, but it is a troubleshooting tool meaning that it cannot be used for permanent monitoring but just for analysing specific situations when there is a specific problem to analyse.
Fortunately you can complement CDR with realtime VoIP traffic monitoring and voice quality analysis using nProbe Pro (with VoIP plugin) and ntopng. All you need is to send nProbe (usually via a span port or network tap) the VoIP traffic (or if you want all your network traffic including VoIP) for analysis. Via redis, nProbe is able to analyse SIP, RTP, RTCP and to correlate SIP with RTP, so that you know for each RTP stream what is the call it belongs to.
Supposing that the traffic to monitor is received on eth1 all you need to do is to start the following applications (in the example below thay have been started on the same machine but via ZMQ flows can be sent remotely over the network in an encrypted format)
# nprobe -i eth1 -T "%IPV4_SRC_ADDR %IPV4_DST_ADDR %IPV4_NEXT_HOP %INPUT_SNMP %OUTPUT_SNMP %IN_PKTS %IN_BYTES %FIRST_SWITCHED %LAST_SWITCHED %L4_SRC_PORT %L4_DST_PORT %TCP_FLAGS %PROTOCOL %L7_PROTO @SIP@ @RTP@" --redis localhost --zmq tcp://127.0.0.1:1234

$ ntopng -i tcp://127.0.0.1:1234
In essence nProbe analyses the traffic and sends ntopng flows via ZMQ. ntopng collects the flows and display them on the user interface. Inside the nProbe template there are two special information elements @SIP@ and @RTP@: they represent a wildcard for various information elements such as SIP caller/called or RTP codecs. This way users can forget about VoIP details and focus on monitoring traffic
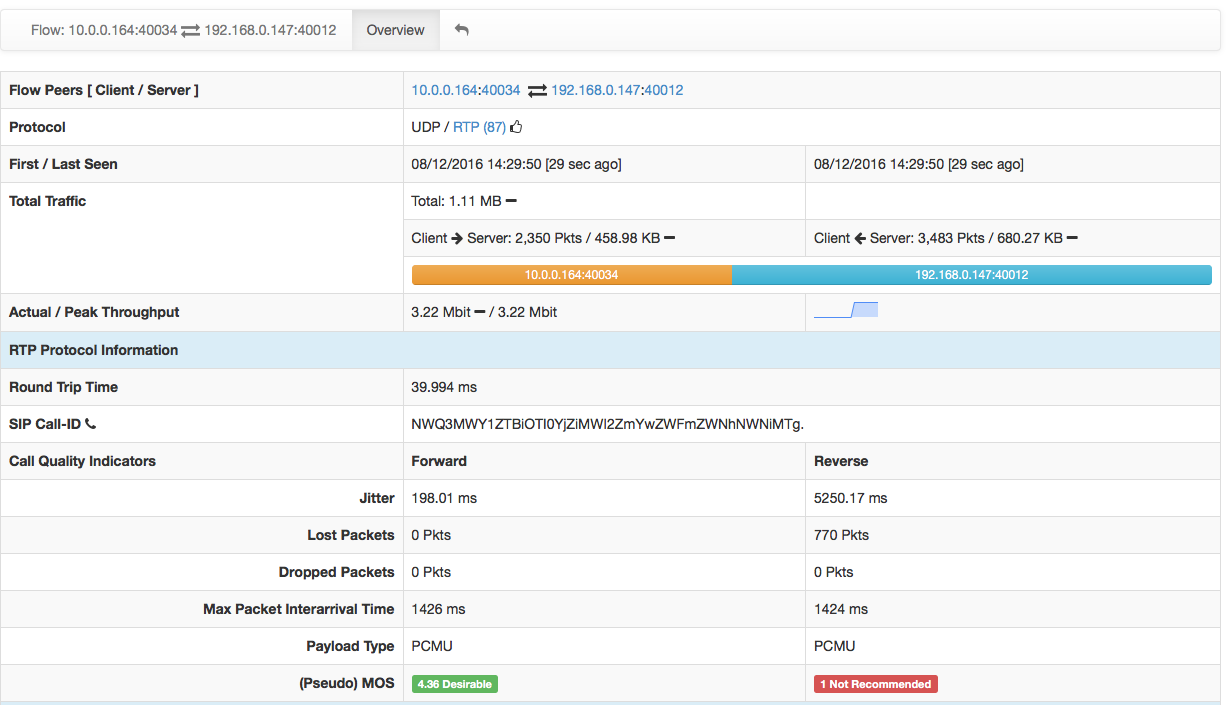
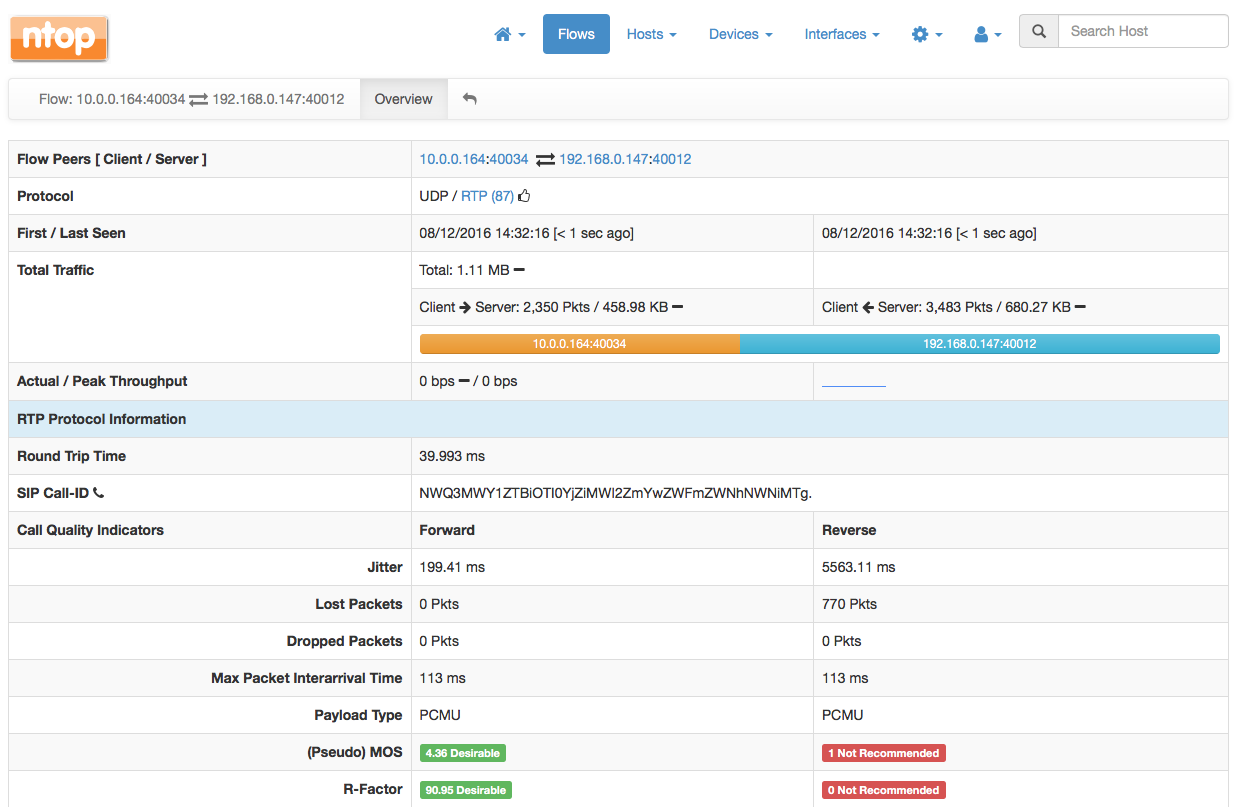
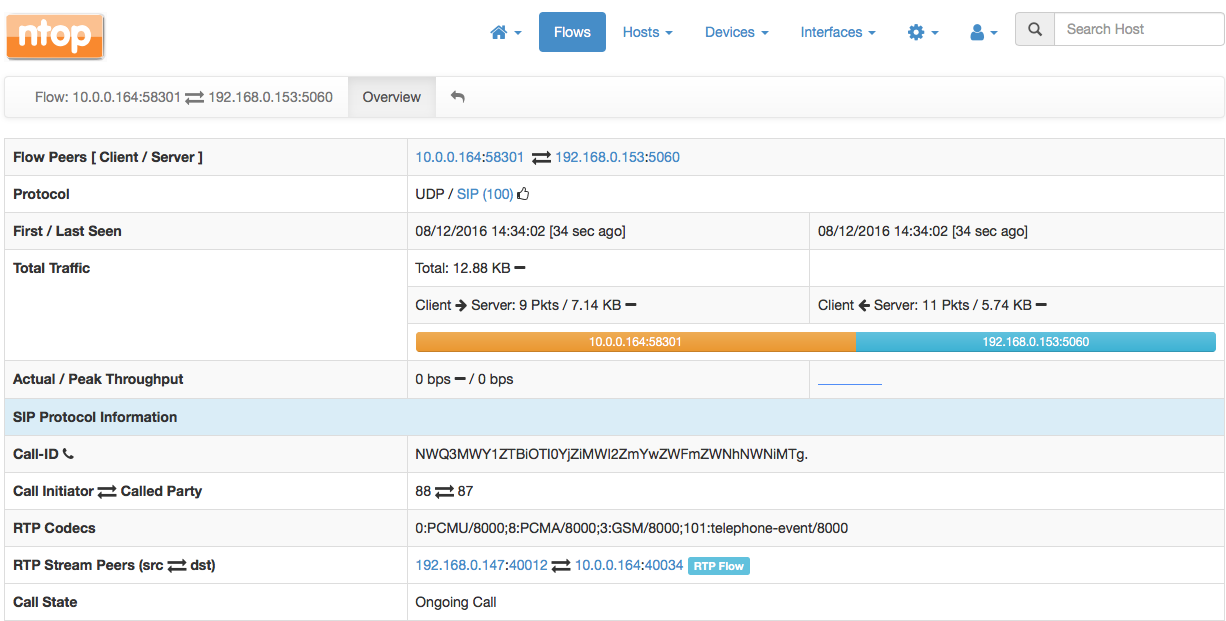
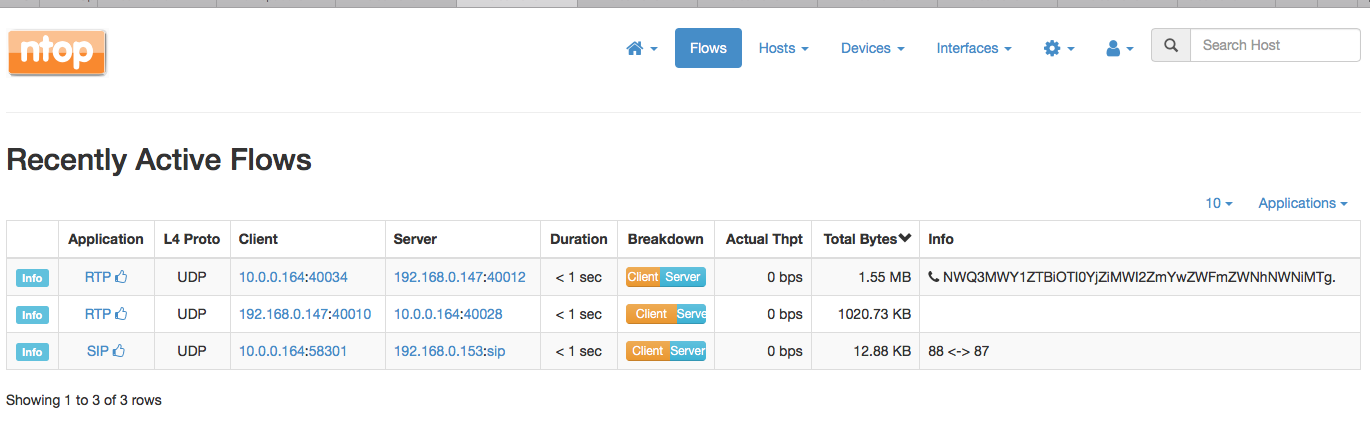
As you can see, ntopng interprets the VoIP information and represents it in a user-friendly way. It reports not just about CDRs, but it can analyse voice quality by computing pseudo-MOS. This enables network administrators to spot calls with bad quality and try to find a solution to the problem. If you enable in ntopng the export to ElasticSearch and/or MySQL, you can dump call information persistently on a database or use Kibana to create a dashboard about VoIP calls.
# StartTime[epoch]	EndTime[epoch]	SIP_Server[ascii:32]	ClientIP[ascii:32]	CallId[ascii:64]	CallingParty[ascii:64]	CalledParty[ascii:64]	RTPInfo[ascii:64]	SIPFailureCode[uint]	ReasonCause[uint]	Packets[uint]	CallState[ascii:64]	StateMachine[ascii]
#
1481205353	1481205353	212.13.205.165	10.96.5.59	b654d999b6321def238939c5d48ce777@10.37.129.2	brix <sip:brix@testyourvoip.net>	<sip:tyv@212.13.205.165>	10.37.129.2:50070,212.13.205.165:50422	200	0	12105	CALL_COMPLETED	INVITE=1481205353,TRYING=0,RINGING=1481205353,INV_RSP=1481205353,BYE=1481205353,CANCEL=0
1481205353	1481205353	10.96.5.59	212.13.205.165	400ad5a7a28e421f355369a9fc8910ee@192.168.1.101	brix <sip:brix@testyourvoip.net>	<sip:tyv@212.13.205.165>	212.13.205.165:50390,0.0.0.0:0	200	0	5	CALL_IN_PROGRESS	INVITE=0,TRYING=0,RINGING=1481205353,INV_RSP=1481205353,BYE=0,CANCEL=0
Above you can find an excerpt of a call sample. The whole list of SIP
%SIP_CALL_ID               	SIP call-id
%SIP_CALLING_PARTY         	SIP Call initiator
%SIP_CALLED_PARTY          	SIP Called party
%SIP_RTP_CODECS            	SIP RTP codecs
%SIP_INVITE_TIME           	SIP time (epoch) of INVITE
%SIP_TRYING_TIME           	SIP time (epoch) of Trying
%SIP_RINGING_TIME          	SIP time (epoch) of RINGING
%SIP_INVITE_OK_TIME        	SIP time (epoch) of INVITE OK
%SIP_INVITE_FAILURE_TIME   	SIP time (epoch) of INVITE FAILURE
%SIP_BYE_TIME              	SIP time (epoch) of BYE
%SIP_BYE_OK_TIME           	SIP time (epoch) of BYE OK
%SIP_CANCEL_TIME           	SIP time (epoch) of CANCEL
%SIP_CANCEL_OK_TIME        	SIP time (epoch) of CANCEL OK
%SIP_RTP_IPV4_SRC_ADDR     	SIP RTP stream source IP
%SIP_RTP_L4_SRC_PORT       	SIP RTP stream source port
%SIP_RTP_IPV4_DST_ADDR     	SIP RTP stream dest IP
%SIP_RTP_L4_DST_PORT       	SIP RTP stream dest port
%SIP_RESPONSE_CODE         	SIP failure response code
%SIP_REASON_CAUSE          	SIP Cancel/Bye/Failure reason cause
%SIP_C_IP                  	SIP C IP adresses
%SIP_CALL_STATE            	SIP Call State
and RTP
%RTP_SSRC                       RTP Sync Source ID
%RTP_FIRST_SEQ             	First flow RTP Seq Number
%RTP_FIRST_TS              	First flow RTP timestamp
%RTP_LAST_SEQ              	Last flow RTP Seq Number
%RTP_LAST_TS               	Last flow RTP timestamp
%RTP_IN_JITTER             	RTP jitter (ms * 1000)
%RTP_OUT_JITTER            	RTP jitter (ms * 1000)
%RTP_IN_PKT_LOST           	Packet lost in stream (src->dst)
%RTP_OUT_PKT_LOST          	Packet lost in stream (dst->src)
%RTP_IN_PKT_DROP           	Packet discarded by Jitter Buffer (src->dst)
%RTP_OUT_PKT_DROP          	Packet discarded by Jitter Buffer (dst->src)
%RTP_IN_PAYLOAD_TYPE       	RTP payload type
%RTP_OUT_PAYLOAD_TYPE      	RTP payload type
%RTP_IN_MAX_DELTA          	Max delta (ms*100) between consecutive pkts (src->dst)
%RTP_OUT_MAX_DELTA         	Max delta (ms*100) between consecutive pkts (dst->src)
%RTP_SIP_CALL_ID           	SIP call-id corresponding to this RTP stream
%RTP_MOS                   	RTP pseudo-MOS (value * 100) (average both directions)
%RTP_IN_MOS                	RTP pseudo-MOS (value * 100) (src->dst)
%RTP_OUT_MOS               	RTP pseudo-MOS (value * 100) (dst->src)
%RTP_R_FACTOR              	RTP pseudo-R_FACTOR (value * 100) (average both directions)
%RTP_IN_R_FACTOR           	RTP pseudo-R_FACTOR (value * 100) (src->dst)
%RTP_OUT_R_FACTOR          	RTP pseudo-R_FACTOR (value * 100) (dst->src)
%RTP_IN_TRANSIT            	RTP Transit (value * 100) (src->dst)
%RTP_OUT_TRANSIT           	RTP Transit (value * 100) (dst->src)
%RTP_RTT                   	RTP Round Trip Time (ms)
%RTP_DTMF_TONES            	DTMF tones sent (if any) during the call
information elements are reported above.
Thanks to PF_RING, using nProbe it is possible to monitor large VoIP networks using a low-cost x86-based server with tent of thousand concurrent calls. Advanced users can instruct nProbe also to create call logs (you need to add –sip-dump-dir <dump dir> to the nProbe command line) in addition to exporting data to ntopng.
Happy VoIP traffic monitoring!